Bard
BardParticipant
Master
Hi
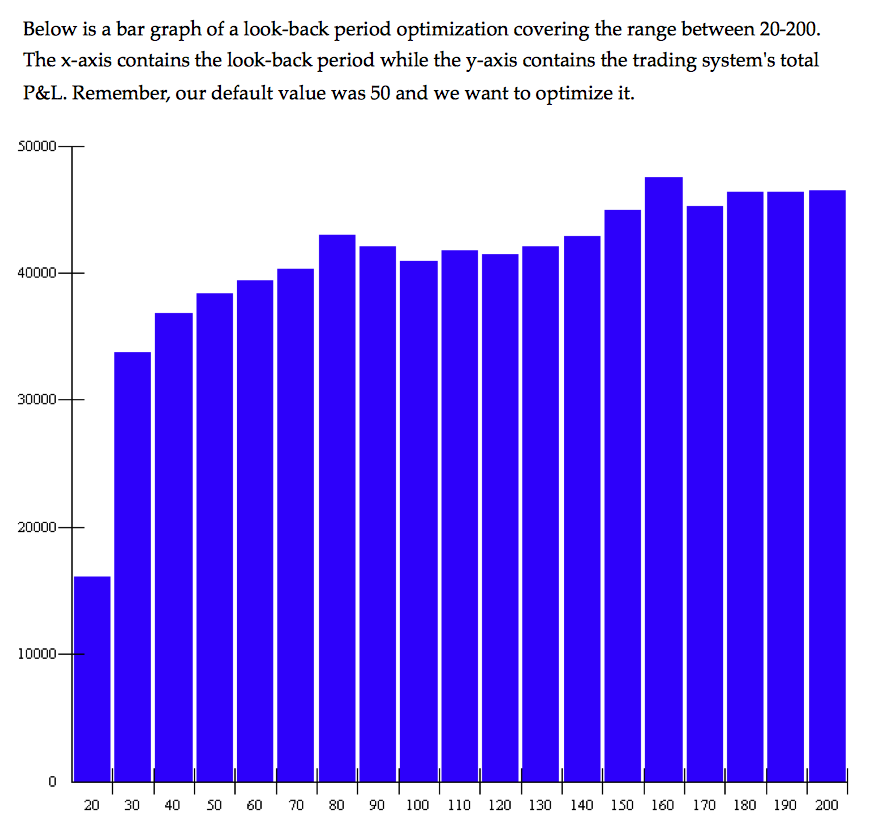
Is is it possible in PRT to create graphs of optimised values? I see this technique referenced in many trading blogs for Multicharts/Tradestation etc. Please see image attached:
The theory is something Andreas Unger also uses (4 times winner of the Robbins World Cup Trading Championship).
The theory on how to use this form of optimisation is covered in the informative Jeff Swanson, System Traders Success website (page 9):
https://s3.amazonaws.com/LeadMagnet/Optimization_Without_Curve_Fitting_v100.pdf
Thanks
I used to work a little with Andrea, nice person.
By “lookback period”, you mean the backtest period?
BardParticipant
Master
Yes, he seems to have a good sense of humour too, I just listened to one of his trading seminars on a DAX breakout system.
I should have explained better, I was referring to the number of periods to use in a moving average: (From the link above – p9)
“Let’s say we are attempting to optimize a look-back period for a moving average. Let’s also
say the default value is currently 50. When optimizing this value I want to look for two
things. First, if the default value is optimized. Second, if other nearby values produce similar
results. In short, I would like to test the robustness of the look-back period. For example, if
we change the 50-day default value to 49 or 51, I don’t want to see the system’s equity curve
drastically change. Furthermore, the system should not radically change if I use 47 or 52. The
neighboring values around 50 should still produce positive results and in fact, produce
similar results. Actually it would be ideal to see the system remain profitable over a wide
range of values.”
p.s. Did you manage to receive the email/ebook okay?
Well it’s not possible to create such graphs in PRT, but since you can export the optimised results of the variables range (by copy/paste the optimisation window results) to Excel, you could make some nice charts from there 🙂
p.s. Did not receive anything sorry. If you want to send large files, upload them with a file transfer website like wetransfer or another one!
Thid is an interesting topic. How do we go about setting the lookback period dynamically? For example the average length of the last 10 cycles?
This could be a more adaptive approach compared to fixed settings.
BardParticipant
Master
Me an Excel don’t get along, lol… Does anyone know how to draw graphs once the data is imported?
Is this a feature that PRT have considered adding?
p.s. I have resent it with a Dropbox link by email to contact @ prorealcode .com Subject: FAO: Nicolas. Enjoy.
@Derek – Sorry, when you say dynamically and average length of the last 10 cycles, I didn’t quite understand?
How do we go about setting the lookback period dynamically? For example the average length of the last 10 cycles?
By using adaptive period moving average? But I suppose you want these periods to adapt automatically to the best strategy performance instead of the better period to follow the price?
I will check the AMA and get back to this thread later. Thanks.
BardParticipant
Master
Me and Excel are getting on better these days…
To export data out of the Detailed Results window, place the mouse anywhere over the financial results columns and drag to the desktop. Drag the text clipping file into Excel and choose charts in the top menu.
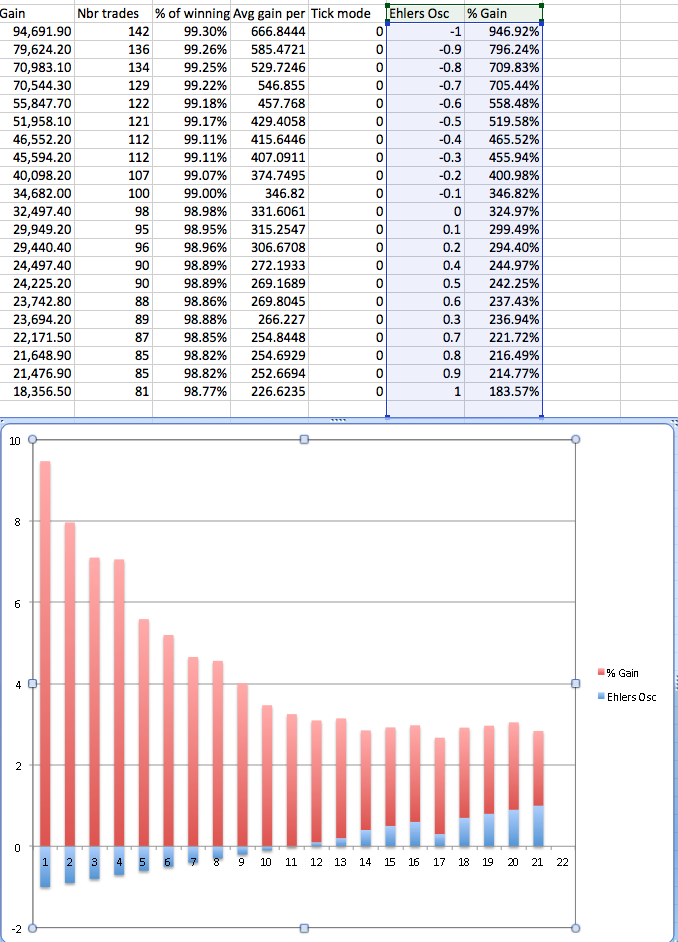
Nicolas, I understand there is no way of getting the Drawdown % and Max Drawdown in the Results tables into Excel so you can graph optimised parameters versus drawdown? This seems like an oversight, not least because one of a traders main concerns apart from exits is the level of drawdown. I wondered if you could also ask for this feature? When running optimisation values there needs to be a way of comparing an indicator value that’s been optimised with the drawdown % and/or max drawdown so that you can find a stable range of parameter values that can be used in live trading. Please see the screenshot which shows an optimised oscillator range of values compared to % profit.
Ideally a 3-d graph of gains v’s drawdowns and the optimised parameter would be necessary to give a good indication for profitable out of sample trading. Note: the Ehler’s Osc values on the x axis from 1 to 21 refers to the table values from -1 across to +1, — although I’m not sure the gain chart is correct as the profit in the tables did rise in lock step with the Oscillator values going from 1 to -1.
The idea is if you wanted to only go Long when Oscillator values were >= 0 (value 11) you can look for a stable range of values versus profit and choose the middle of that range knowing live trading is more likely to follow the optimisation results)
I have added this idea to https://www.prorealtime.com/en/contact?suggestion=1
Cheers Bard
Optimising on other criteria that global profit is something I already asked for. I’m hoping it will be something that would take part of the to-do list of PRT programmers! But I think it will, I discussed a lot about it recently..
About graphing your maximum drawdown, you can use the MAE/MFE of the result window, these values are only viewable for the current backtest result, but it should help you determine what is the lowest drawdown for each strategy : understand make a percentage distribution of worst MAE in Excel and adjust your stoploss into your strategy.