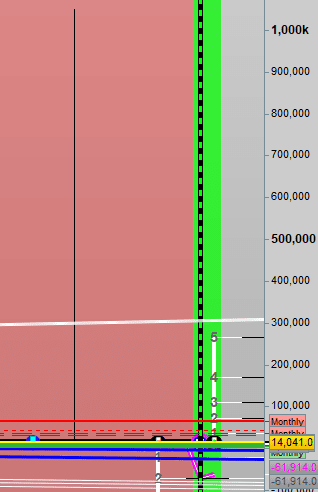
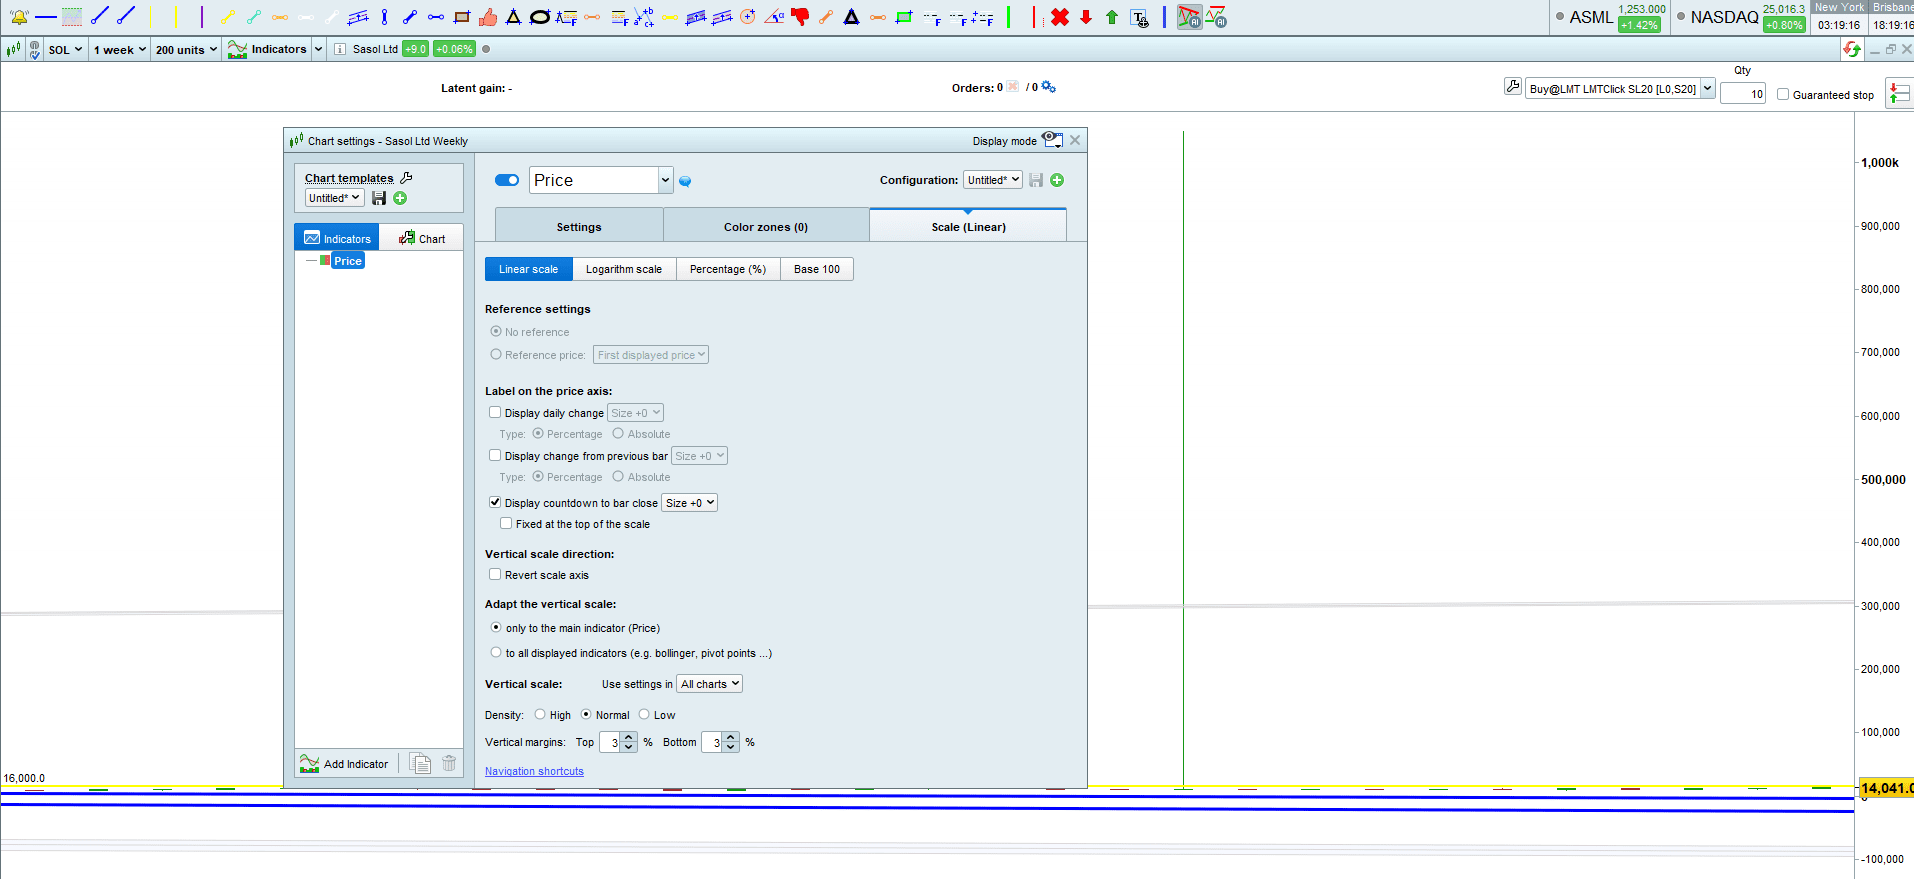
VBParticipant
New
Hi all, I have noticed on multiple charts of the securities that i monitor, that there are price spikes up to 1,000k on Daily and weekly charts which make all of my indicators useless – How is this eliminated – Is this something that has to be removed from the price Data by IG/ Pro Real time or is there a way to have them eliminated from the charts via programming- I have reported this previously via the Help function but not received any reply.
Regards
Vishal
I think that’s because one of your indicators applied on price is returning a value off scale of the current price.
In order to get rid of it, go to price settings and scale, and select use price only. The vertical scale will then use only the stock price to adapt.
VBParticipant
New
Hi Nicolas
I think it is from the Source Data – I have Reverted to one of the Default ProRealtime Charts, removed all indicators except price and adapted vertical scale to main Indicator (Price) and still have the Same result. You Would be able to replicate on the following shares – Sasol (SOL), Anglo American (AAL), (AGL), BHP (BLT).
Regards
Vishal
I’m sending this to the data team and let you know.