How to draw a DOT/Diamond/Line in the middle of a candle?

Viewing 8 posts - 1 through 8 (of 8 total)

  • Author
    Posts
  • #43199 quote
    rsi500rsi500
    Participant
    New

    Hi guys,

    i would like to “plot a dot” (-> sounds funny…) in the middle of each candle.

    DOT = (High-Low)/2      ==>should be the middle of the candle.

    any advice or links?

    #43204 quote
    AVTAVT
    Participant
    Senior

    Should be something like this – untested:

    // if you only need for example the last 50 bars dotted, uncomment next line
    //DEFPARAM CalculateOnLastBars=50
    
    // the dot value
    dotval=(high-low)/2
    // the red, green, blue values of RGB colour
    R=0
    G=0
    B=255
    
    // printing
    // instead of keyboards dot you can use "•" or "●" 
    DRAWTEXT(".",barindex,dotval,Standard,Bold,12) coloured(R,G,B)
    
    RETURN
    #43211 quote
    rsi500rsi500
    Participant
    New

    Hi AVT,  thank you very much for your code. It plots dots!

    But unfortunately not at the middle of a candle.

    it plots dots 🙂 below the price chart in a new “window”

    and for some reasons not  for every candle.

    Anyone an idea how to get the dots up to the price chart “into” the candles?

    PS: i replaced Line 13 “standart” by “serif” because of a syntax error message.

    CandleDots.jpg CandleDots.jpg
    #43213 quote
    rsi500rsi500
    Participant
    New

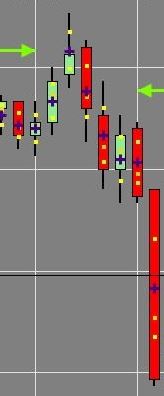
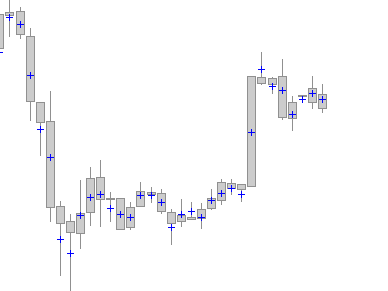
    maybe this screenshot will show more in detail what i am looking for.

    One dot in the middle of each candle will be enough. multiple dots per candle are not necessary.

    CandleDots2.jpg CandleDots2.jpg
    #43223 quote
    AVTAVT
    Participant
    Senior

    Sorry, my fault: the dotval in above is just calculating the middle of the candle range. One step more needed: substract the middle from candles high. So we would use this (tested now 🙂 )

    // if you only need for example the last 50 bars dotted, uncomment next line
    //DEFPARAM CalculateOnLastBars=50
    
    // middle of candle range
    middle=(high-low)/2
    // dot value
    dotval=high-middle
    
    // the red, green, blue values of RGB colour
    R=0
    G=0
    B=255
    
    // printing
    // instead of keyboards dot you can use "•" or "●" 
    DRAWTEXT("+",barindex,dotval,Dialog,Bold,12) coloured(R,G,B)
    
    RETURN

    to get it into your candles chart, use the gripper in that window and then add indicator.

    Hope that’s ok now for you

    #43225 quote
    AVTAVT
    Participant
    Senior

    uups, forgot pic (attached) if you want the + sign exactely in the middle (left/right viewed) use monospaced.

    Nicolas and rsi500 thanked this post
    middot.png middot.png
    #43251 quote
    NicolasNicolas
    Keymaster
    Legend

    @rsi500

    Add the indicator on the price chart (use the wrench at the upper left side of the price chart).

    rsi500 thanked this post
    #43330 quote
    rsi500rsi500
    Participant
    New

    Dear AVT, it works perfectly!

    Thank you very much! Great job!


    @Nicolas
    : thank you too. to use the upper left side of the price chart to add the indicator was really very helpful for me 😉

    thank you guys!

Viewing 8 posts - 1 through 8 (of 8 total)
  • You must be logged in to reply to this topic.

ProRealAI ProRealAI New

Stuck on this ProBuilder code?

Describe what this topic is trying to build, in plain English, and ProRealAI writes the ProRealTime™ indicator, screener or system for you.

Available in 7 languages
Try ProRealAI

How to draw a DOT/Diamond/Line in the middle of a candle?


ProBuilder: Indicators & Custom Tools

New Reply
Author
author-avatar
rsi500 @rsi500 Participant
Summary

This topic contains 7 replies,
has 3 voices, and was last updated by rsi500rsi500

9 years, 1 month ago.

Topic Details
Forum: ProBuilder: Indicators & Custom Tools
Language: English
Started: 08/15/2017
Status: Active
Attachments: 3 files
ProRealCode ProRealCode
Loading...