HOW TO COMPARE BACK TESTED CHARTS

Viewing 8 posts - 1 through 8 (of 8 total)

  • Author
    Posts
  • #241713 quote
    steynpjsteynpj
    Participant
    Average

    I saw it before, but can not configure the setting now.

    How do I compare two or more charts of gain/loss from back testing results on 1 screen/window?

    Thanks

    #241723 quote
    GraHalGraHal
    Participant
    Master

    Backtest System1 then backtest System2 and they will both appear on the same window.

    Iván González thanked this post
    #241733 quote
    steynpjsteynpj
    Participant
    Average

    That is the problem. My setup was like that before, now the chart just get replaced, not shown below.

    #241742 quote
    Iván GonzálezIván González
    Moderator
    Legend

    Hi. Can you take a screenshot of what you have right now when loading the 2 strategies?

    #241773 quote
    steynpjsteynpj
    Participant
    Average

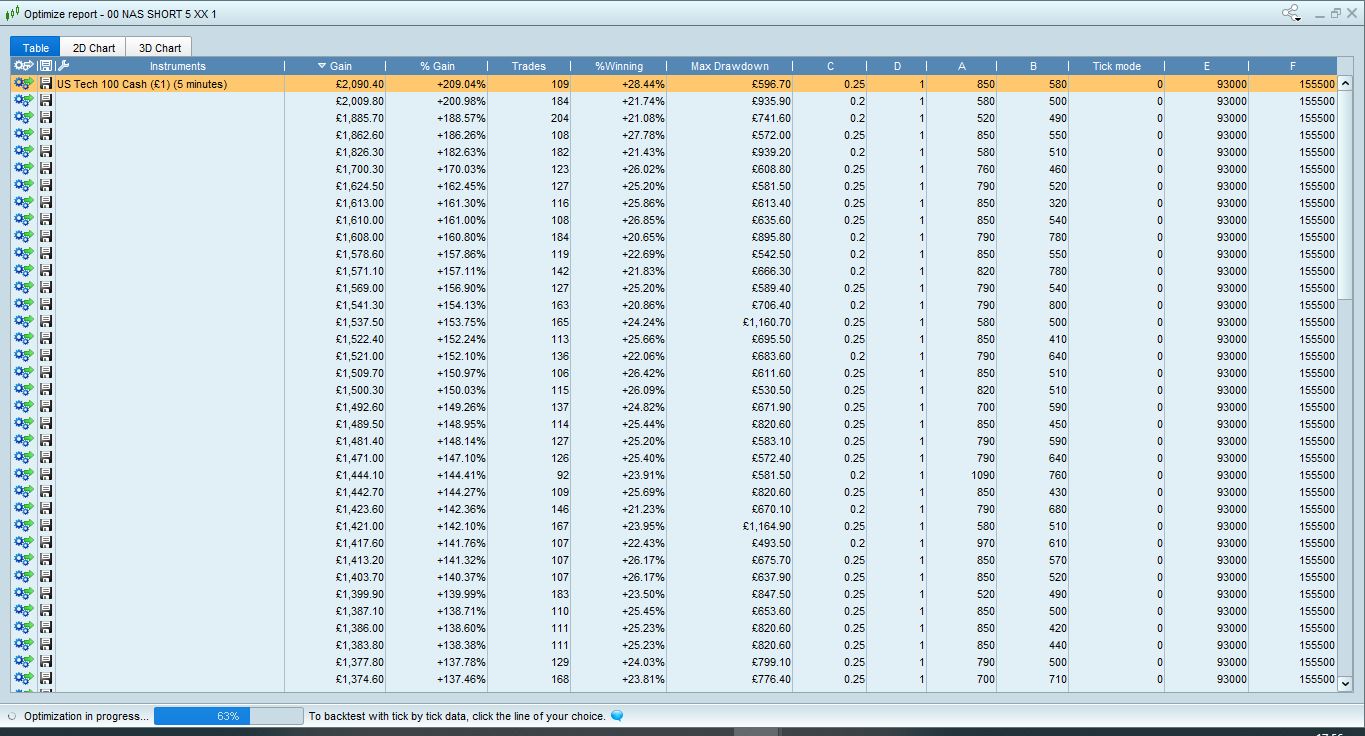
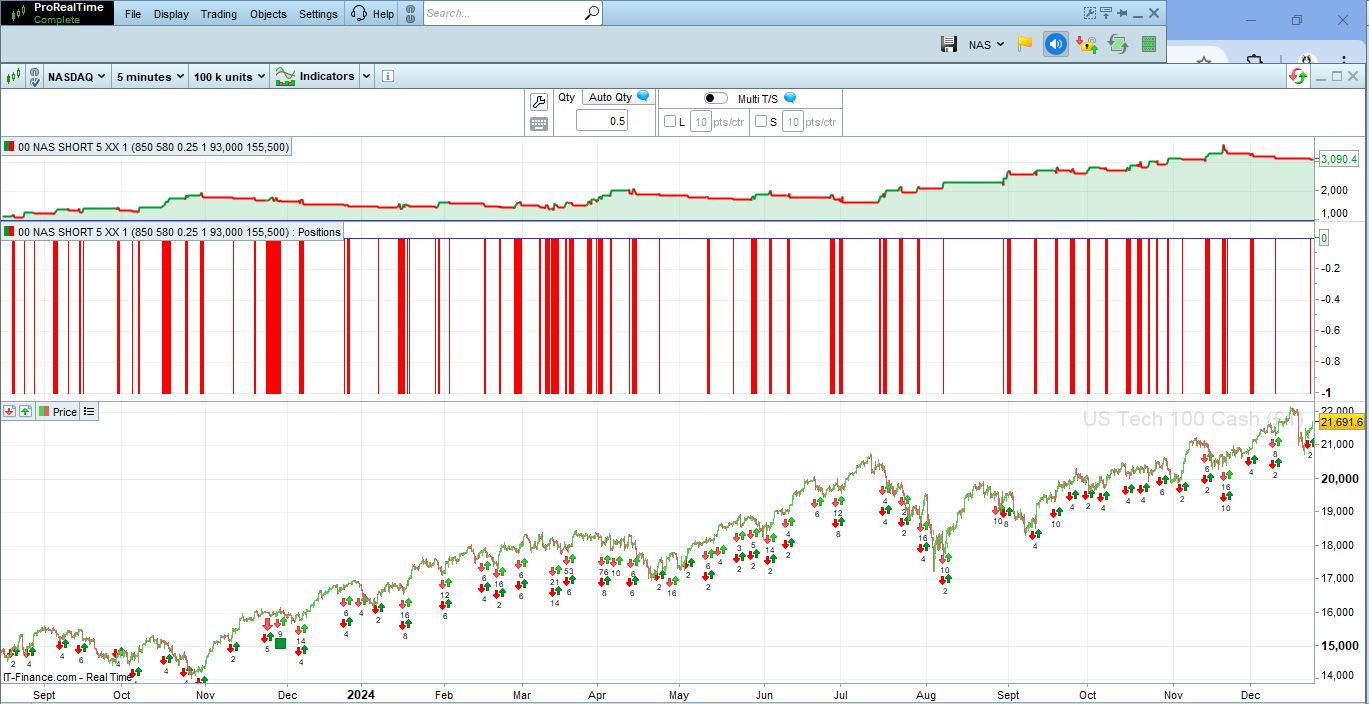
    ATTACHED SCREENSHOT OF LIST OF EQUITY CURVE AND SCREENSHOT OF CHART WITH.

    WHEN I CLICK ON NEW RESULT ROW, CHART GETS REFRESHED, AND OLD EQUITY/GAIN CHART REMOVED., THUS I CAN NOT COMPARE

    Capture1.jpg Capture1.jpg 2.jpg 2.jpg
    #241780 quote
    GraHalGraHal
    Participant
    Master

    Backtesting results have always been as you state above … each new row clicked replaces the equity curve of the previous row clicked.

    To achieve what you want to do, you need to ‘save the new results row’ as a new System … you can easily do this by clicking on the icon 2nd from left on your 1st screenshot and choosing the option for ‘new system’ … I’m going from memory, so if you have problems let us know and we will post more info.

    Tip:
    New System name has to be no more than 30 characters.

    Iván González thanked this post
    #241781 quote
    steynpjsteynpj
    Participant
    Average

    Thank you, I think you are correct.


    I just noticed if you run 2 consecutive back tests both equity charts are on same window (same as your suggestion).


    I hoped I could see 2 equity charts from same “optimization report”. Seems not.


    Now I lost “optimization report” on back testing. I get other results. (closed trades, trade history etc)


    Any ideas?


    Thank you a lot.

    #241783 quote
    GraHalGraHal
    Participant
    Master

    Now I lost “optimization report” on back testing

    Why not just run the optimisation report again?

    You may mean something else?

Viewing 8 posts - 1 through 8 (of 8 total)

  • You must be logged in to reply to this topic.

ProRealAI ProRealAI New

Stuck on this ProBuilder code?

Describe what this topic is trying to build, in plain English, and ProRealAI writes the ProRealTime™ indicator, screener or system for you.

Available in 7 languages
Try ProRealAI

HOW TO COMPARE BACK TESTED CHARTS


ProOrder: Automated Strategies & Backtesting

New Reply
Author
author-avatar
steynpj @steynpj Participant
Summary

This topic contains 7 replies,
has 3 voices, and was last updated by GraHalGraHal

1 year, 8 months ago.

Topic Details
Forum: ProOrder: Automated Strategies & Backtesting
Language: English
Started: 12/22/2024
Status: Active
Attachments: 2 files
ProRealCode ProRealCode
Loading...