@Grahal, man that is one v busy looking chart! I am a total simpleton by comparison, can only process info from 2 or 3 indicators max.
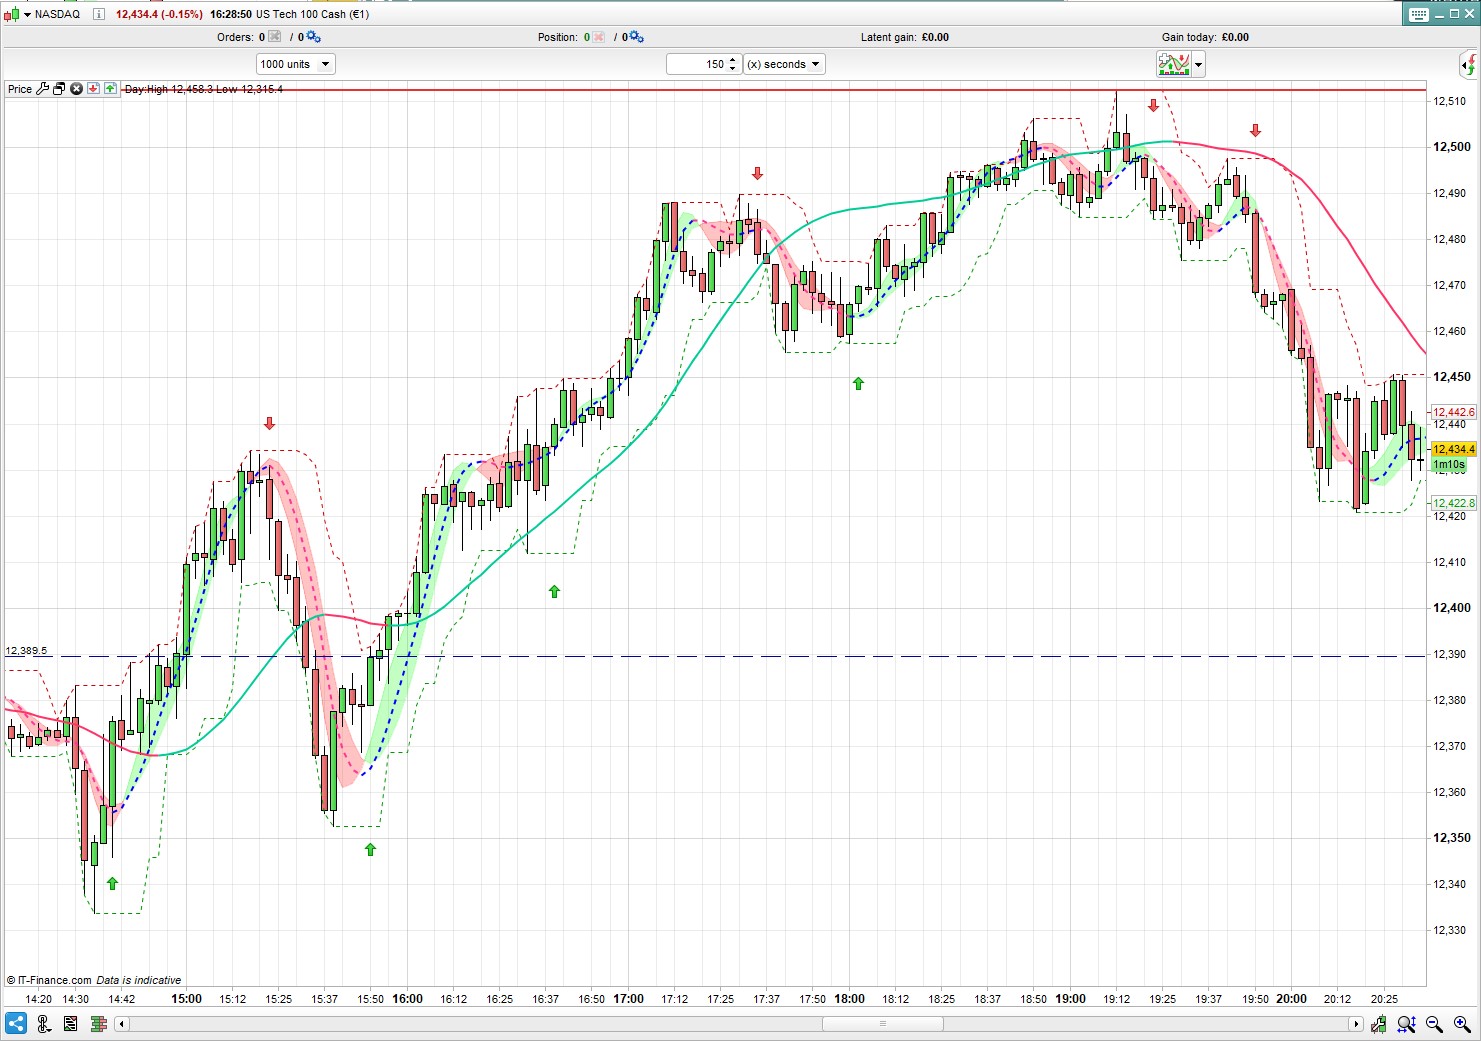
I’m still working the FTSE in the mornings (2m Hull 13), but trialing the attached setup on the NAS for my afternoon session: 150 seconds (half a 5m candle), Hull 13 x 21 crossover plus Hull 17 walking the middle path. Hull 100 simulates the 15m trend. Could prob simplify it further by removing the cloud but I find useful, esp for exits. So far this seems to give fairly reliable signals without too much whipsaw.
@Grahal my brain is about blow up.
thanks tips and advice.
Is there a way to code so when the dots change color?
Iv changed the Hull 9.
did you get the other strategy to work
nonetheless?
or are you sticking to the one you posted first?
i’ve tried the first one you posted and it seems to work although it can be very choppy and trades tend to be very short, or its just me scared of holding longer 🙂
Hi
just came across this thead and im interested in incorporating the Hull 13 into one of my existing algos.
The logic is along the lines of “if Hull is on trend then”
I can see how to get the hull, I can see it on my chart, is it possible to get the algo to know if its on or off trend as part of its logic?
cheers
Apologies, just found the code further up that did this, im an idiot 🙂
 Jan
JanParticipant
Veteran
Goodmorning Nonetheless,
Thank you very much for sharing the trading concept ! I can imagine you want a trading machine instead of looking yourself to the 2 minutes chart for the whole day !!
- First I assume that the Hull code you have defined/coded is the same as the standard Hull average in PRT version 11 (indicator1 = HullAverage[13](medianPrice) (not sure if medianPrice meets your Typical price, in the Hull indicator you can select your desired calculation of the bars open close high low.)
2. The basic rule c1
= HULL
> HULL
[1] and HULL
[1]<HULL
[2] generates too many false and too late trade actions when the Hull averages reverses in what I call sloppy trade session (no trend), which happen quit often.
3. As a possible way to avoid those wrong zig zag trading actions, you could make something for opening Long buy, like c1 = HULL[2] = lowest[5](Hull) and close < Hull[1] + 2/1000 * close this rule is quite arbitrary and needs to be tested: the idea behind this rule is GO LONG when the Hull13 average of 2 bars back is the lowest of the last 5 bars Hull13 average and the Close is not run away, not being higher as 0,2% of the pre-last Hull average.
4. The long HULL34 might add value, when defined as HULL34 slope, which is defined as simple as Hull34 – Hull34[4], whereby 4 arbitrary is
When the short HULL is increasing, you would expect the slope to increase ; the slope can be negative, (when the Hull34 is still moving down), but less steep/negative then previously. The slope could also be positive and become more positive.
An additional buy long condition can then be added c2 = SlopeHull34 > SlopeHull34[1]
The slope indicator could be added as an indicator, to better see how the slope behave at different price movements.
5. Additionally your condition implemented : “For example, if the 13 reversed but the 34 maintained a strong trend I would close but not reverse my position, just wait for them both to be moving the same way again.”, that would be a third buying condition. Maybe you can define the STRENGTH of the trend with defining the minimum steepness of the HULL34, comparing the current HULL with the HULL e.g. 3 bars back .
Buy long c3 = average[4](Hull34) – average[4](Hull34)[3] > 0,5 % (arbitrary) (This buy condition prevents reversing into a long position with a strong negative trend)
Reverse the conditions for open short positions.
Be aware that Condition 2 and 3 might give more trend following opening positions, but also prevents aggressive buying/short selling when the short HULL conditions are true.
Hopes it helps you with more ideas to work out an algorithm for your trading, and let the machine make profit for you.
I will in a later stadium test your concept myself in a strategy, hopefully it gives some nice results. If you have further questions, let me know.
PS: You might also try to LOG this average: LOG(Hull34), it might give faster the turnaround signal (not tested myself)
PS 2 You may also like the Heiki Ashi Bar chart presentation, which can standard be selected as an options in the graphs, which in my opinion better presents the trend.
I added an average Heiki Ashi indicator, with average period of 6, which could be added to the graph.
//Heiki Ashi in graph, calculation averaged with Hap bars

Once Hap = 6 //Heiki Ashi Average Period

if barindex < 2 then
HOpen = (open+close)/2
else
HOpen = 0.50 * (hOpen[1]+hClose[1])
endif
HClose = 0.25 * (Open+Close+Low+High)
AvHA = average[Hap]((HOpen+High+Low+Hclose)/4)


if AvHa < AvHa[1] then
ar=128
ag=128
ab=128
else
ar=48
ag=84
ab=150
endif


return   AvHA coloured(ar,ag,ab) style(Line, 4) as "Av Heikin Ashi"
Hi Jan, thanks ever so much for your reply – so many good coding ideas that I look forward to testing.
As for manual trading, I’ve altered my setup a bit – same 2m chart with the basic objective of ‘walking the line’, following the HullMA without over-thinking it – but I was finding that the 13 required a huge amount of concentration to catch every change of direction, often with little advantage.
I’m now using Hull20, plus Hull50 (to simulate the 5m chart) and Hull150 (to simulate the 15m chart). If the 50 and 150 are in agreement then I only go in that direction — exit if the 20 changes colour, then wait for it rejoin the bigger trend. If they are not in agreement, or virtually flat, then I go both ways until i get a breakout.
This generally smooths it out with a lot less chopping and changing, and I also find that it works on any index. Haven’t even tried to code it, but I shall have another go, esp with your SlopeHull idea which could be useful on other algos as well – thanks again!
I don’t really understand what LOG(Hull34) means — how does that work exactly?
JanParticipant
Veteran
Log is a mathematical formula, and stands for Logarithm
https://en.wikipedia.org/wiki/Logarithm
In PRT it can be used by typing LOG before e.g. HULL34. LOG(HULL34)
Do not put too much worth on it, but I think the log average crossing is smoother and earlier than the normal average crossing, so it could help with eliminating sloppy trades. But as said, its need thoroughly testing with HULL averages, regrettable I do not have statistical proof
JanParticipant
Veteran
Puzzling around with the concept of 5 minutes graphs with Hull 25, 50 and 150 averages and slopes
Some kind of momentum indicator can be made from the slopes of the 3 different averages including an total of the 3 slopes, see the code below.
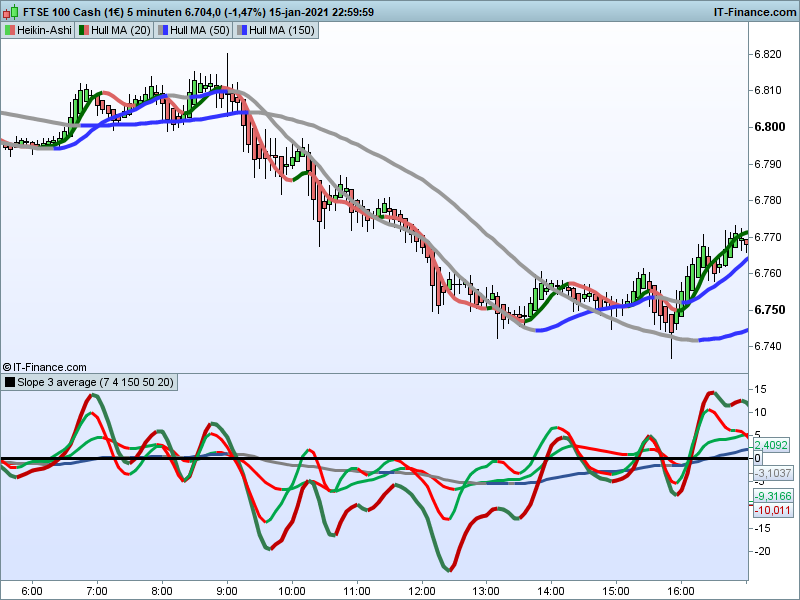
A print-screen of the FTSE showing Heiki Ashi bars with the Hull averages and the slope indicator is attached.
In a trending market it would be easy: if the total of the slopes come above zero, go long. But in a zigzag trading market, this does not work. Maybe a combination of slope and average Hull works sufficient.
Comments or suggestions appreciated
//Slope of  3 averages  with a total slope  based upon predefined averages

//Once TypeAv = 7  //Hull Average
//Once LongPer = 150
//Once MediumPer = 50
//once ShortPer = 20
//Once Bars = 4


if barindex <= 6 then
ShortAv = close
Av = close
LAv = close
else
ShortAv = Average[ShortPer,TypeAv](close) // short average
Av = Average[MediumPer,TypeAv](close)  // middle average
LAv = Average[LongPer,TypeAv](close)  // long average
endif
SShortAv = ShortAv - ShortAv[Bars] //slope short average
SAv = Av - Av[Bars]  // slope middle average
SLAv = LAv - LAv[Bars] // slope long average
CombiSlope =  SAv + SLAv + SShortAv//nett slope of the 3 averages

if SShortAv < SShortAv[1] then
ar = 255 //51
ag = 0 //125
ab = 0 //79
else
ar = 0 //192
ag = 168 //0
ab = 75 //0
endif

if Sav < Sav[1] then
r = 255 //51
g = 0 //125
b = 0 //79
else
r = 0 //192
g = 168 //0
b = 75 //0
endif
if SLav < SLav[1] then
sr=128
sg=128
sb=128
else
sr=48
sg=84
sb=150
endif
if CombiSlope < CombiSlope[1] then
lr = 51 //51
lg = 125 //125
lb = 79 //79
else
lr = 192 //192
lg = 0 //0
lb = 0 //0
endif

//
RETURN  SAv coloured(r,g,b) style(line,3) as "Av Slope",SLAv coloured(sr,sg,sb) style(line,3) as "Long Av Slope", CombiSlope coloured(lr,lg,lb) style(line,4) as "Total of 3 slopes",SShortAv coloured(ar,ag,ab) style(line,3) as "Short Av Slope",0 style(line,3) as "0"
JanParticipant
Veteran
The Heiki Ashi calculation as I presented above was NOT correct for the Heiki Ashi High and Heiki Ashi Low, sorry, below the correct calculation of the (average) Heiki Ashi for your information.
//Heikin Ashi candlestick definition according Investopedia
Once Period = 3

if barindex < 2 then
HOpen = open
HClose = close
HHigh = high
HLow = low
else
HOpen = 0.50 * (hOpen[1]+hClose[1])
HHigh = max(HOpen,max(high,Close))
HLow = min(HOpen,min(low,Close))
HClose = 0.25 * (Open+Close+Low+High)
endif

AvHA = average[Period]((HOpen+High+Low+Hclose)/4)
//if Hclose > HOpen then
if AvHA < AvHA[1] then
r = 128 //51
g = 128 //125
b = 128 //79
else
r = 48 //192
g = 84 //0
b = 150 //0
endif
RETURN AvHA coloured(r,g,b) style(line,4) as "Av Heikin Ashi"
JanParticipant
Veteran
The average Heiki Ashi calculation must then also have the Heiki Ashi High and Heiki Ashi Low calculation, see also below in the code: AvHA = average[Period]((HOpen+HHigh+HLow+Hclose)/4)
(. . . . ) Now showing the right calculation.
//Heikin Ashi candlestick definition according Investopedia, tested with the default values of Heiki Ashi bar values within PRT
once Period = 3

if barindex < 1 then
HOpen = open
HClose = close
HHigh = high
HLow = low
else
HOpen = 0.50 * (hOpen[1]+hClose[1])
HHigh = max(HOpen,max(high,Close))
HLow = min(HOpen,min(low,Close))
HClose = 0.25 * (Open+Close+Low+High)
endif

AvHA = average[Period]((HOpen+HHigh+HLow+Hclose)/4)

if AvHA < AvHA[1] then
r = 128 //51
g = 128 //125
b = 128 //79
else
r = 48 //192
g = 84 //0
b = 150 //0
endif

RETURN AvHA coloured(r,g,b) style(line,5) as "Av Heikin Ashi"
JanParticipant
Veteran
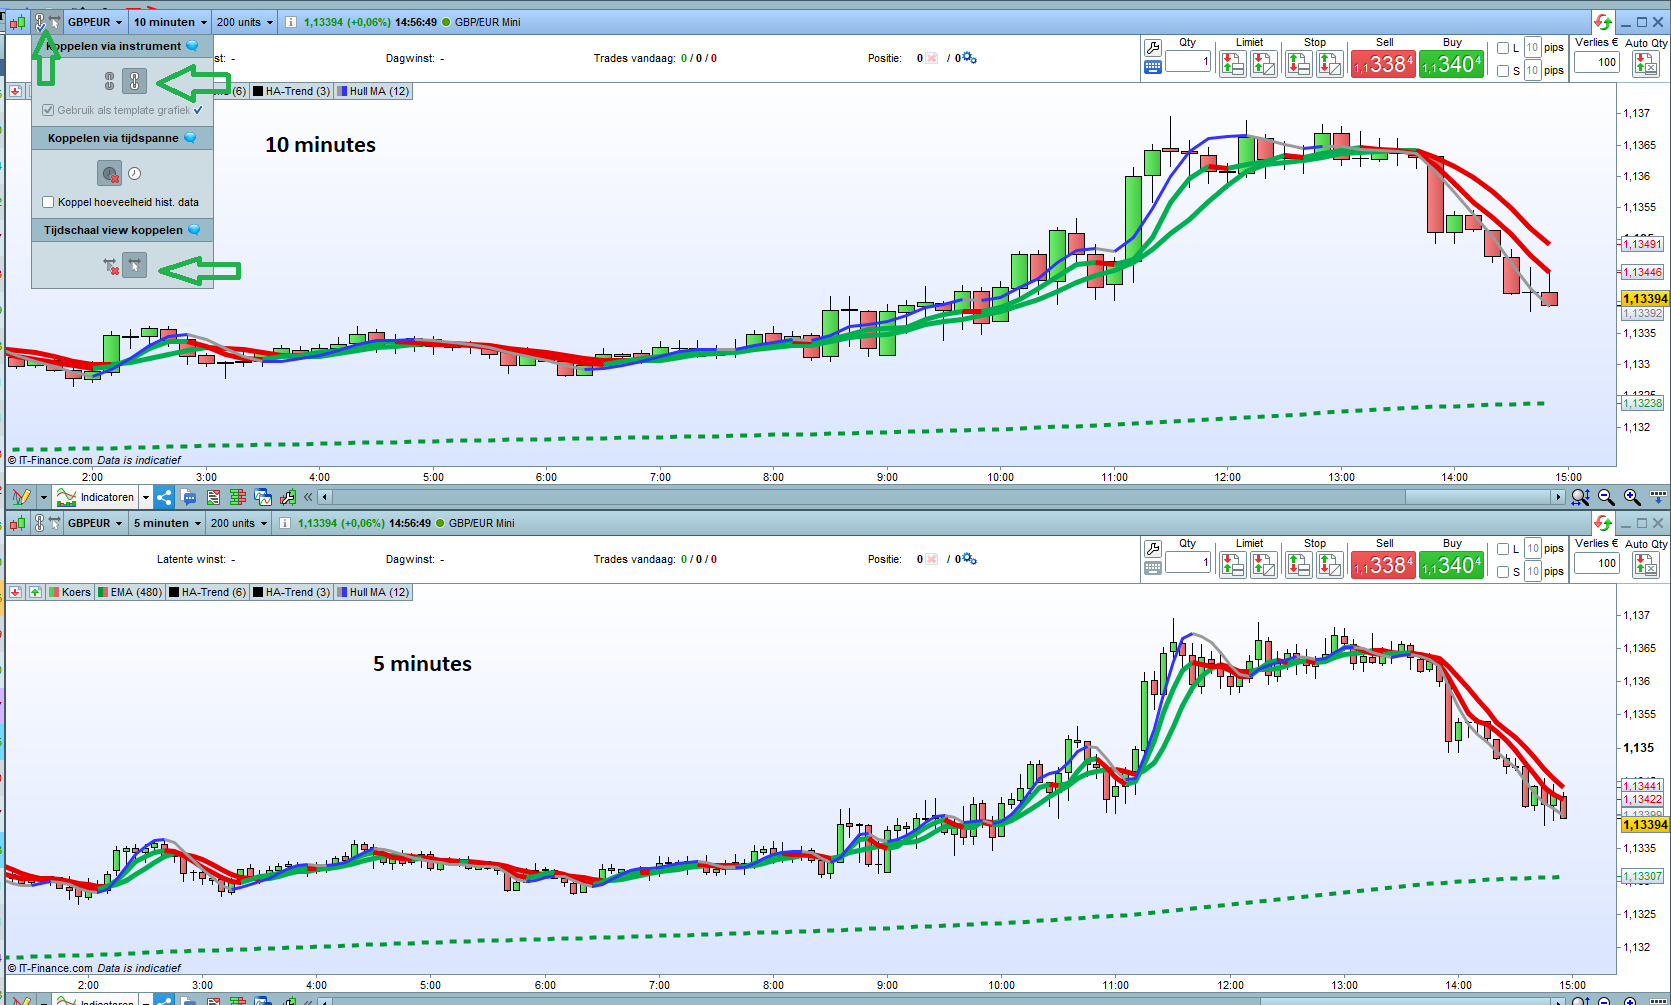
See below attached picture for a
possible manual trend trading system with a 10 minutes and a 5 minutes graph on the same time scale, with the normal prices, and 3 trend lines in each graph, the average Heiki Ashi over 3 bars, the average Heiki Ashi over 6 bars and a Hull average of 12 bars.
Trading rules could be : go long if day trend is positive, and the 5 and 10 minutes graph shows upwards green lines for the 2 Heikin Ashi average lines and the Hull average. The opposite for short.
You need a screener to find the starting points for more currencies, indices and/or commodities on time.