Hi
Could someone please tell me how to make an indicator that will recognise what timeframe I am viewing and plot different moving averages. I have tried the following formula but after a lot of googling I’m not sure if this is possible in ProBuilder.
Timeframe(month)

RETURN ExponentialAverage[10](close)

Timeframe(weekly)

RETURN ExponentialAverage[40](close)

Timeframe(daily)

RETURN ExponentialAverage[10](close)
RETURN ExponentialAverage[50](close)
RETURN ExponentialAverage[200](close)
Not possible to use “timeframe” in ProBuilder.
To automatically find on which timeframe you are on, you can try to use this code snippet, it will return the minutes quantity (120 for a 2 hours timeframe for instance).
once NbBar = 1

if BarIndex < NbBar+2 then
MyDay=openday
dayminutes = 1440*(MyDay-MyDay[1])
MyHour=openhour
hourminutes = 60*(MyHour-MyHour[1])
MyMin=openminute
barminutes = MyMin - MyMin[1] + hourminutes + dayminutes
barminutes=abs(barminutes)
Mybarminutes = lowest[NbBar](barminutes)[1]
endif

return Mybarminutes as "Timeframe"
Hi Nic
Thanks for the help mate. I’ve only been using ProRealTime for a few days so I’m a bit green. I’m used to Amibroker and Metastock.
How can I start writing the conditions based on that formula? Do I place that at the beginning of the formula and then start referencing to Timeframe?
Alan
I use the following code to determine timeframe (daily/weekly/monthly)/ It is based on PRT’s time format: yyyymmdd (i.e. 20170612 for today) and bar-to-bar simple subtraction to detect the number of days between adjacent bars. The OR in each IF deal with weekends etc. This, of course, only work for swing trading
If (date-date[1])=1 OR (date[1]-date[2])=1 Then
a=1 // 1 signals Daily timeframe
Endif
If (date-date[1])=7 OR (date[1]-date[2])=7 Then
a=7 // 7 signals Weekly timeframe
Endif
If (date-date[1])=99 OR (date[1]-date[2])=99 Then
a=30 // 30 signals Weekly timeframe
Endif
If (date-date[1])=299 OR (date[1]-date[2])=299 Then
a=100 // 100 signals Monthly timeframe
Endif
If (date-date[1])>9500 Then
a=200 // 200 signals Annual timeframe
Endif
Thanks Pinny
I’m still having a bit of trouble. How many times can you add “Return” to an indicator. I’m getting an error and I’m not sure what to do.
If (date-date[1])=1 OR (date[1]-date[2])=1 Then
a=1 // 1 signals Daily timeframe
Endif
If (date-date[1])=7 OR (date[1]-date[2])=7 Then
a=7 // 7 signals Weekly timeframe
Endif
If (date-date[1])=99 OR (date[1]-date[2])=99 Then
a=30 // 30 signals Weekly timeframe
Endif
If (date-date[1])=299 OR (date[1]-date[2])=299 Then
a=100 // 100 signals Monthly timeframe
Endif
If (date-date[1])>9500 Then
a=200 // 200 signals Annual timeframe
Endif


If (a==100) Then

RETURN ExponentialAverage[10](close)

Elsif (a==30) Then

RETURN ExponentialAverage[40](close)

Else (a==1) Then

RETURN ExponentialAverage[10](close)
RETURN ExponentialAverage[50](close)
RETURN ExponentialAverage[200](close)

EndIf
You can only RETURN the variables once.
You should have coded it like this:
If (date-date[1])=1 OR (date[1]-date[2])=1 Then
a=1 // 1 signals Daily timeframe
Endif
If (date-date[1])=7 OR (date[1]-date[2])=7 Then
a=7 // 7 signals Weekly timeframe
Endif
If (date-date[1])=99 OR (date[1]-date[2])=99 Then
a=30 // 30 signals Weekly timeframe
Endif
If (date-date[1])=299 OR (date[1]-date[2])=299 Then
a=100 // 100 signals Monthly timeframe
Endif
If (date-date[1])>9500 Then
a=200 // 200 signals Annual timeframe
Endif


If (a=100) Then

ema1= ExponentialAverage[10](close)

Elsif (a=30) Then

ema1= ExponentialAverage[40](close)

Else (a=1) Then

ema1= ExponentialAverage[10](close)
ema2= ExponentialAverage[50](close)
ema3= ExponentialAverage[200](close)

EndIf

return ema1, ema2, ema3
Please test it and tell us if it works! 🙂
(there is not need to make double equal for testing like in other programming languages).
Thanks Nic. I entered that code but I’m getting an error in line 26. Not sure why sorry.
I think its a EndIf issue, the following works:
If (date-date[1])=1 OR (date[1]-date[2])=1 Then
a=1 // 1 signals Daily timeframe
Endif
If (date-date[1])=7 OR (date[1]-date[2])=7 Then
a=7 // 7 signals Weekly timeframe
Endif
If (date-date[1])=99 OR (date[1]-date[2])=99 Then
a=30 // 30 signals Weekly timeframe
Endif
If (date-date[1])=299 OR (date[1]-date[2])=299 Then
a=100 // 100 signals Monthly timeframe
Endif
If (date-date[1])>9500 Then
a=200 // 200 signals Annual timeframe
Endif

If (a=100) Then

ema1= ExponentialAverage[10](close)
Else
If (a=30) Then

ema1= ExponentialAverage[40](close)
Else
If (a=1) Then

ema1= ExponentialAverage[10](close)
ema2= ExponentialAverage[50](close)
ema3= ExponentialAverage[200](close)

EndIf
endIf
endif

return ema1, ema2, ema3
Thanks Pinny. I checked the manual and it seemed to use an Else for the last condition. Thanks heaps for the help. It works. After years of learning Amibroker and Metastock it seems I’m starting all over again!
Looks like there is still a small problem. It wasn’t plotting on the weekly when using “a=30″ so I changed it to ” a=7″ and it plots fine. The monthly was plotting fine but now that the weekly is set to “a=7” the monthly no longer plots
>> For clarity of messages on ProRealCode’s forums, please use the “insert code PRT” button to separate the text of the code part! Thank you! <<
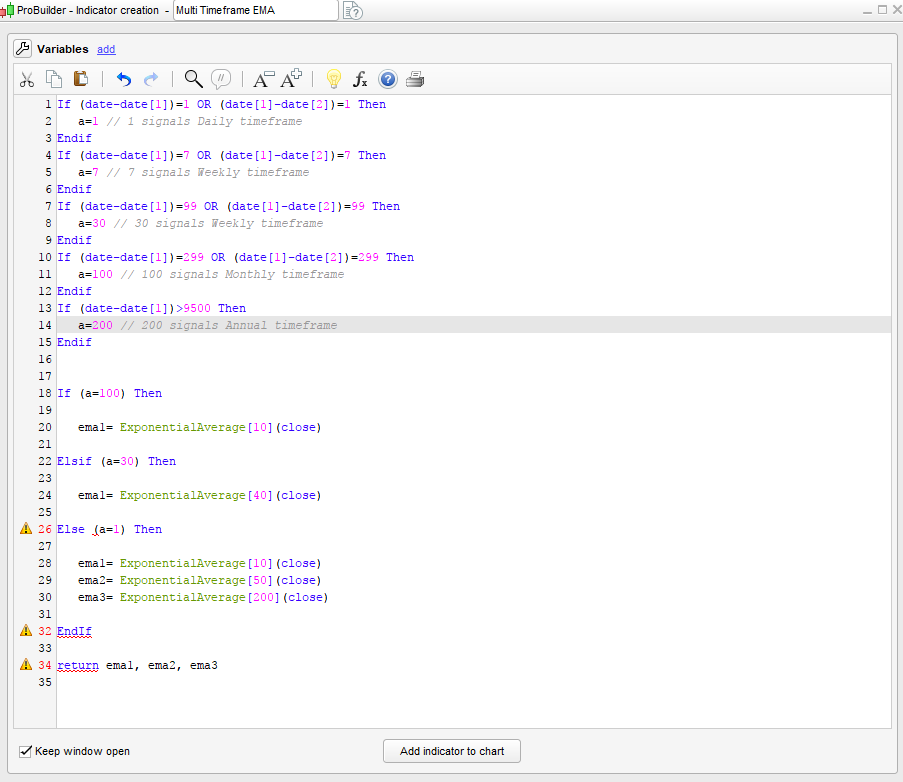
Here is the whole formula. The monthly will not plot
If (date-date[1])=1 OR (date[1]-date[2])=1 Then
a=1 // 1 signals Daily timeframe
Endif
If (date-date[1])=7 OR (date[1]-date[2])=7 Then
a=7 // 7 signals Weekly timeframe
Endif
If (date-date[1])=99 OR (date[1]-date[2])=99 Then
a=30 // 30 signals Weekly timeframe
Endif
If (date-date[1])=299 OR (date[1]-date[2])=299 Then
a=100 // 100 signals Monthly timeframe
Endif
If (date-date[1])>9500 Then
a=200 // 200 signals Annual timeframe
Endif


If (a=100) Then

ema1= ExponentialAverage[10](close)

Elsif (a=7) Then

ema1= ExponentialAverage[40](close)

Elsif (a=1) Then

ema1= ExponentialAverage[10](close)
ema2= ExponentialAverage[50](close)
ema3= ExponentialAverage[200](close)

EndIf

return ema1, ema2, ema3
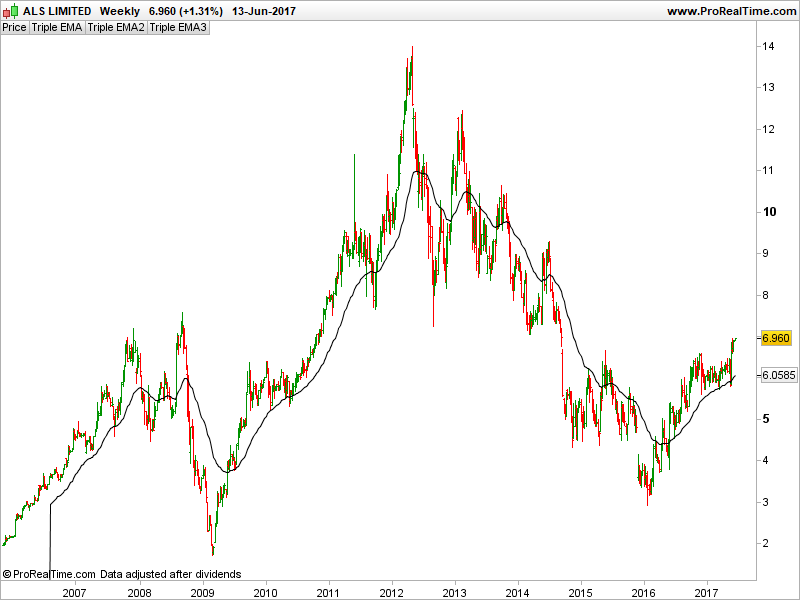
There is also a vertical line at the beginning of the ema. I use valuewhen in metastock to hide that but that doesn’t seem to be available in Probuilder. Is there a way to hide it?
HideEMA1 = 0.9*valuewhen(1,ema1<>0,ema1)
ShowEMA1=If(ema1=0, HideEMA1, ema1)
Sorry, this is my documentation mistake – 1/daily, 7/Weekly, 30/Monthly, 100/Quarterly, 200/Annual
Just use a=30 and this will plot on the Monthly (tried it:-)
If (date–date[1])=1 OR (date[1]–date[2])=1 Then
a=1 // 1 signals Daily timeframe
Endif
If (date–date[1])=7 OR (date[1]–date[2])=7 Then
a=7 // 7 signals Weekly timeframe
Endif
If (date–date[1])=99 OR (date[1]–date[2])=99 Then
a=30 // 30 signals Weekly timeframe
Endif
If (date–date[1])=299 OR (date[1]–date[2])=299 Then
a=100 // 100 signals Monthly timeframe
Endif
If (date–date[1])>9500 Then
a=200 // 200 signals Annual timeframe
Endif
If (a=100) Then
ema1= ExponentialAverage[10](close)
Elsif (a=7) Then
ema1= ExponentialAverage[40](close)
Elsif (a=1) Then
ema1= ExponentialAverage[10](close)
ema2= ExponentialAverage[50](close)
ema3= ExponentialAverage[200](close)
EndIf
return ema1, ema2, ema3
If (date-date[1])=1 OR (date[1]-date[2])=1 Then
a=1 // 1 signals Daily timeframe
Endif
If (date-date[1])=7 OR (date[1]-date[2])=7 Then
a=7 // 7 signals Weekly timeframe
Endif
If (date-date[1])=99 OR (date[1]-date[2])=99 Then
a=30 // 30 signals Monthly timeframe
Endif
If (date-date[1])=299 OR (date[1]-date[2])=299 Then
a=100 // 100 signals Quarterly timeframe
Endif
If (date-date[1])>9500 Then
a=200 // 200 signals Annual timeframe
Endif


If (a=100) Then

ema1= ExponentialAverage[10](close)

Elsif (a=7) Then

ema1= ExponentialAverage[40](close)

Elsif (a=1) Then

ema1= ExponentialAverage[10](close)
ema2= ExponentialAverage[50](close)
ema3= ExponentialAverage[200](close)

EndIf

return ema1, ema2, ema3
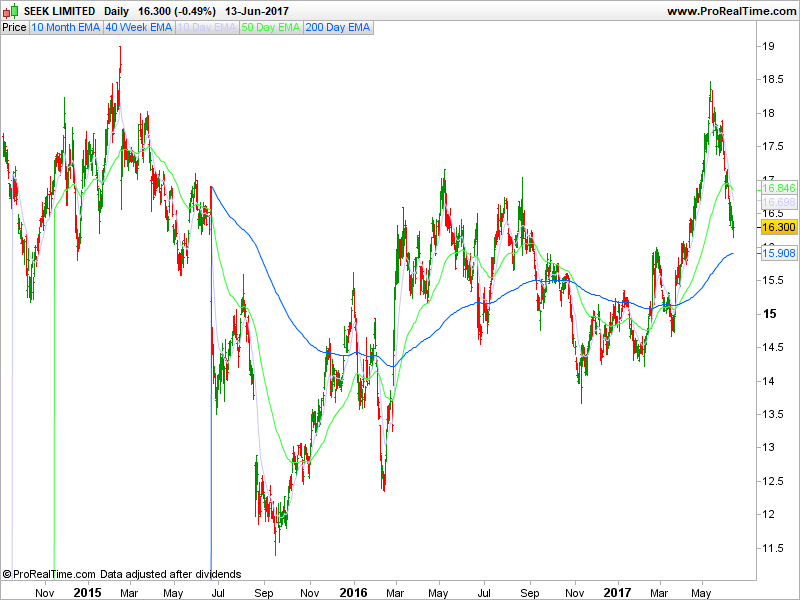
Thanks for all of the help. Its all plotting correctly now. This isn’t a problem but I would just like to know if there is a way to hide the vertical lines at the start of the EMA.
Is there a function that I can use?