Which ones are more accurate (works the best for trading) : Horizontal supports/resistances or obliques trend lines?
No idea from my actual point of view
Horizontal resistance are relatively easy to detect as long as hey have not been crossed (i.e. I mean that they are being crossed with the actual candle) and despite the limit of history, with MTF I have developed a method that detects them during 200 weeks or slightly more on a daily chart. Interesting result, because I could integrate this detection in a screemer.
Oblique trendlines are much more complicated and until now, all my attempts failed. Any hint or suggestion will be highly appreciated.
Good trades and simulations to all.
Oblique trendlines are not easy to detect…
There is 2 ways :
– First one is to use linear regression, but you need to know where the trend begin and where it ends…
– Second strategy is to detect fractals or zigzag points and then calculate slopes between thoses points and try to found out if there is a trend or not…
I made channels detection indicator with both ways and the second strategy seems to be the best. I still feel i can improve how it detect channels and also how it can be used for trading (which is the goal).
You can find a lot of indicators based on trendlines on tradingview :
https://www.tradingview.com/script/3nqRvntM-Trend-Lines-Pro/
https://fr.tradingview.com/script/34t0EaMk-Trend-Channels-With-Liquidity-Breaks-ChartPrime/
And there is also one on the market place.
I guess it’s a personal thing in the end but in my view the answer is horizontal, whilst obliques always look good they are not predictable and so not reliable. For example most assets will range trade for a period, overnight for example so we can take overnight high / low horizontal S/R and look for a breakout to continue a trend or not. Also time frame S/R, in a trading session we we often see the horizontal S/R develop on our chosen timeframe such as m5 or m15 S/R I personally find this very useful. Just one thing to watch is the fake break especially at highs and lows. We should remember, just as breakout traders are looking for the breakout to entre a trade many others traders use them to identify a high to sell or a low to buy causing a fake break.
No need to use linear regression for accurate oblique trendlines.
Hello LucasBest,
It depends on the type of market:
– Horizontal supports/resistances appear during phases of market lateralization.
– Obliques appear in a market with a more pronounced market trend.
Horizontal supports/resistances are suitable for trading the continuation of the trend.
In some cases, you can employ horizontal lines for Recovery Trading and Bearish Reversal strategies:
- Ideally, a chart pattern should form below the line, accompanied by a bullish divergence.
- IDEM for bearish reversals: chart pattern + bearish divergence.
The break of an oblique can signal a reversal or a resumption of the trend:
- If you draw a long-term oblique, its break could signal a trend reversal.
- If you draw a short-term oblique that forms during a consolidation phase but does not challenge the long-term trend, then its break signals a resumption of the trend.
Horizontal lines are more suited to trade the trend continuation, while obliques are more suited to trade the reversal and resumption of the trend.
Whether you use horizontal lines or obliques, trading in the trend will always be more profitable. You can improve your results in several ways:
- Follow the long-term trend
- Check for an accumulation or distribution phase
- Check for divergence or strength valid your trade
- Check for high volumes accompany the breakout
- Ensure the breakout is unambiguous
- Wait for the breakout validation
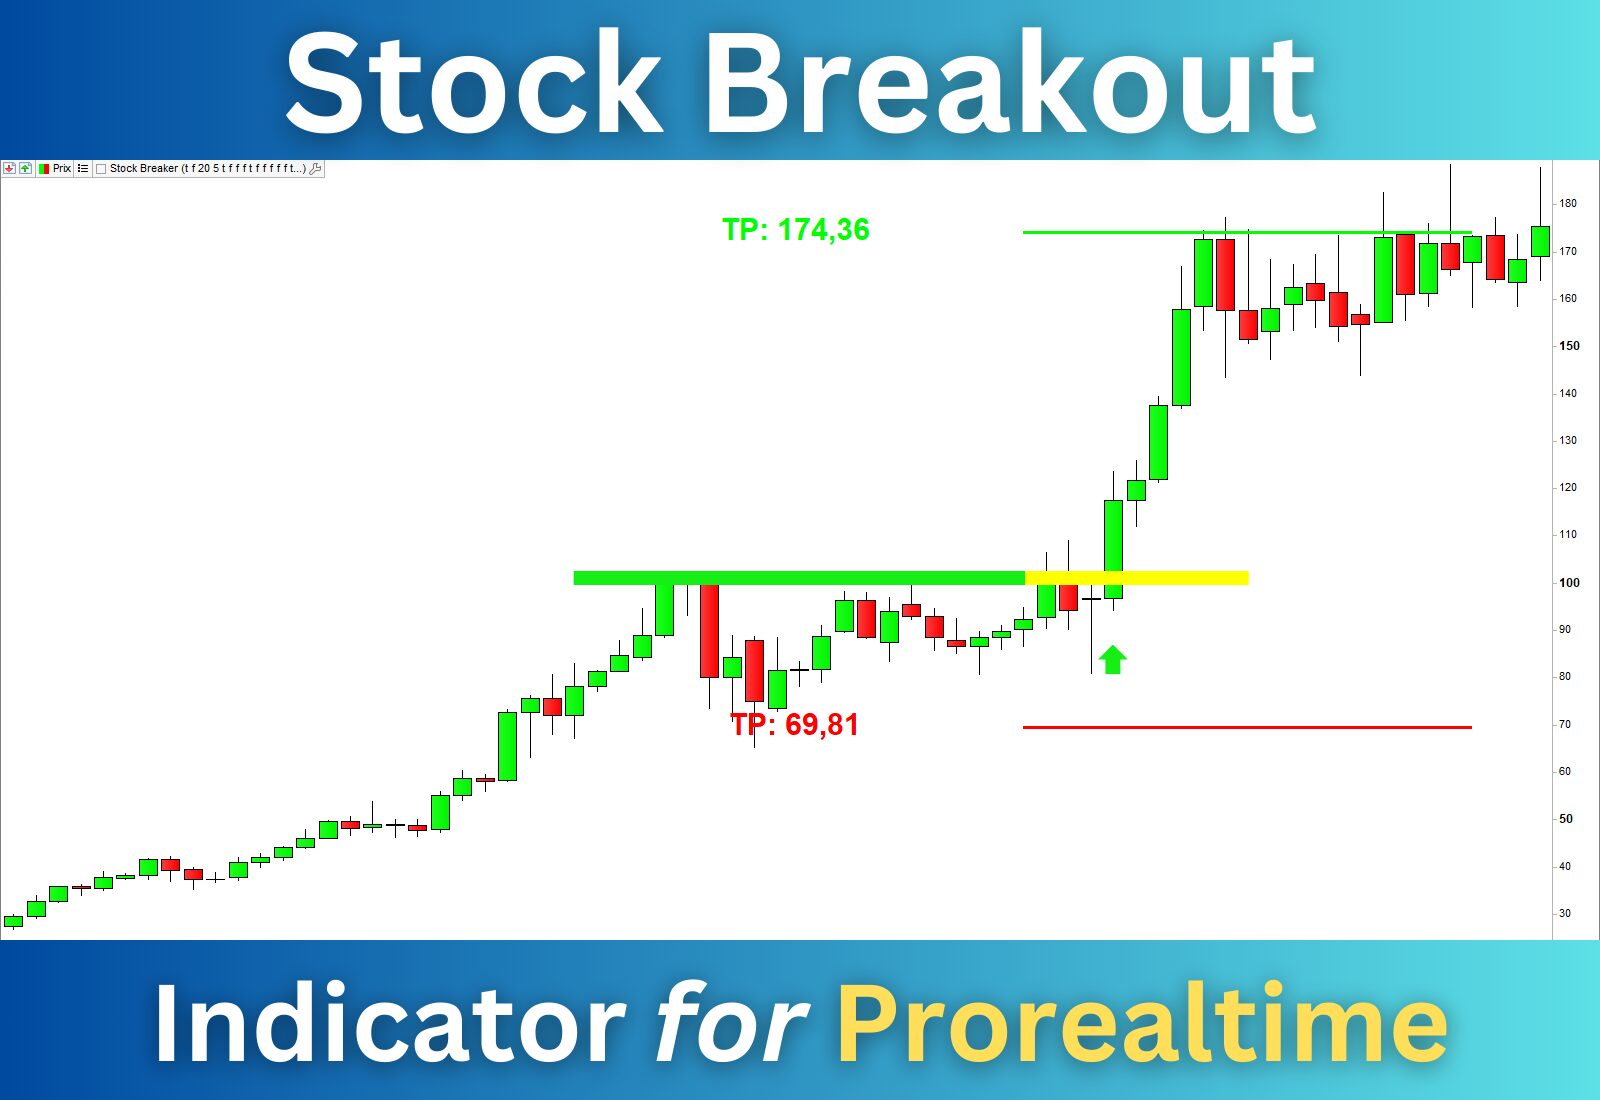
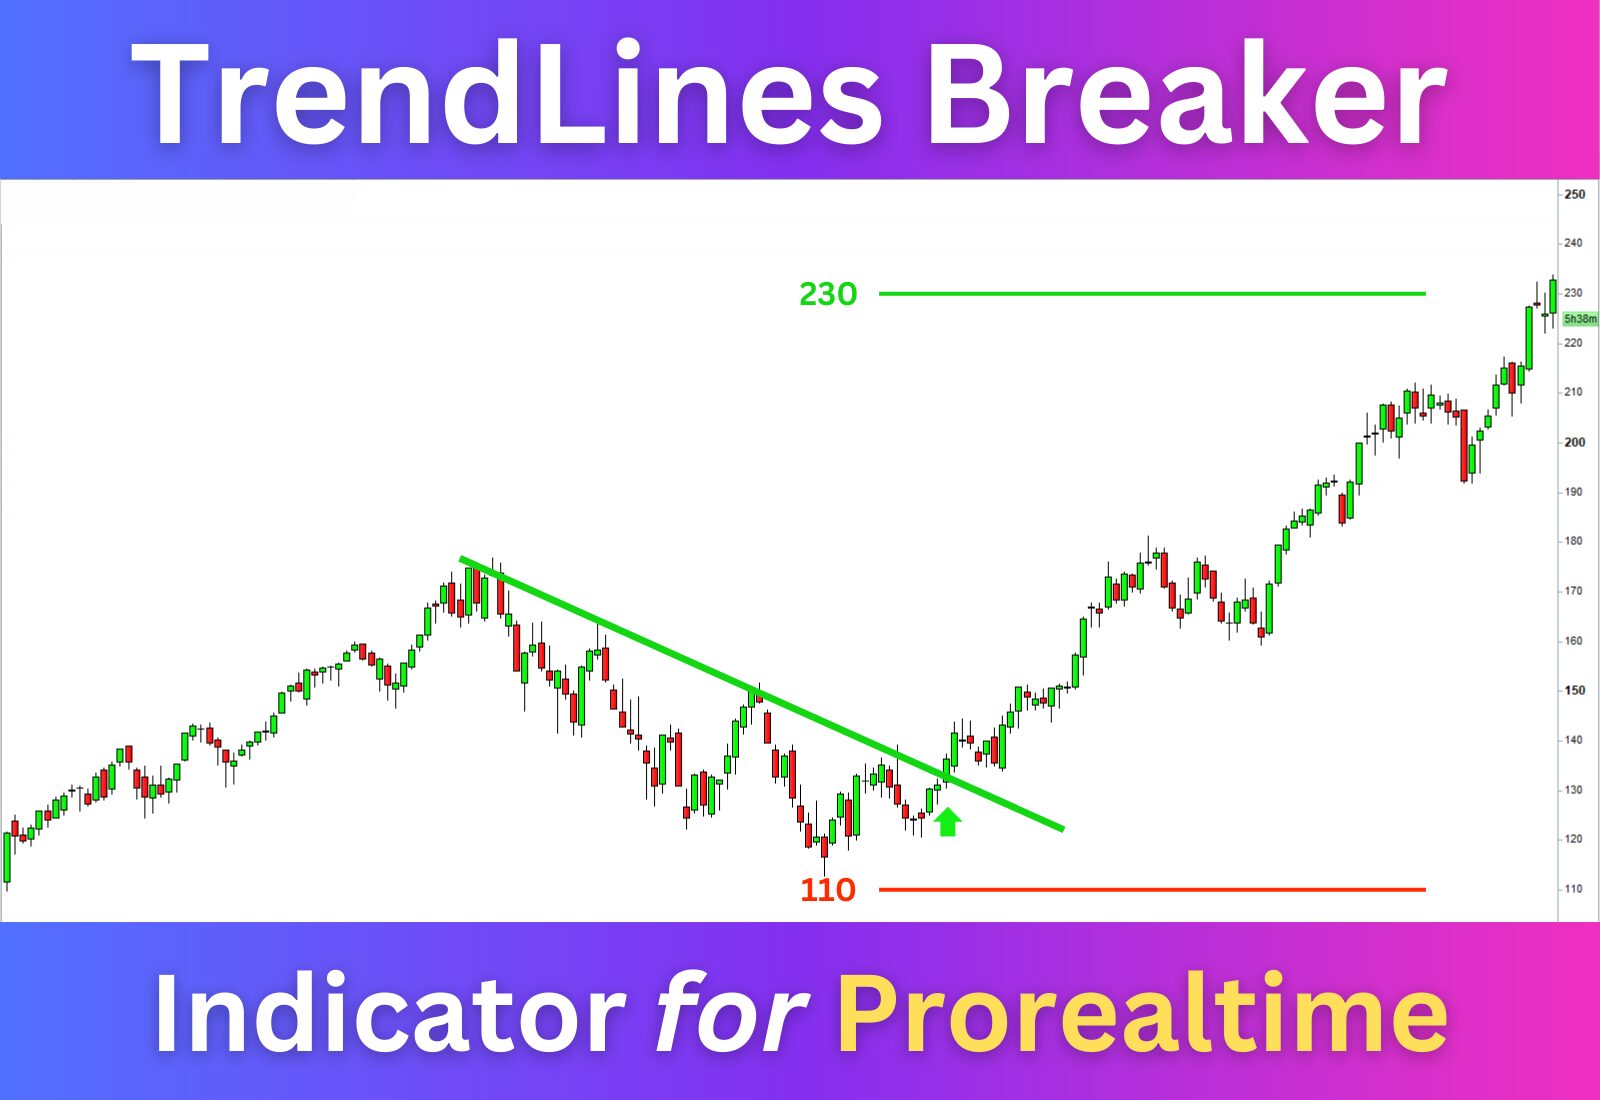
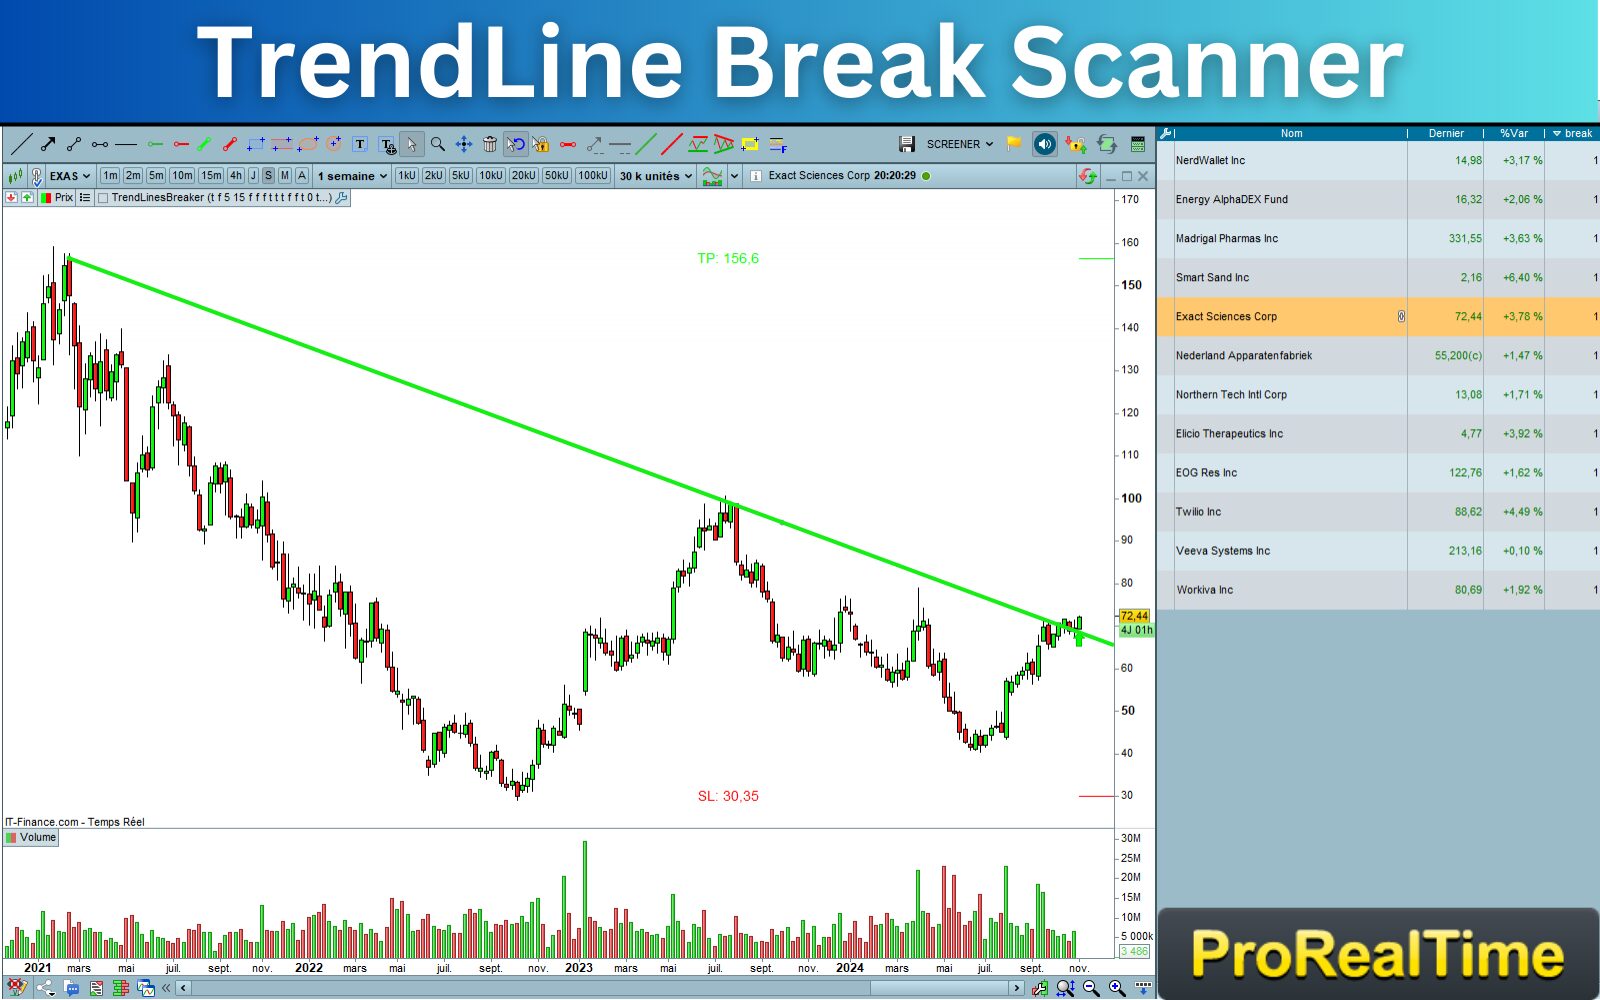
I created two indicators that detect breaks of obliques and supports/resistances. They draw the lines, detect their breaks, and display the targets and stoplosses. They also integrate validation, trend, volume, and strength filters. These two indicators are available on the Prorealcode marketplace:
Horizontal Supports & Resistances Breakouts
https://market.prorealcode.com/product/stock-breakout-indicator-screener/
Trendlines Breakouts
https://market.prorealcode.com/product/trendline-break-indicator-screener/
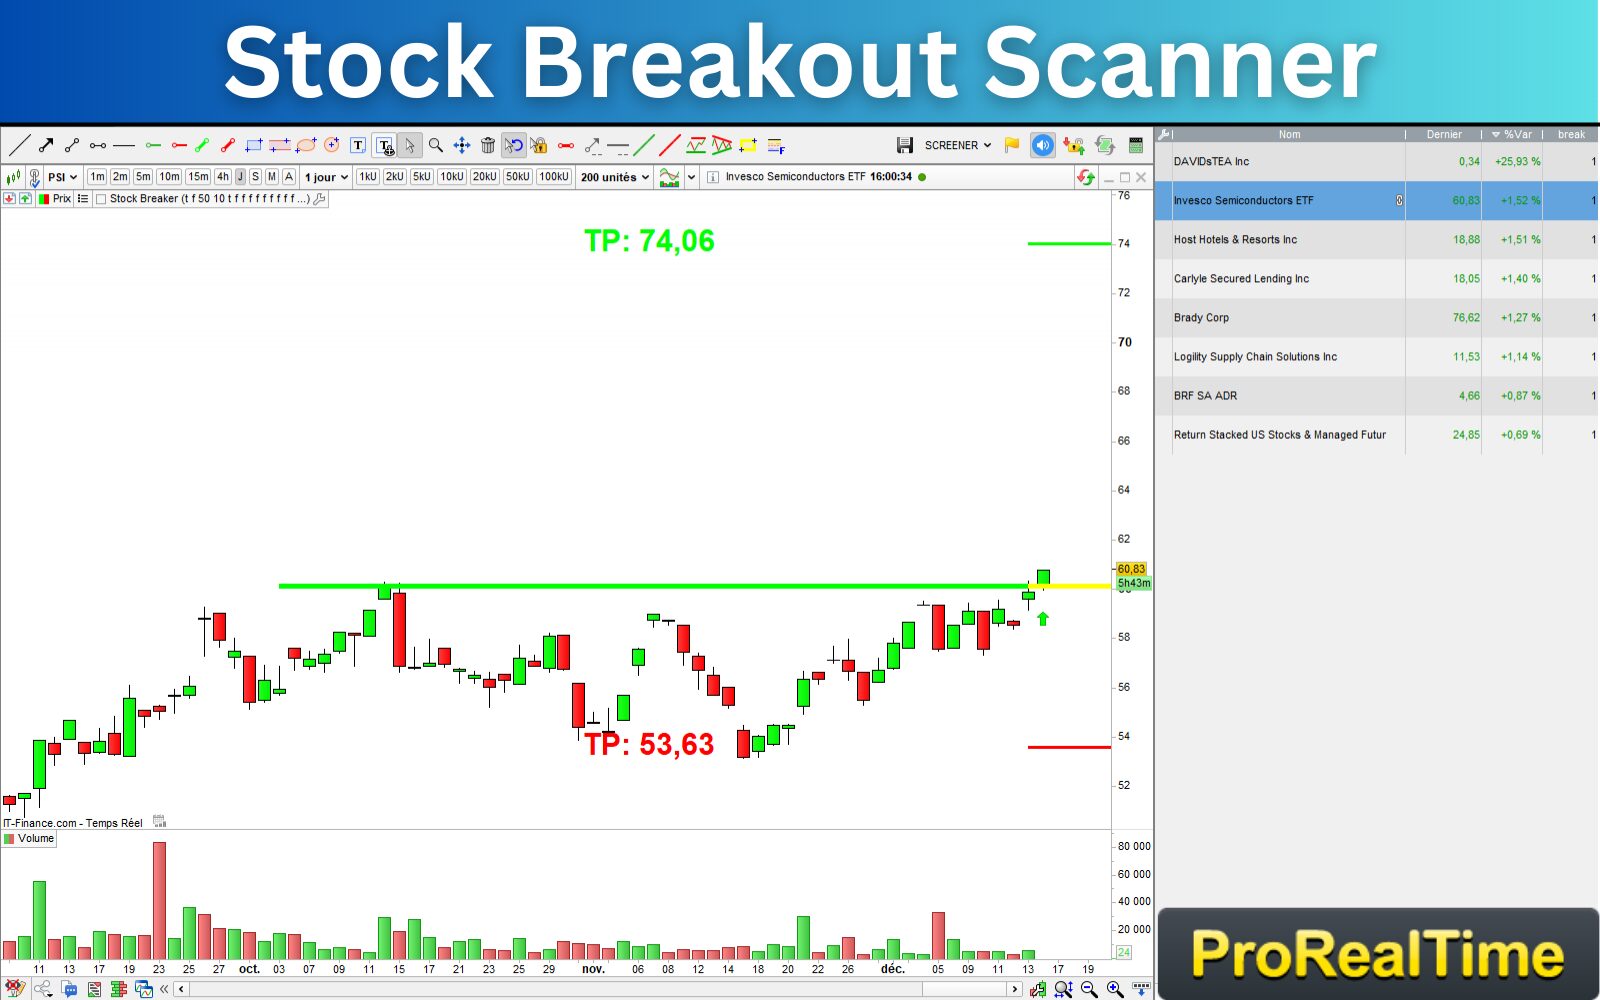
These two indicators are provided with a screener. You will be able to detect opportunities in real-time. 😉
Kind regards,
Vivien
Horizontal lines are more suited to trade the trend continuation, while obliques are more suited to trade the reversal and resumption of the trend.
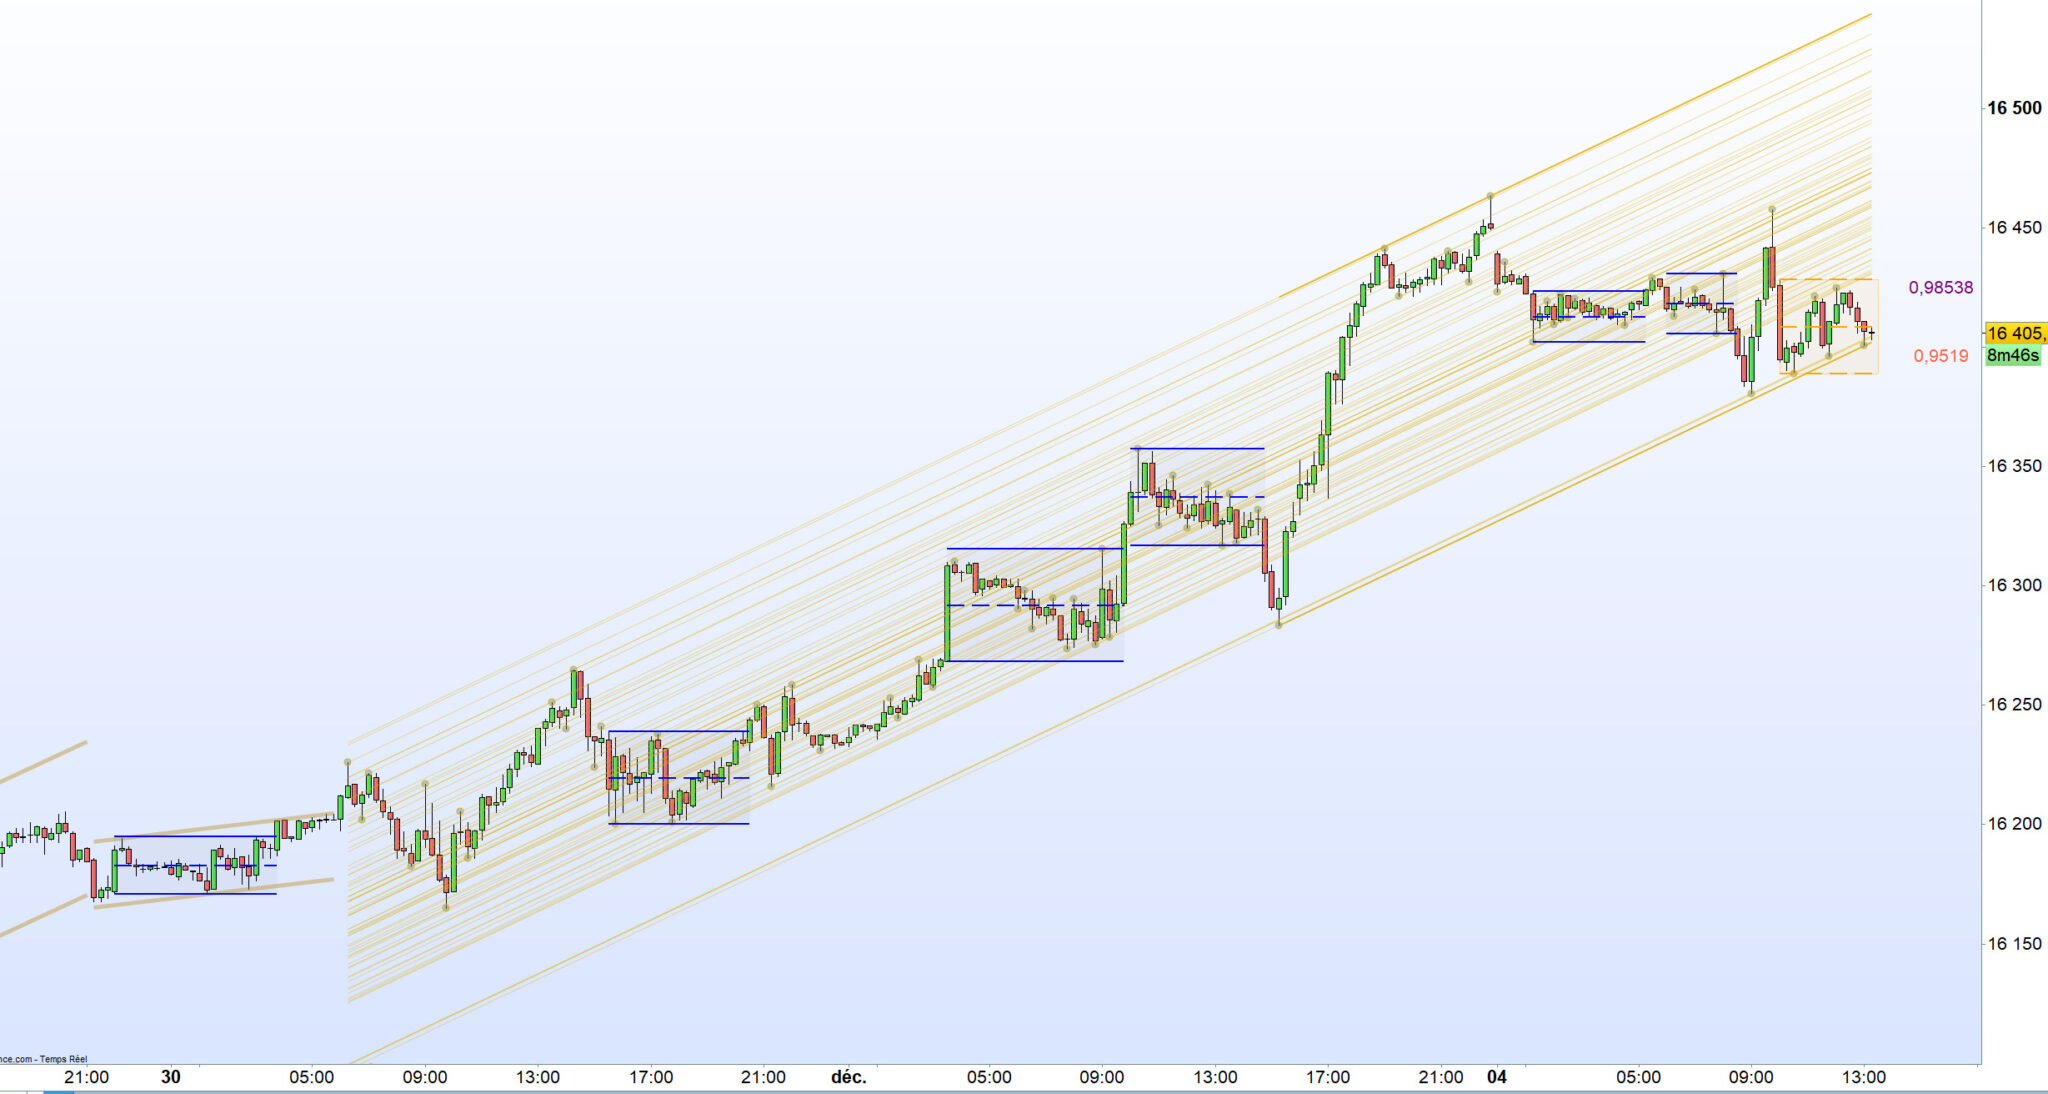
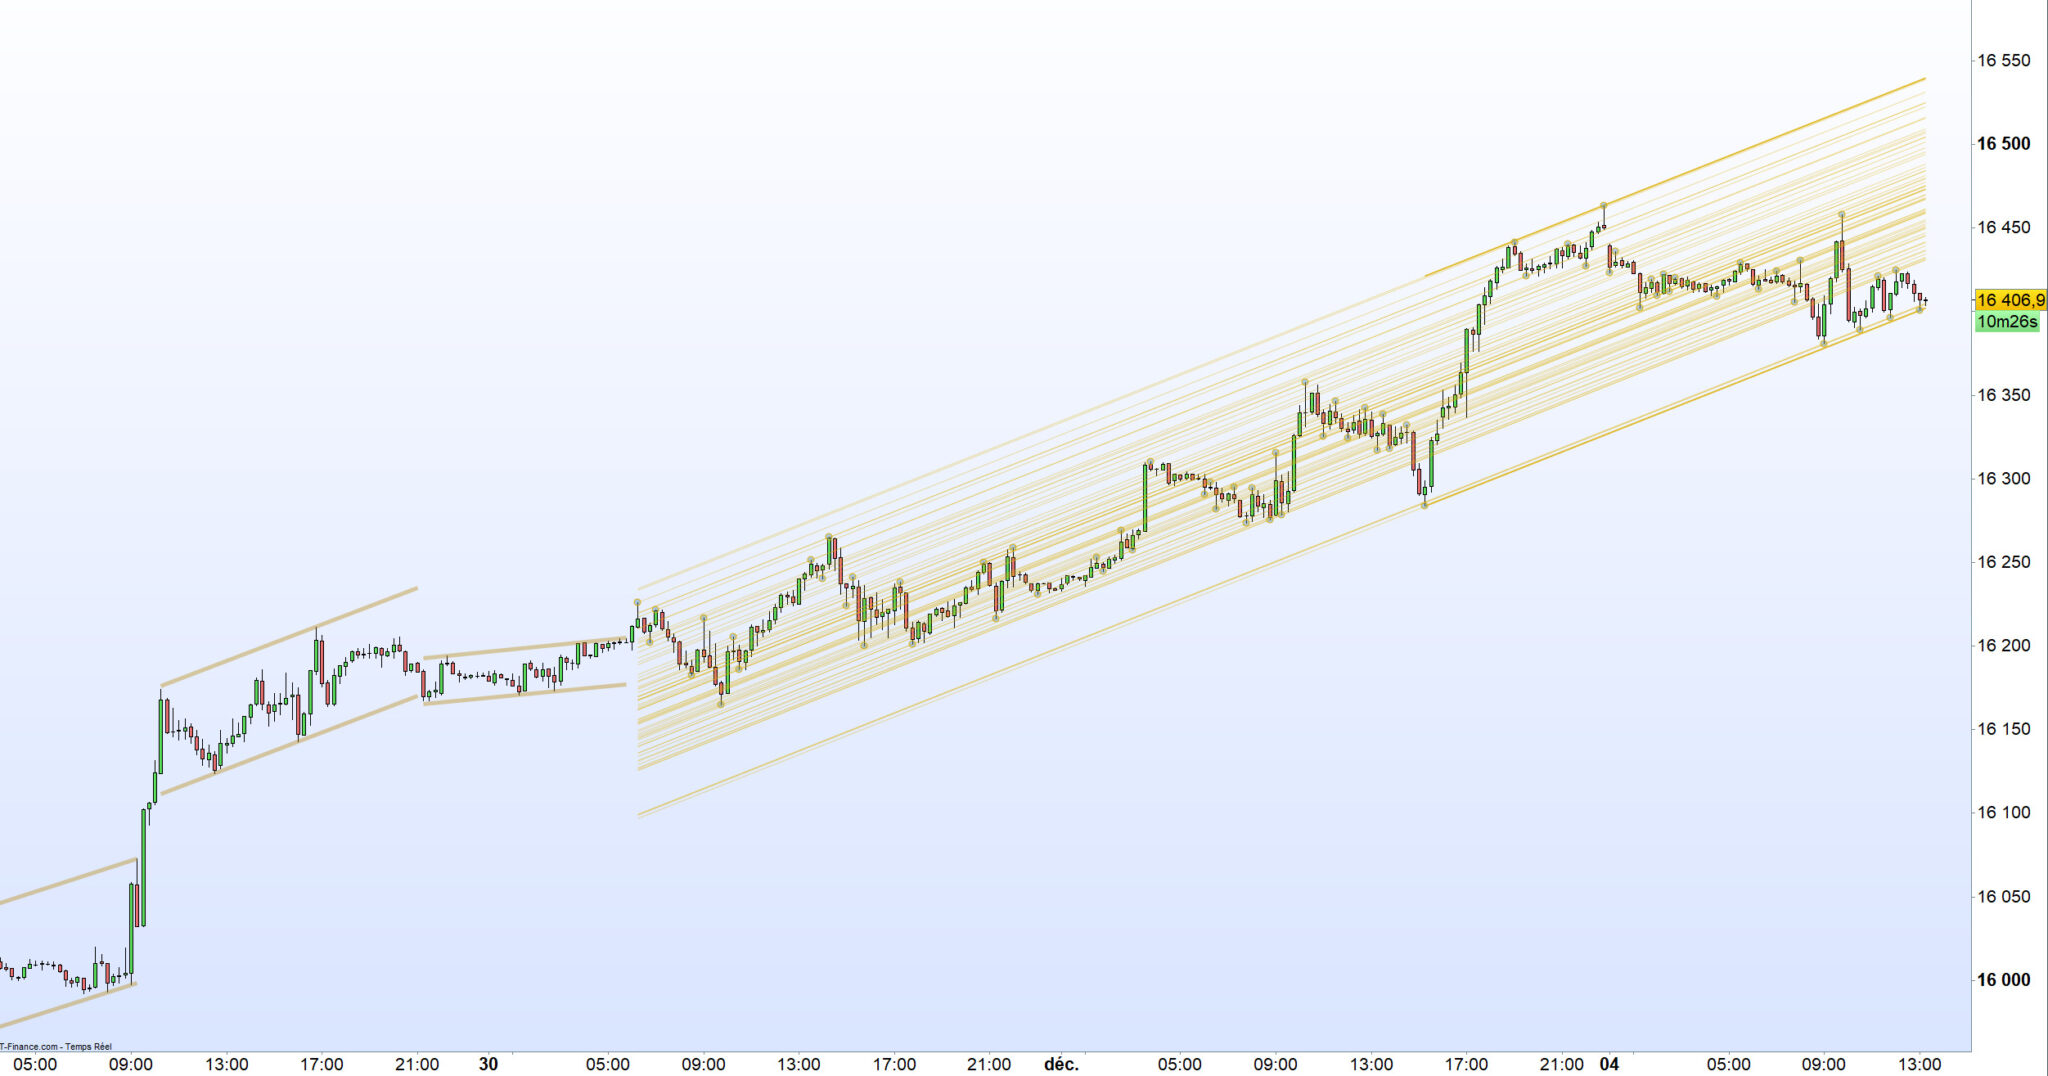
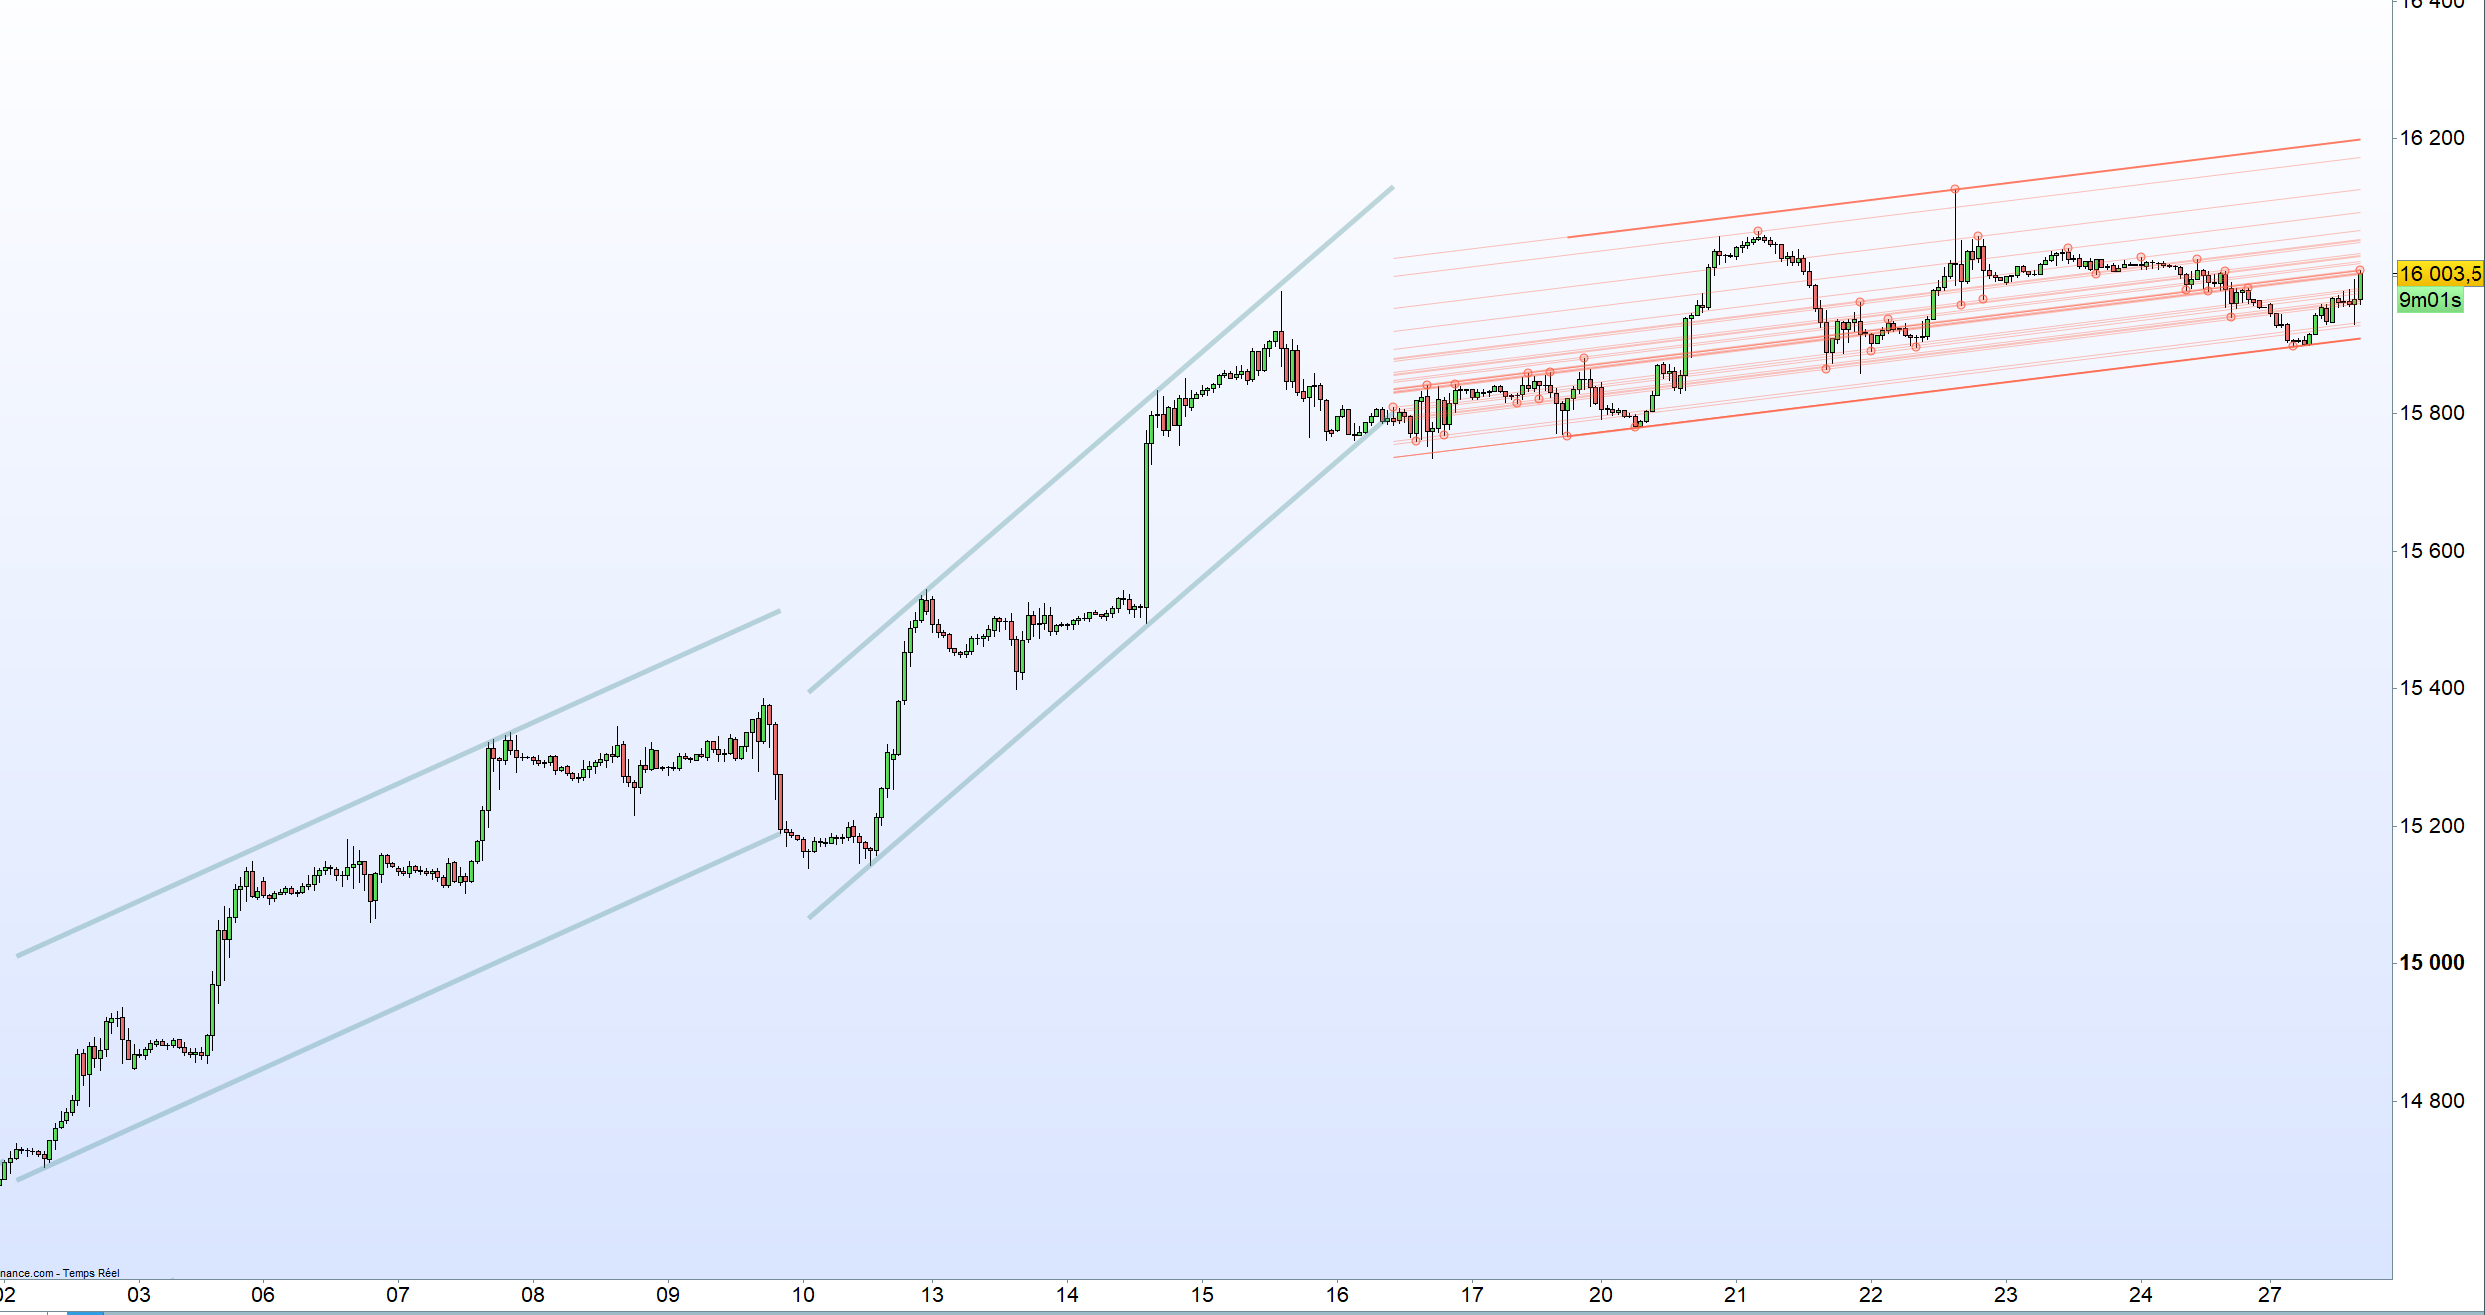
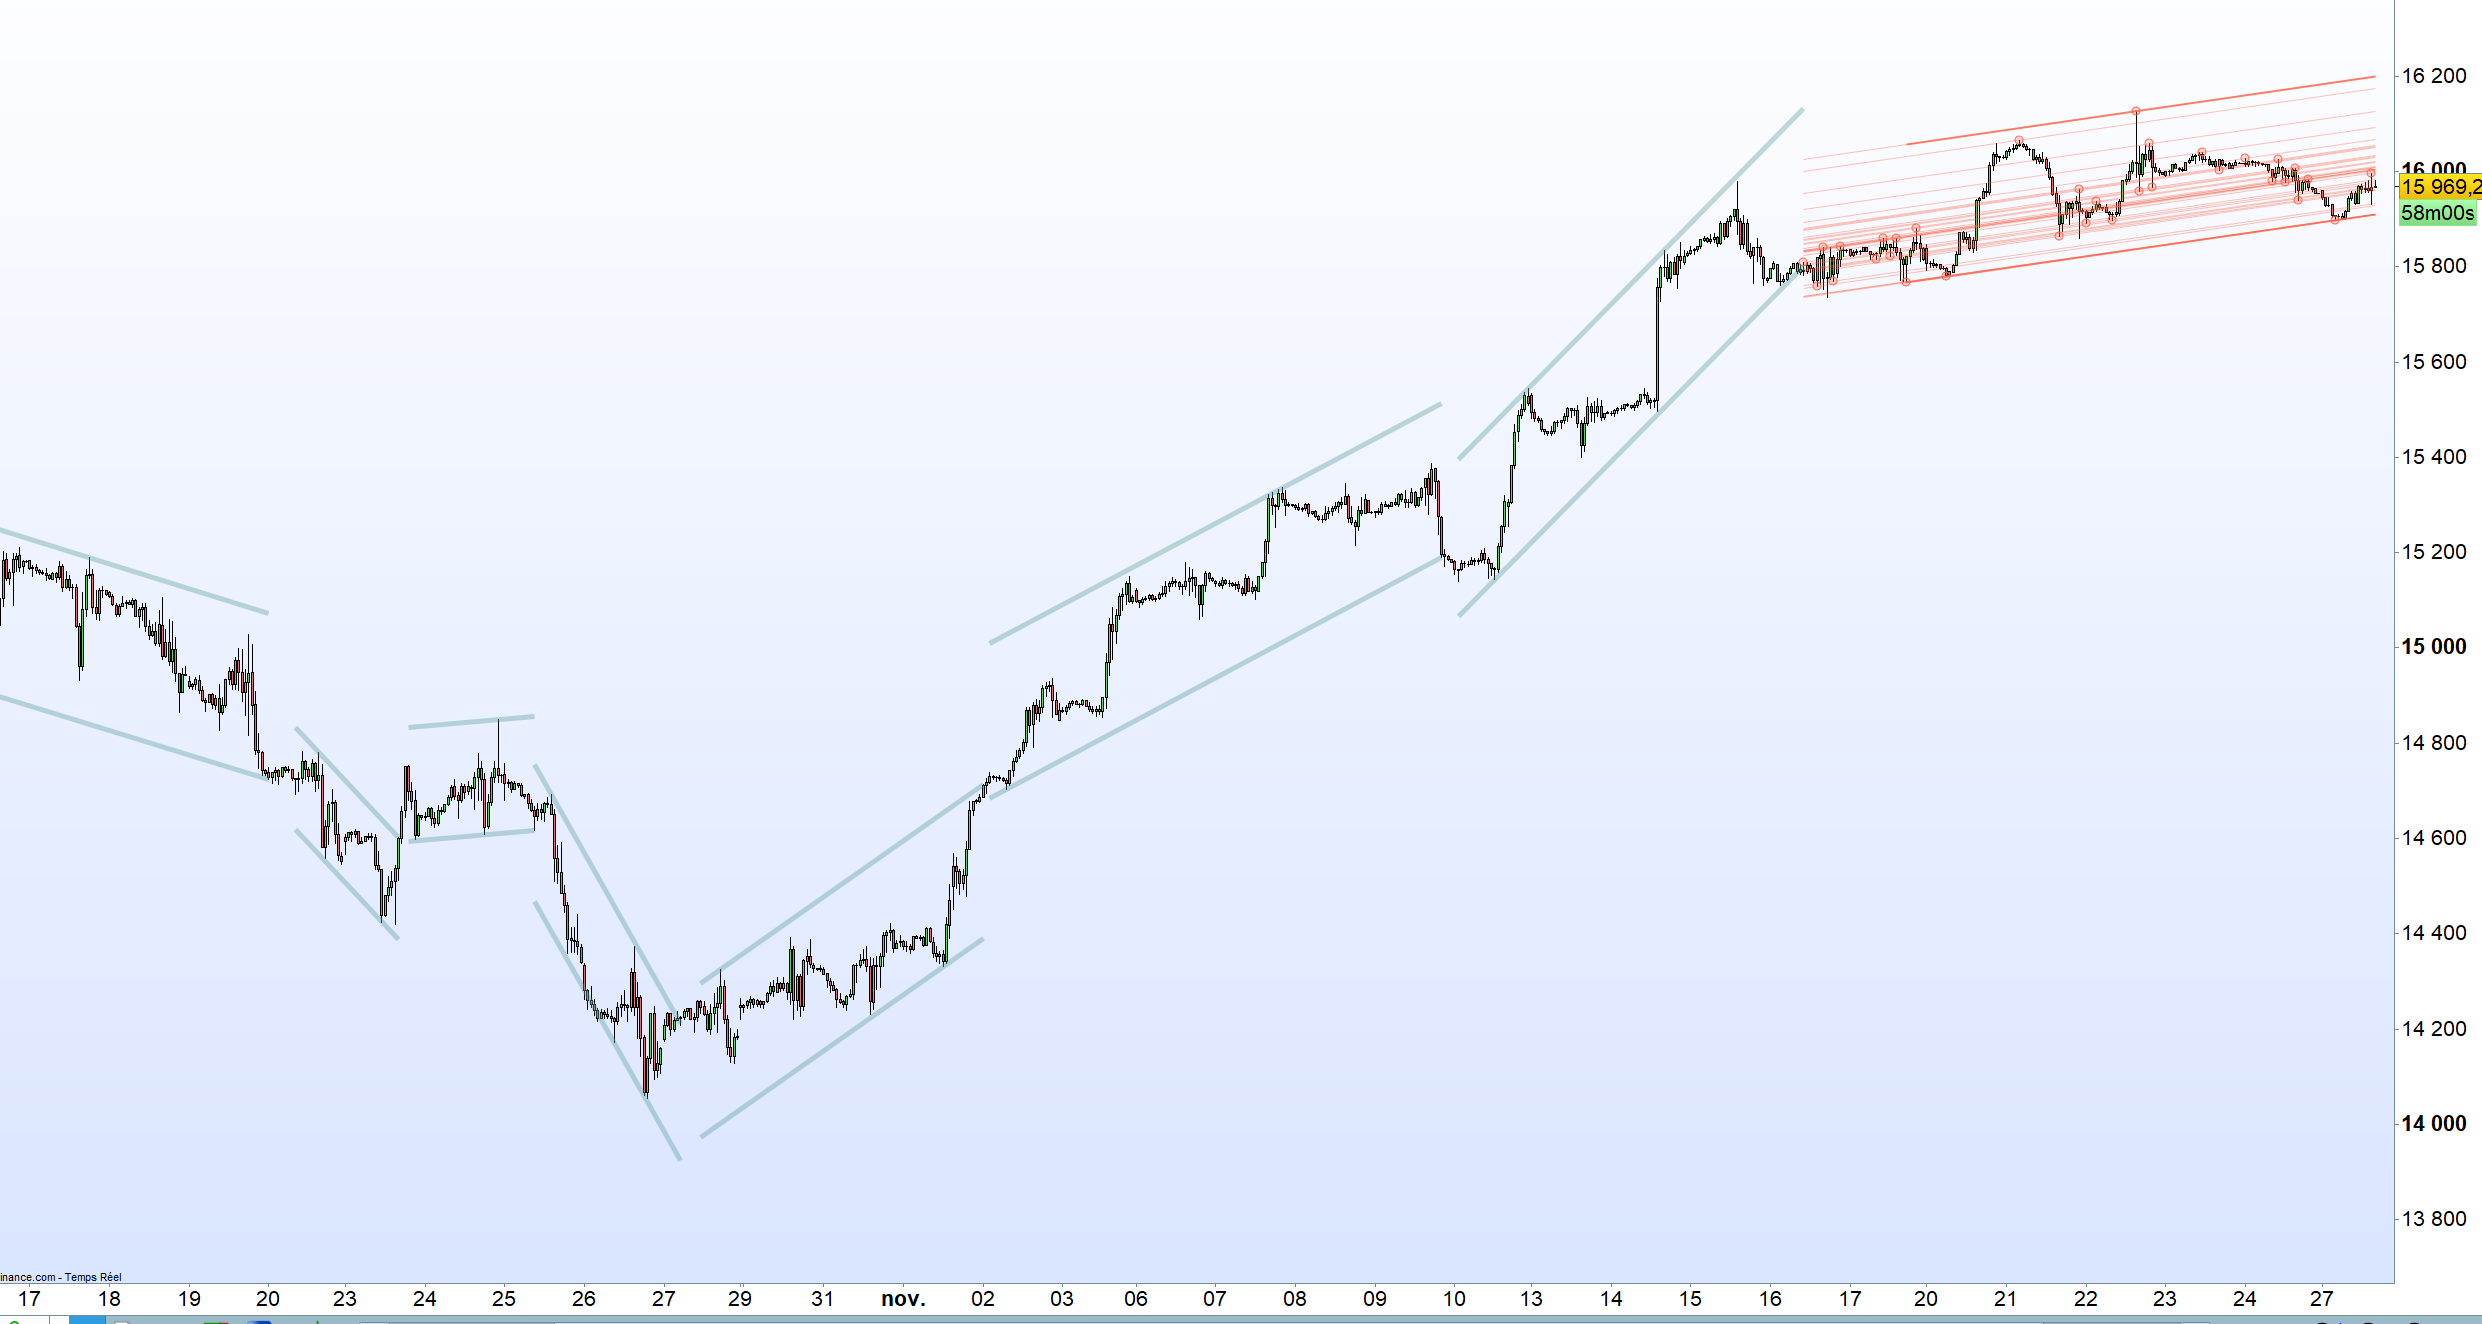
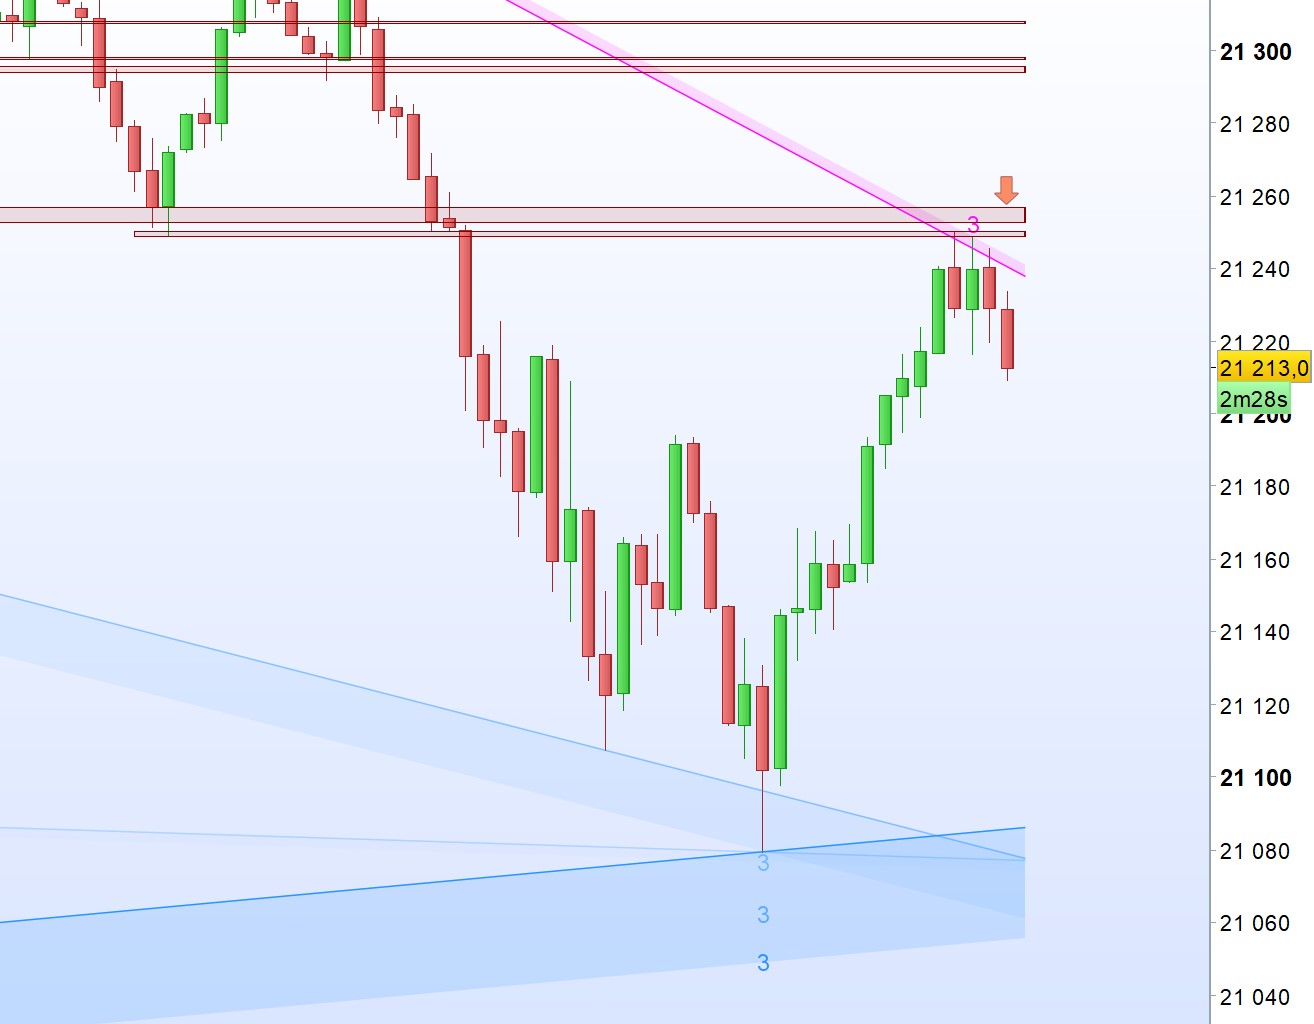
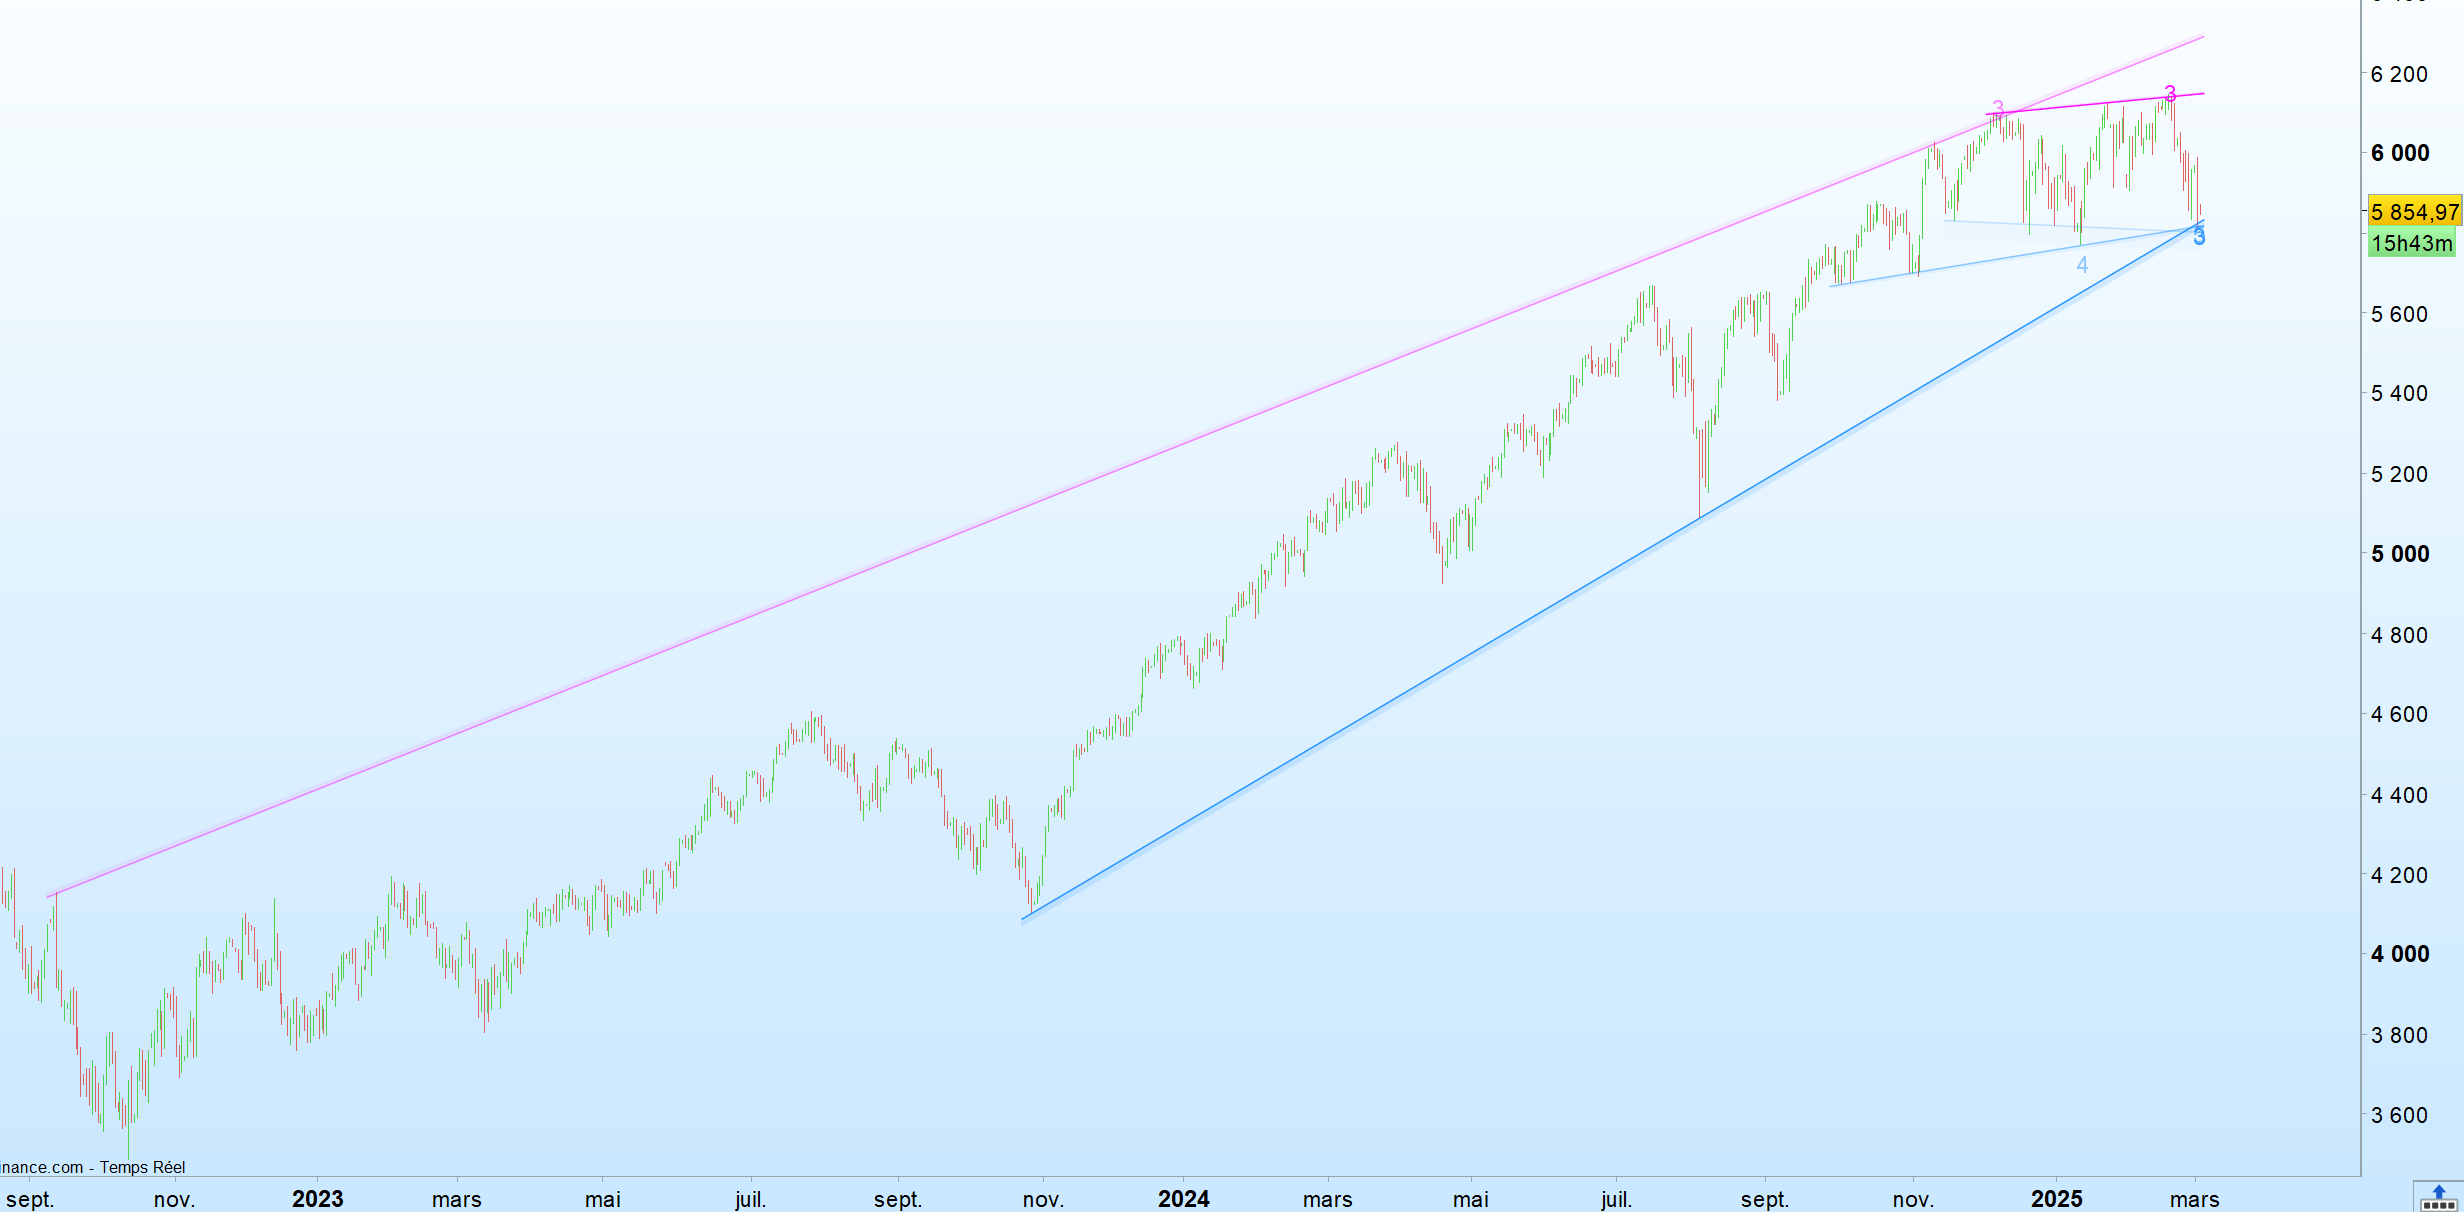
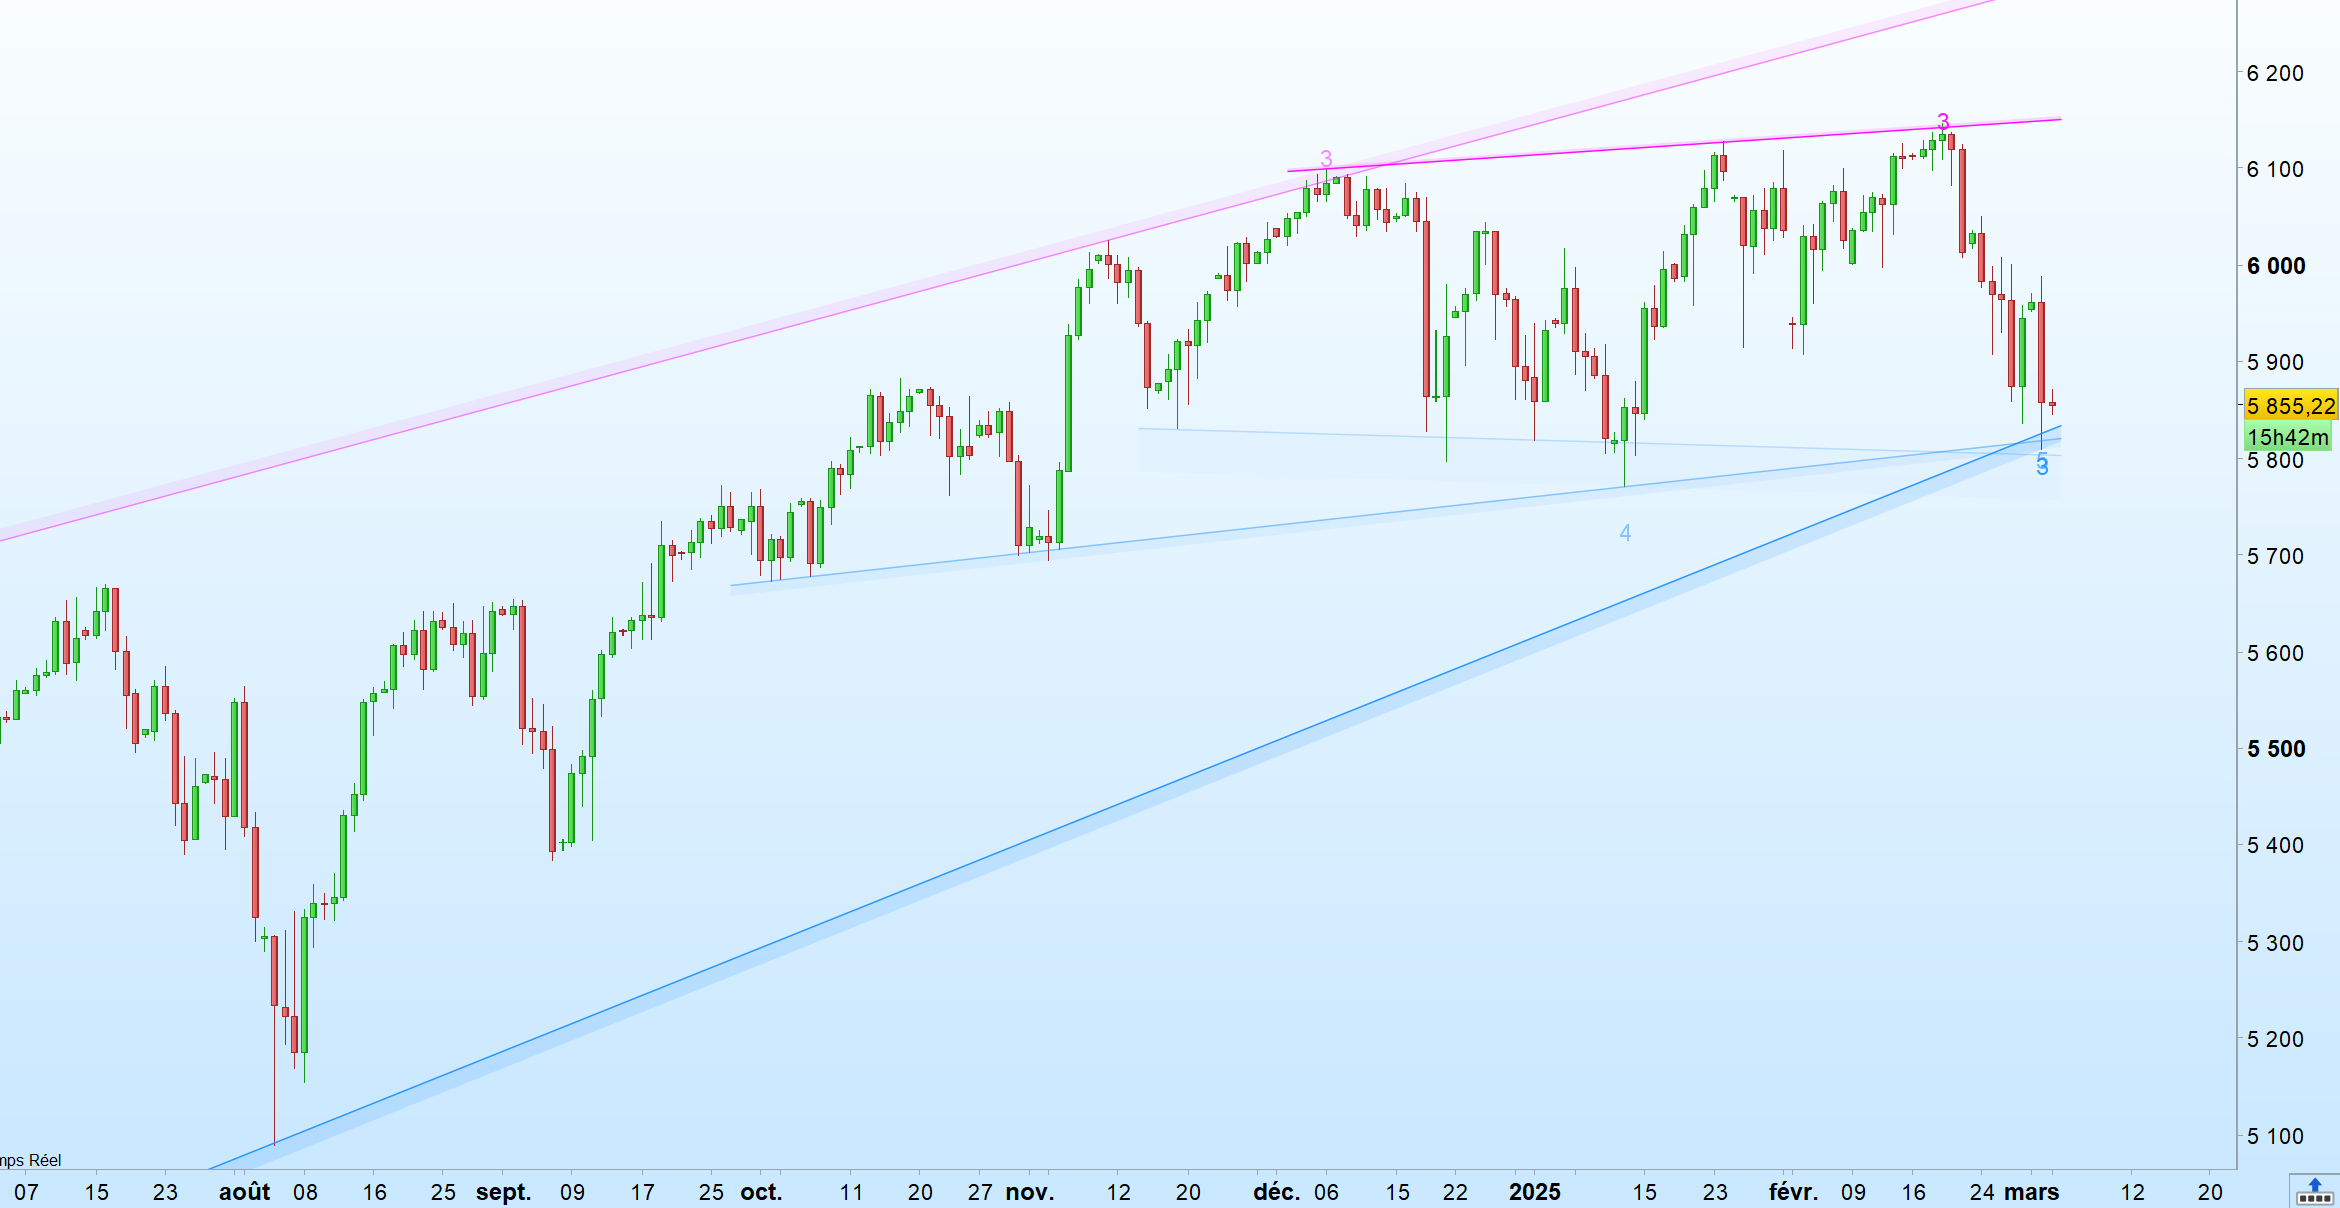
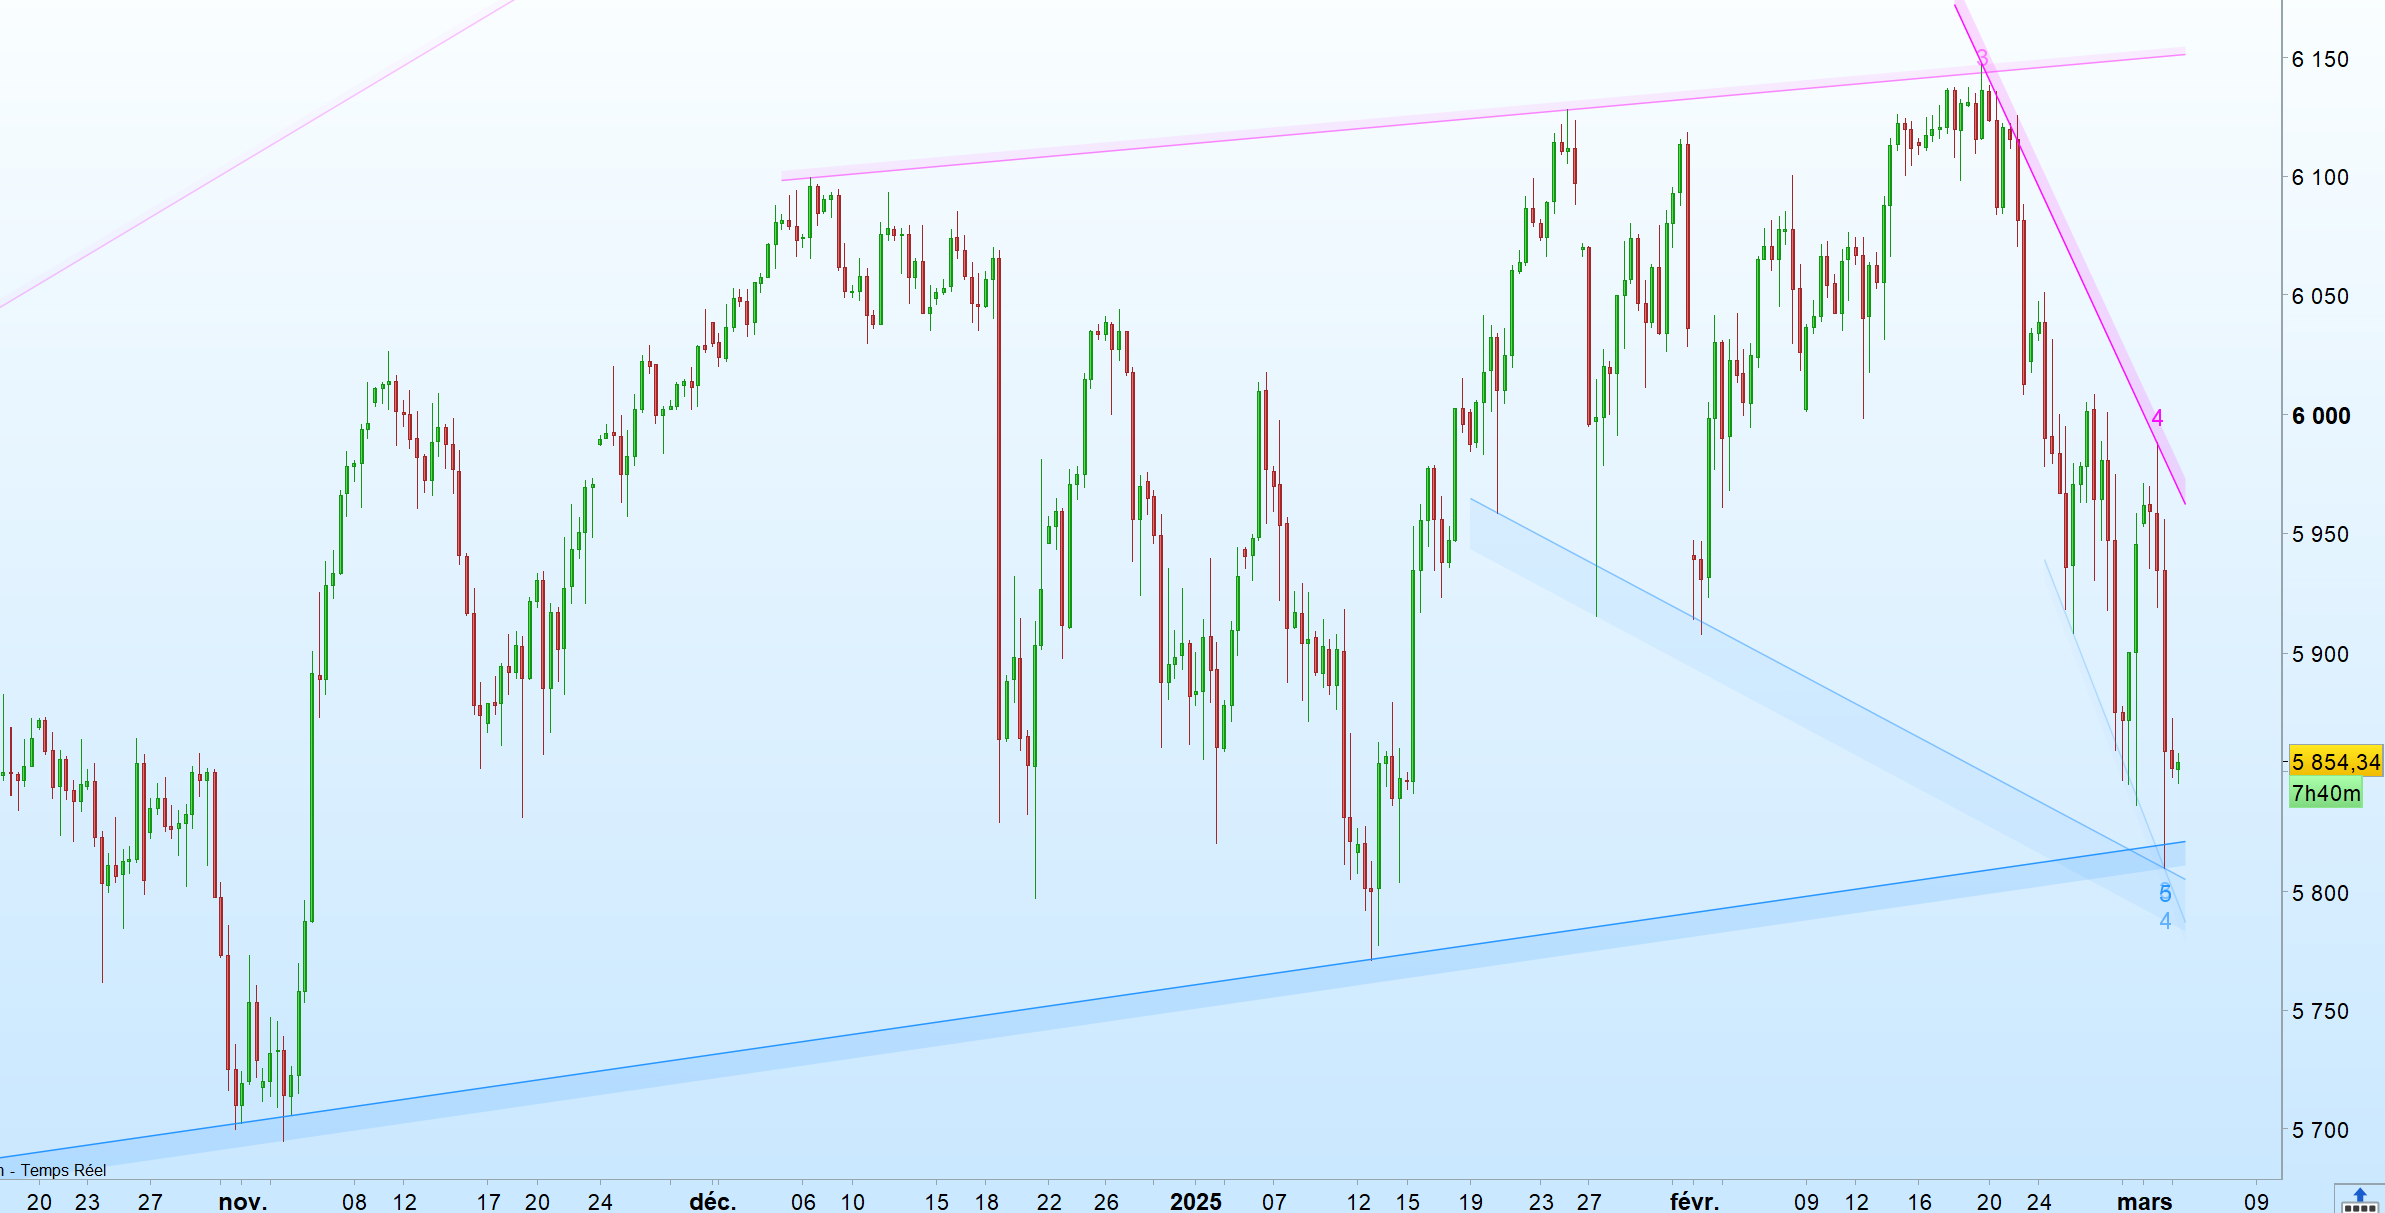
This is a summary that seems a little too simplistic to me… More i observe obliques support and resistance, more i think things are not as simple as they may seem. Sometimes obliques supports can break, and the price find an other oblique support just under the first one, and the bull trend resume with just a gentler slope, and sometimes it is the contrary, price riding a gentle slope and then accelerate and create an other oblique support with a steeper slope… Breaks does not mean reversal of the trend (really not often) and that is why trading the breaks is not the best way of using obliques.
Below, US500 daily and 8 hours time frame