Horizontal line in chart on price
- This topic has 6 replies, 3 voices, and was last updated 1 month ago by .
Viewing 7 posts - 1 through 7 (of 7 total)
Similar topics:
Forums › ProRealTime English forum › General trading discussions › Horizontal line in chart on price
Hello.
On the IG web trading interface the current price has draws a horizontal indicator line across the chart.
That function makes it easy to line up the current price/candle with previous price/candles.
(see attached image as ref to what is shown in IG platform)
I need the same function on PRT please.
I will appreciate it if someone can write this indicator.
Thank you
Andre Vorster.
1 2 3 4 5 6 |
defparam drawonlastbaronly = true DrawHLine(close[0]) coloured(248,128,0,192) Style(DottedLine,1) Dummy = 0 Return Dummy |
🙂
Great!
Thank you.
I modified your code a bit.
Draws a solid line and can modify the line thickness.
//Draws horizontal line across screen at price level across chart.
defparam drawonlastbaronly = true
DrawHLine(close) coloured(96, 137, 154) Style(Line, 2) //(Line,2) = line thickness
Dummy = 0
Return Dummy
Hi,
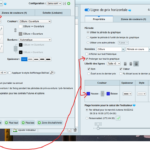
in case you’re ok with a built-in solution instead of a custom code, you can go in the “price” properties window, and at the bottom of this window you have buttons to choose which horizontal line you want to add (maybe you’ll have to scroll down to see them inside the window) , current close is part of the available choices. Once added, you can also customise this added line (color, thickness, style, make it an infinite line instead of a segment…). Valid for both PRTv11 and v12.
Illustration attached of menu buttons positions inside the 2 consecutive windows, the price properties first, then the newly added horizontal line properties with the “prolonger sur tout le graphique” box ticked (I guess it might be in an English menu “extend to the entire chart” or something like that…).
A thank you to all the replies. Solved
Appreciated.
Find exclusive trading pro-tools on