Morning all, and Happy New Year!
I’m having some issues with the historical price data in the live platform. When I look at anything older than a couple of months, there seems to be an issue with Friday night/weekend data.
eg when I look at the Dow Jones Friday evening data, I would expect to see the data stop at approx 22:00 on Friday night, and restart at 23:00 on Sunday. Indeed, that is what I see on the demo platform.
However, on live, the data often carries on through Friday night, into Saturday morning,then it jumps to the early hours Monday (missing out Sunday night data).
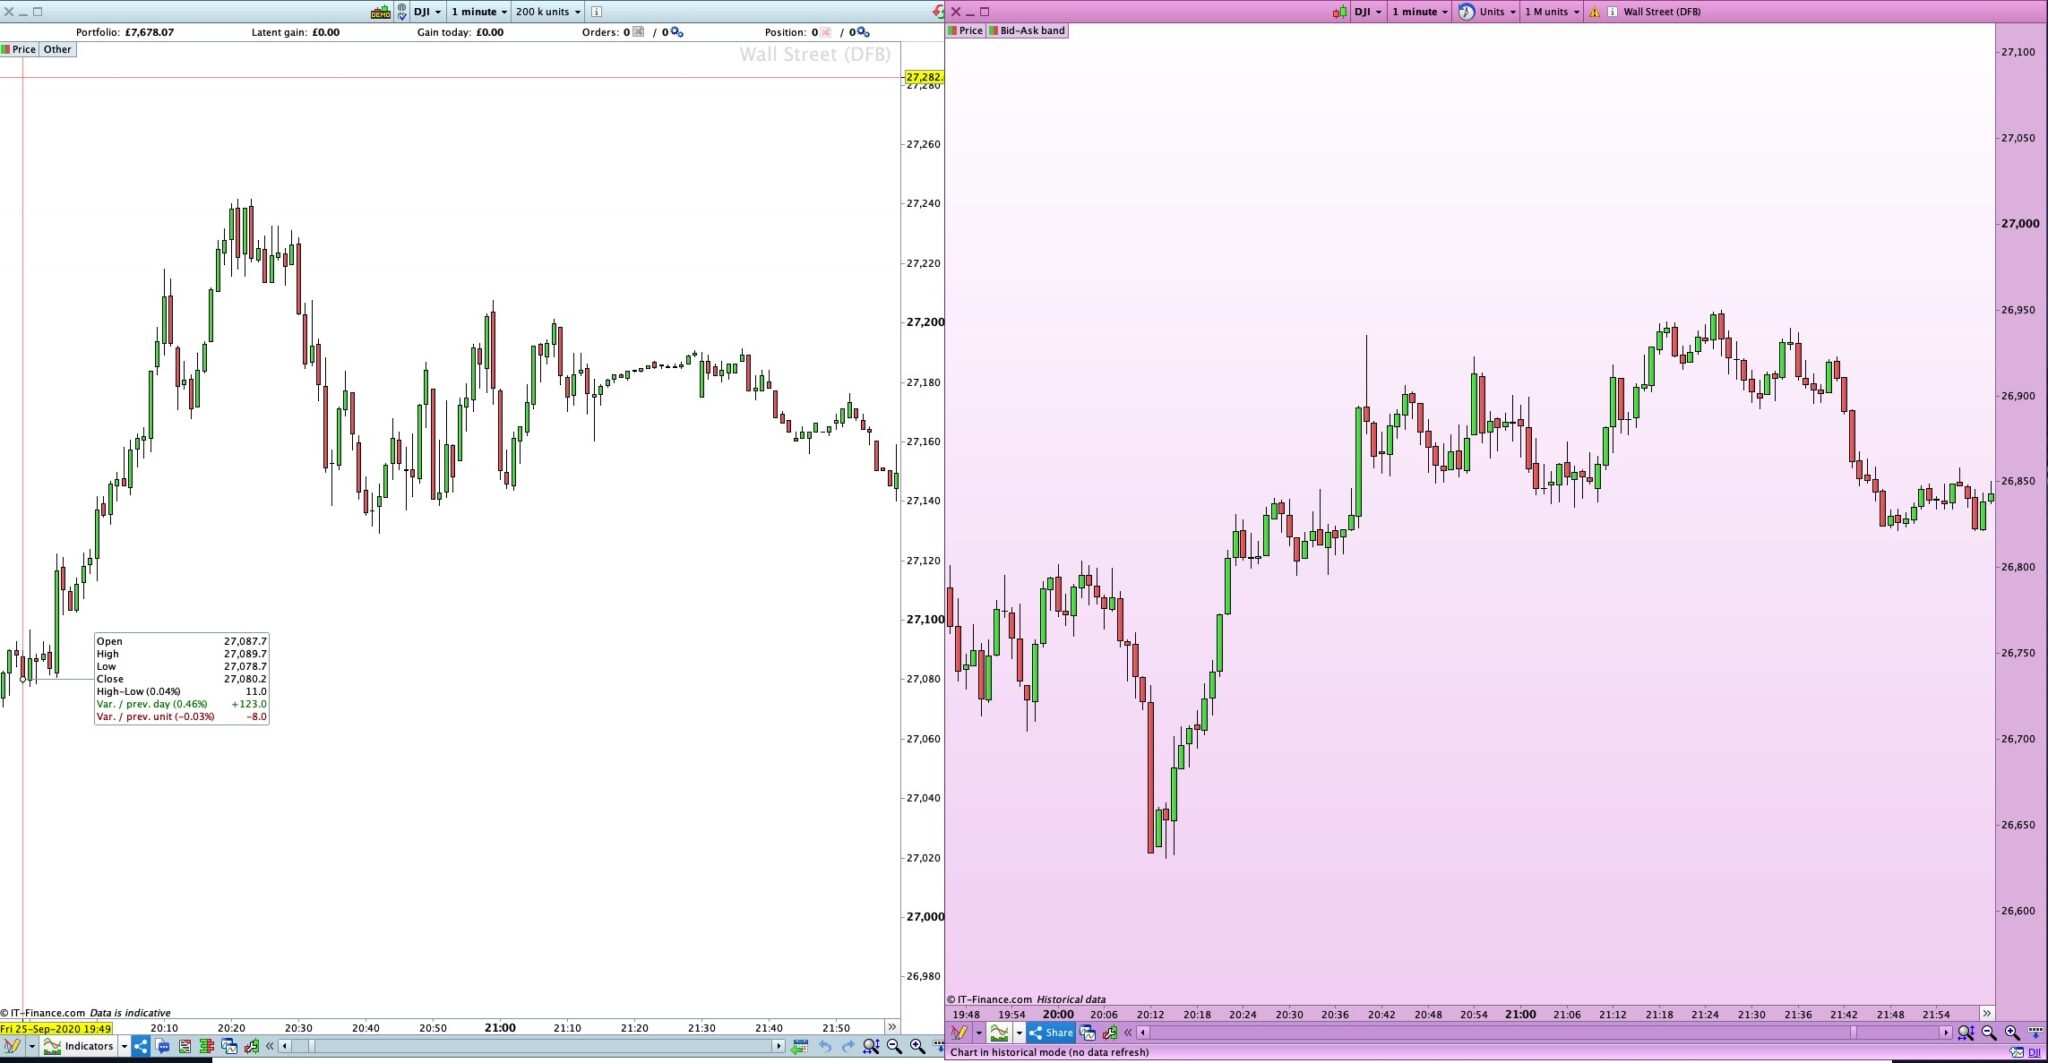
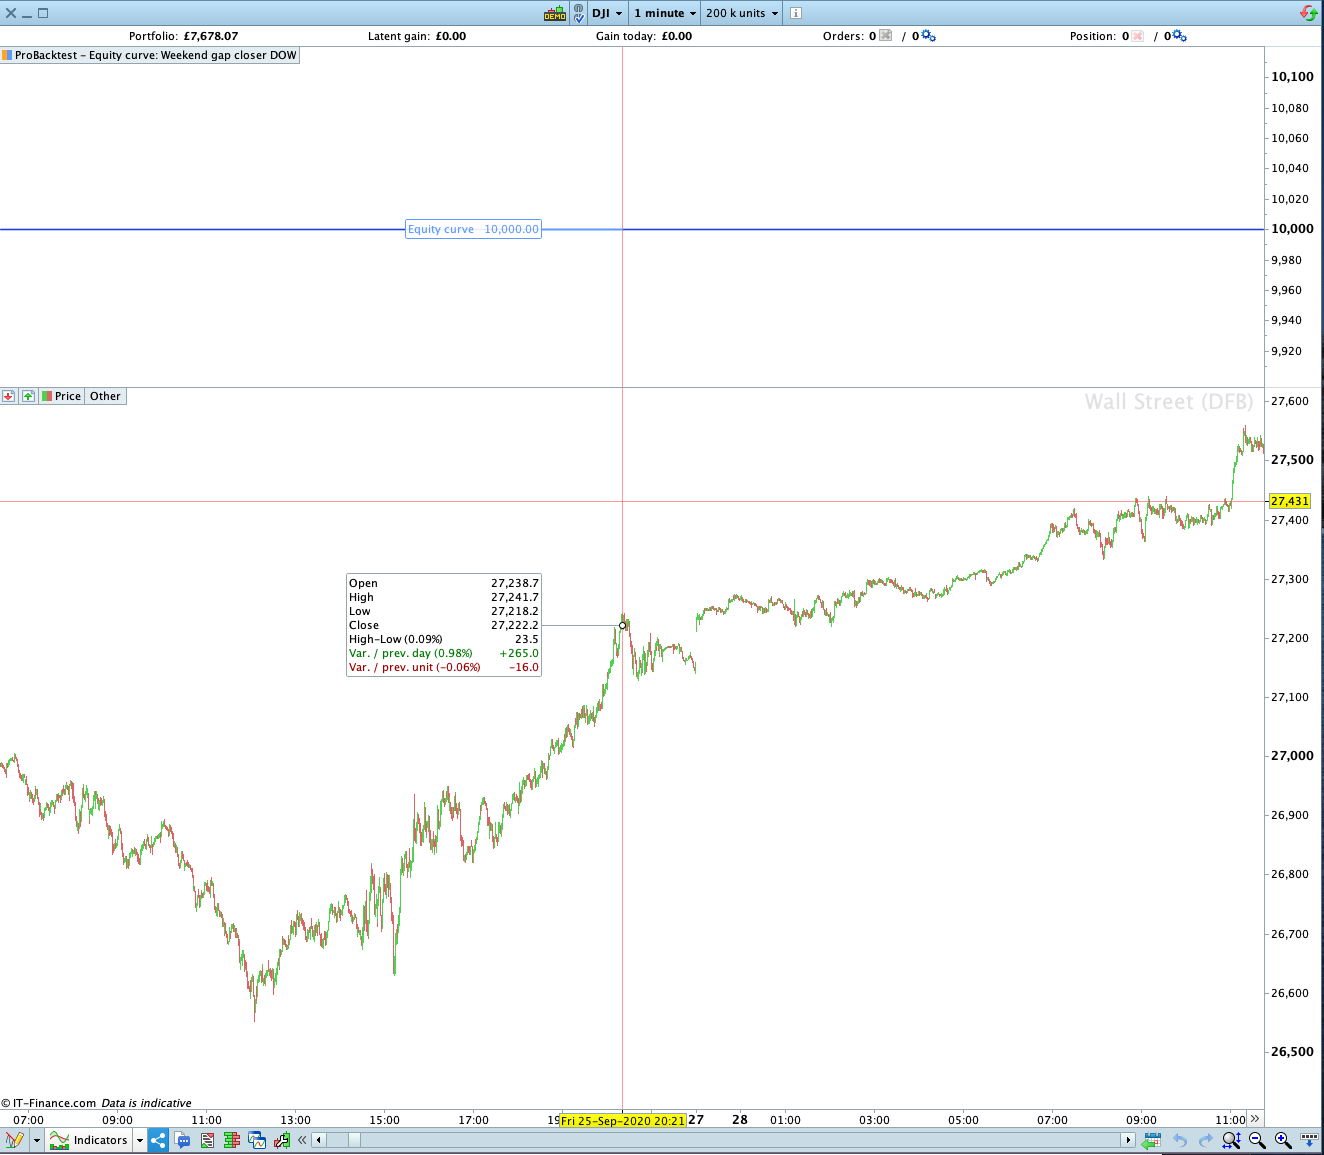
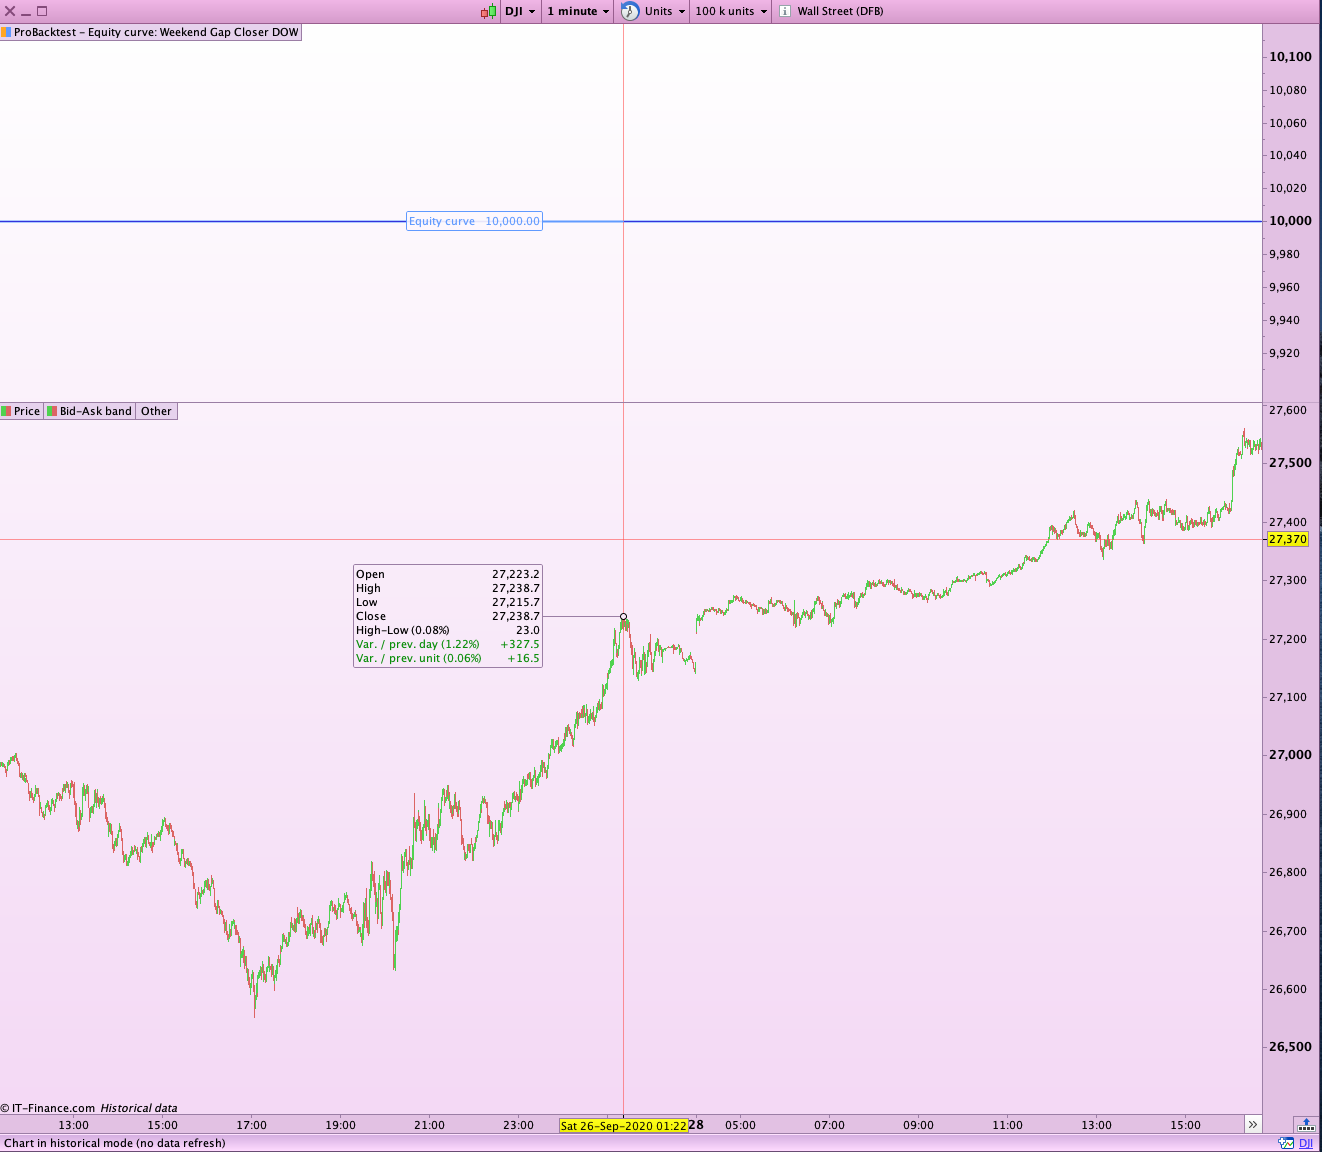
Take Friday 25th September 2020 for example. 1st picture attached is the same date for the Dow – approx 19:45 to 22:00. Demo vs live. The charts are totally different.
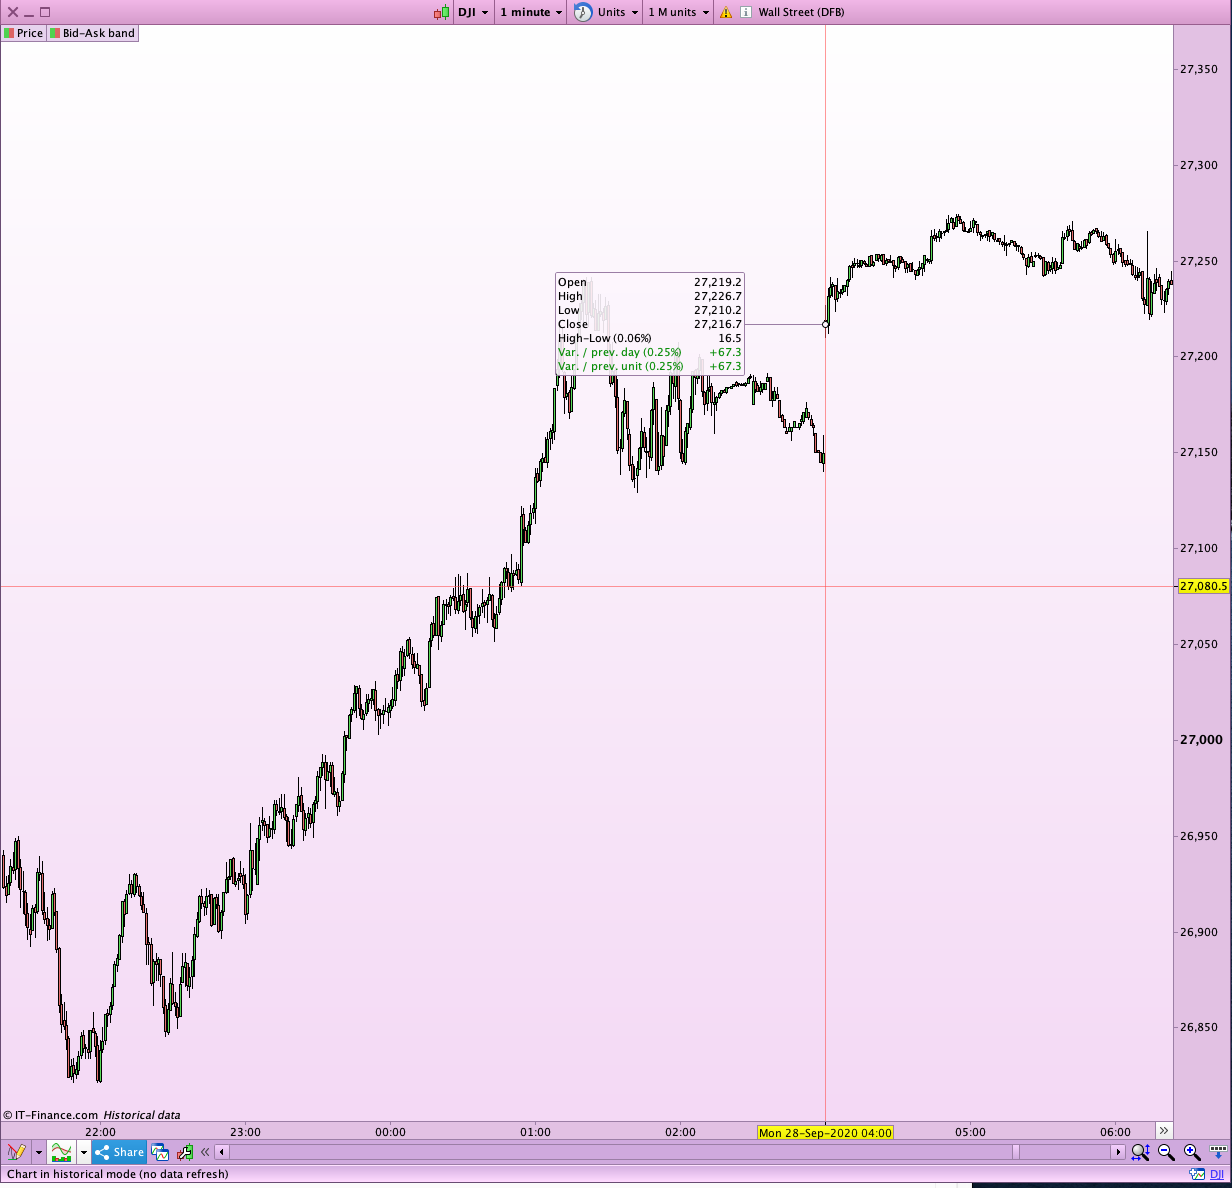
The 2nd attachment is the same date from live, looking at the data after 22:00 on Friday 25th September – you can see is carries on through Friday night, into Saturday morning, then gaps up at 3am Saturday morning into 4am Monday morning!
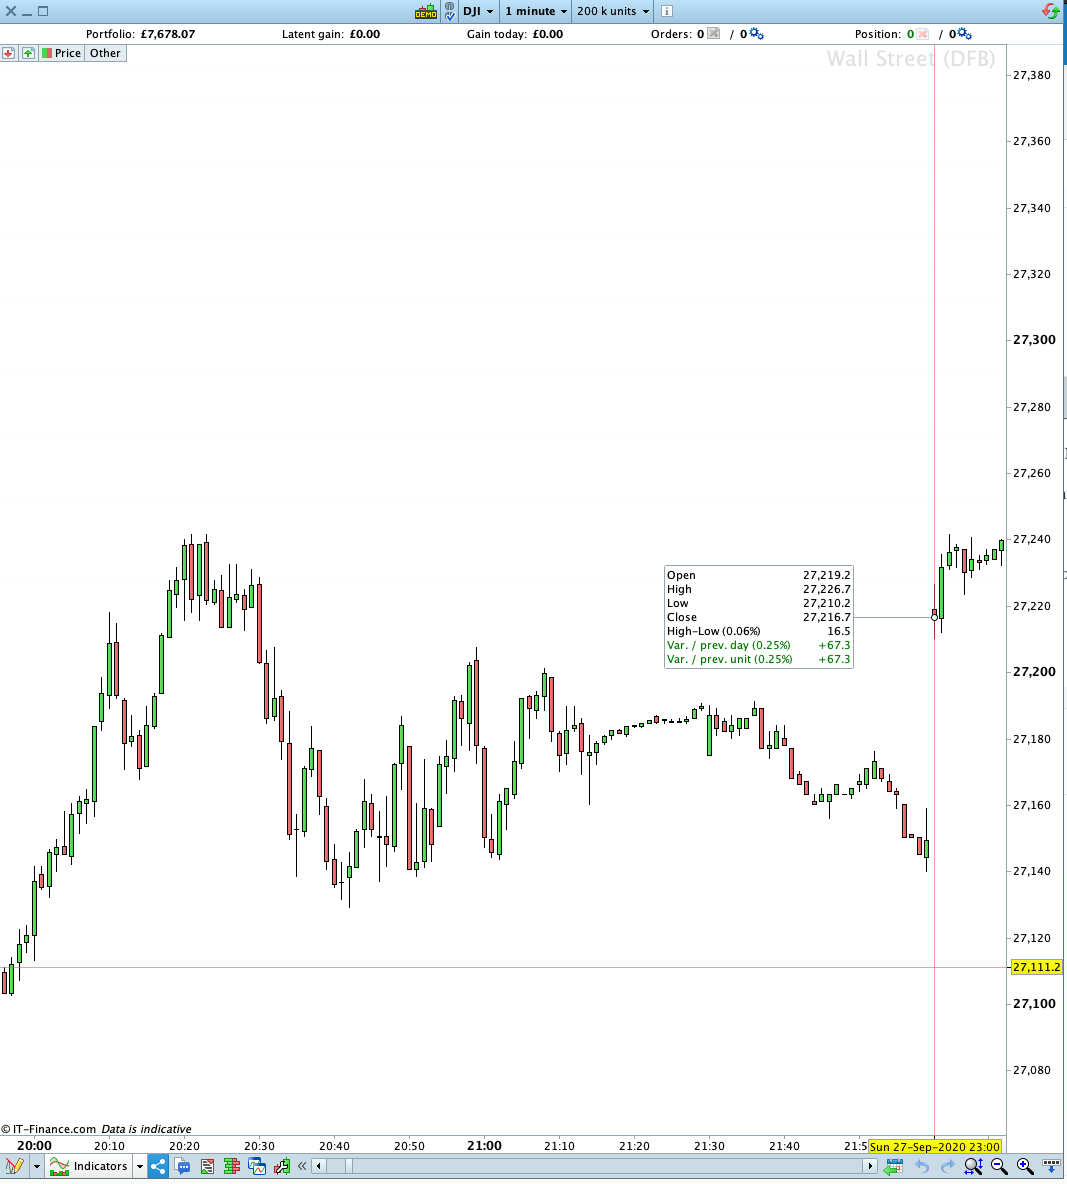
3rd picture is the demo platform for this date, showing the data stop at 22:00 Friday night, and start again at 23:00 on Sunday, as expected.
Obviously, all settings are the same on both (same time zone, display weekend data checked, 1m charts on both, etc)
What am I missing here?
Many thanks
eg when I look at the Dow Jones Friday evening data, I would expect to see the data stop at approx 22:00 on Friday night, and restart at 23:00 on Sunday. Indeed, that is what I see on the demo platform.
err … Apologies if I am too blind to see or understand today, but …
You seem to be in the UK. Correct ? This means that I could subtract one hour from what I see, in order to make it your times. For example, when I see that USA Stocks close at 22:00, for you this would be 21:00. Now, for you this should all read as :
- USA Stocks = DJi open at 14:30
- USA Stock = DJi close at 21:00
- Last weekday of trade is Friday … this would still be 21:00
- First week day of trade is Monday … this would still be 14:30.
Now where am I off ?
🙂
Maybe I don’t understand IG’s data because there it seems to show (for me) weird things. Do they create their own index data ?
This is how PRT-IB shows it, and for my part as I promised above (both are from live data) – remember to subtract one hour for the UK :
[attachment file=”155964″]
Above is a random week day (last Tuesday to Wednesday).
[attachment file=”155965″]
And this one is from Friday December 18 to Monday December 21.
To be sure : This is about the DJ Index. Futures are a different story (open outside of normal Stock trading hours), but that still won’t fit what you proposed (a bit better though ;-)).
Yes, the Dow officially opens at 2:30pm and closes at 9pm (Monday to Friday), but IG do indeed provide out of hours prices which extend things. The out of hours prices basically continue 24 hours a day from 11pm Sunday to 10pm Friday. The DJI chart should show the extended data.
By the way, IG also provide “weekend dow” prices which cover the whole weekend, but I’m not talking about that here as its a separate listing. Also I’m ignoring daylight saving changes for now – the example I gave is not affected by daylight saving…
So, as far as I can see, the demo platform has correct data (eg starting 11pm Sunday, and going 24hours a day up to 10pm Friday – but the live platform seems to have issues when it comes to the end/beginning of the week – especially for data older than a couple of months.
Remember, the 1st picture I posted earlier shows the same time period and the same date – mostly before the market even closed officially – and the charts are totally different. I can’t work out why….
I’ve lined these 2 charts up so they look exactly the same – ie they should show the same period – but check out the dates and times at the bottom..
The 1st pic (DEMO) says the little highlighted peak is Friday 25th Sept approx 8.20pm – correct…
The 2nd pic (LIVE) says that point in the chart is approx Saturday 26th Sept 1:20AM – INCORRECT!!
Its the same situation for each week I’ve checked before this date…
I was under the impression that IG provide out of hours prices that they create themselves because obviously there is no trading happening out of hours. Then when the market opens there will need to be an adjustment/gap if their own calculated prices do not match the opening price.
For data issues/questions it is best to send data technical reports via the platform.
I get that – thats not what the issue is here… It’s the mysterious extra data (eg Saturday mornings) and mis-matched times & dates when switching between platforms.
Those last pics I sent for example – you can see they are exactly the same chart. It’s just that the times & dates don’t match. There should never be Saturday morning data on a DJI chart, for example.
I’ll try sending something via the platform.
When I test my daily strategies on the DJI using my SEB technique I include Saturdays just to see what happens and there are sometimes trades shown opening on Saturday! The data from IG is definitely not 100% clean!
Yeah, it’s weird. And a big shame because it means the 1m bars are useless as far as backtesting goes. Just can’t trust it.
Back testing is very unreliable anyway because we have to use a fixed spread and moving minimum order distances are not taken into account which is nothing like the real world. Live forward testing is the only way to know what a strategy really does in the real world.
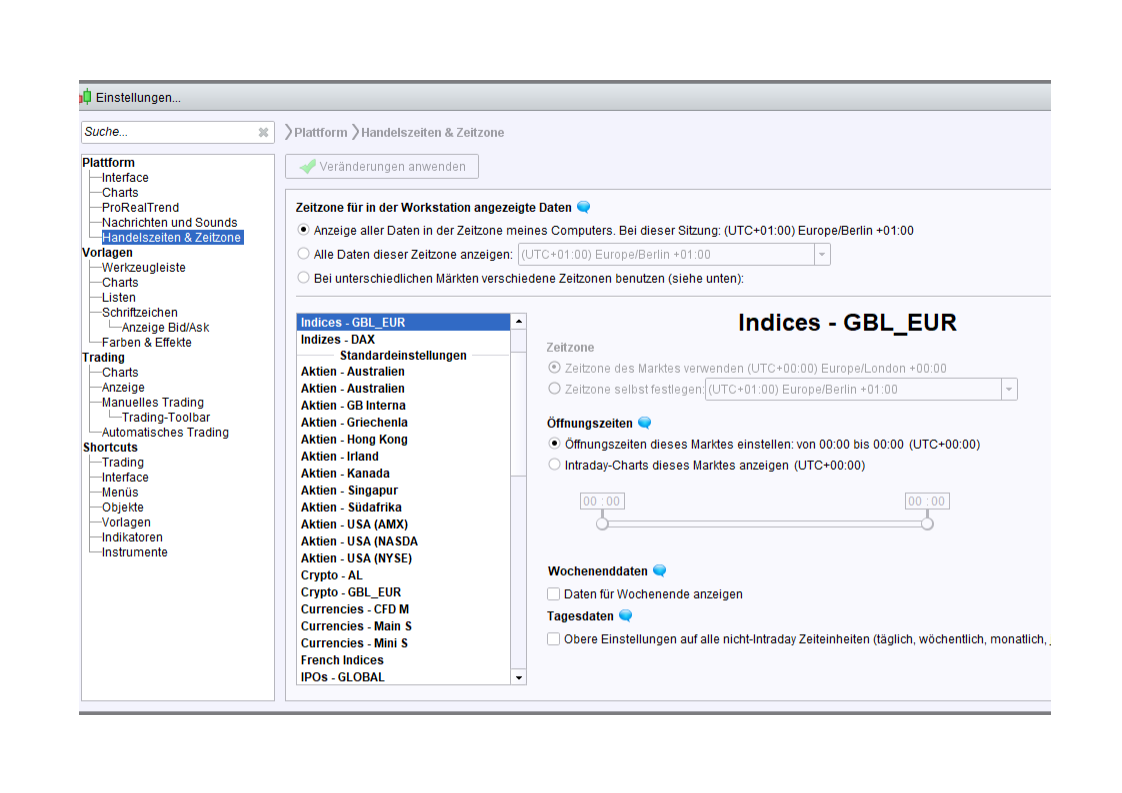
It could be that your live platform is configured in the wrong timezone. On the time axis, it shows 5 hours between Eastern Standard Time (New York time), which is then Western European Time, and so 8 p.m. New York time Friday night becomes 1 a.m. Saturday morning London time. Try to play around with the settings in “custom trading times” and you can remove this false configuration. Choose “Display all data in the time zone of my computer” instead of “Use different time zones for different markets”.
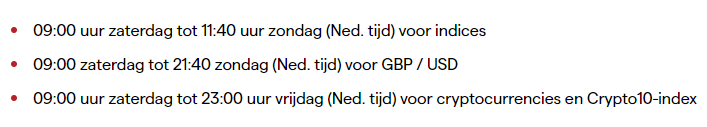
OK, with IG one can also trade a few commodities in the weekend :
It seems IG has many pages for many parts of the world and they are all as vague. Coindidentally the Dutch page is not vague at all, if you only know a bit of Dutch. Anyway from the latter, here are some trading hours (translated to UK times) :
- 08:00 Sat till 10:40 Sun for Indices
- 08:00 Sat till 20:40 sub for GBP/USD
- 08:00 Sat till 22:00 Fri for Crypto (this is fairly standard)
In Dutch times :
[attachment file=”156048″]
Is this still giving you problems @verygrubby We are in the 4th week since last post.
This bug is Log 17 in the Wants & Bugs List (PeterSt)
Yes, the historical data gets very weird when you go far back. I don’t know what the right answer is, so can’t trust any big backtests.
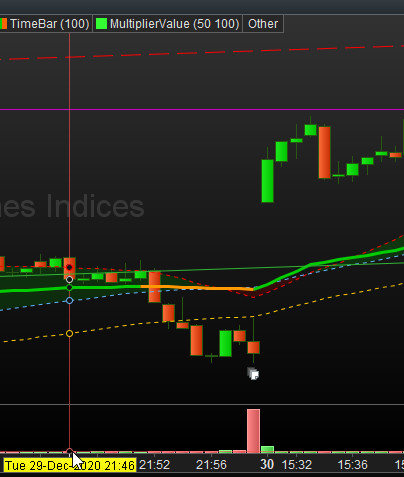
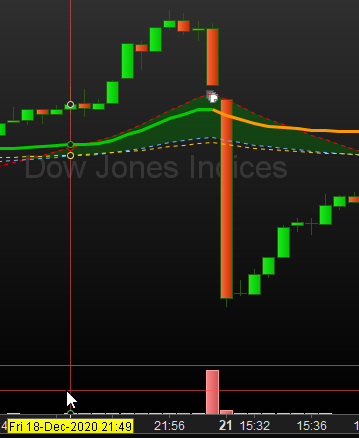
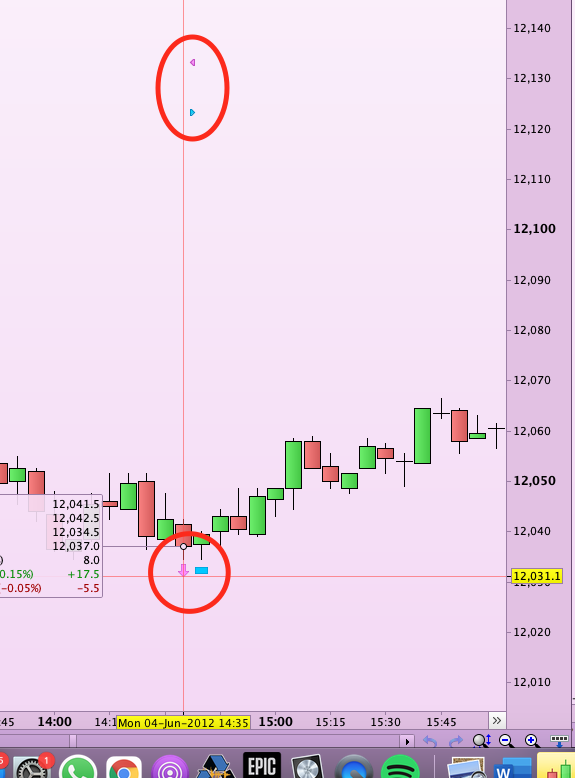
eg see screenshot attached – the top circle shows where the backtest says trades were triggered & exited – waaaaay above where the price was, according to the chart. The equity curve for the strategy therefore shows an immediate silly jump and a similar plummet. MFE & MAE also silly. This was 2.35pm on a Monday by the way.
Which is the right price for that time? Is it the backtest results, or the chart? Who knows. Big backtests are therefore useless.
Who marked this Topic as Resolved then I wonder?
What Instrument and Timeframe is that chart you show above?
The original post refers to dates in 2020; the screenshot above is from June 2012.
Have you noted this Bug …
- Widespread across all historical data (from recent to 2010)?
2. In many instances or limited instances only?
3. On many Instruments or DJIA only?