Hello,
I am busy with a indicator which marks the highs and lows of price based on the stochastic cycle, after the stochastic cycle has closed. A cyclehigh is where %D > 50 and a cyclelow is where %D < 50. I use EUR/USD.
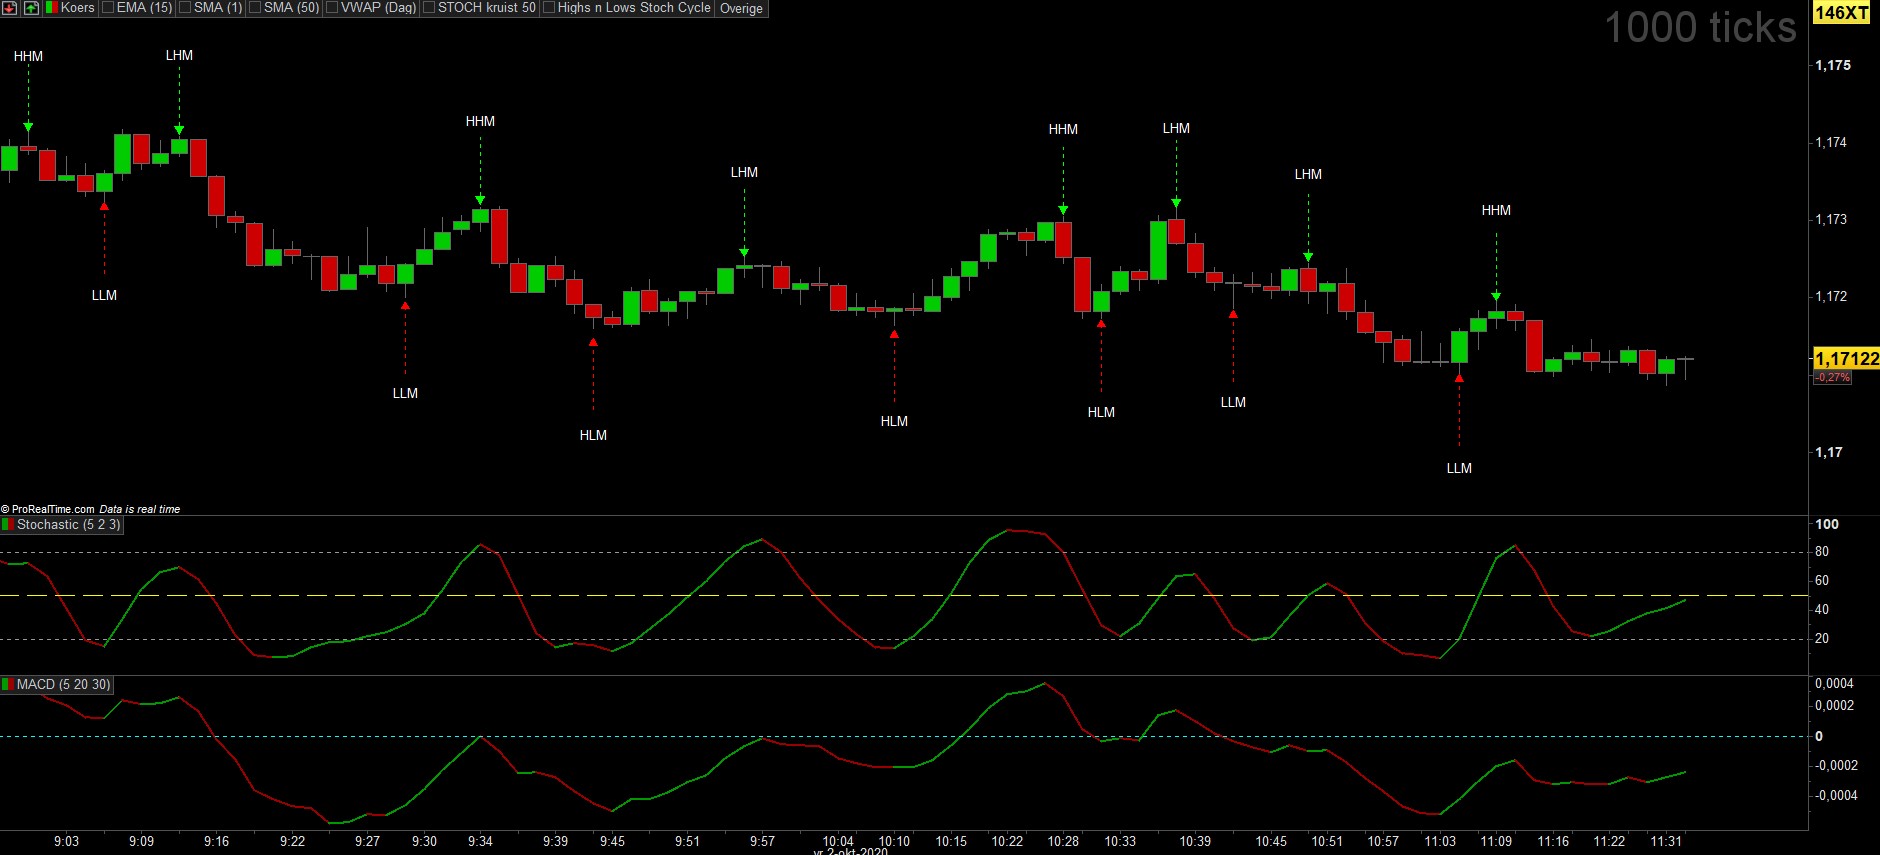
I would like to have a Textsignal at the candle with the highest high when the Stochastic D > 50 and at the candle with the lowest low when the stochastics D < 50. And preferable that is tells me also if this highest high is higher or lower then the previous highest high from the previous cycle.
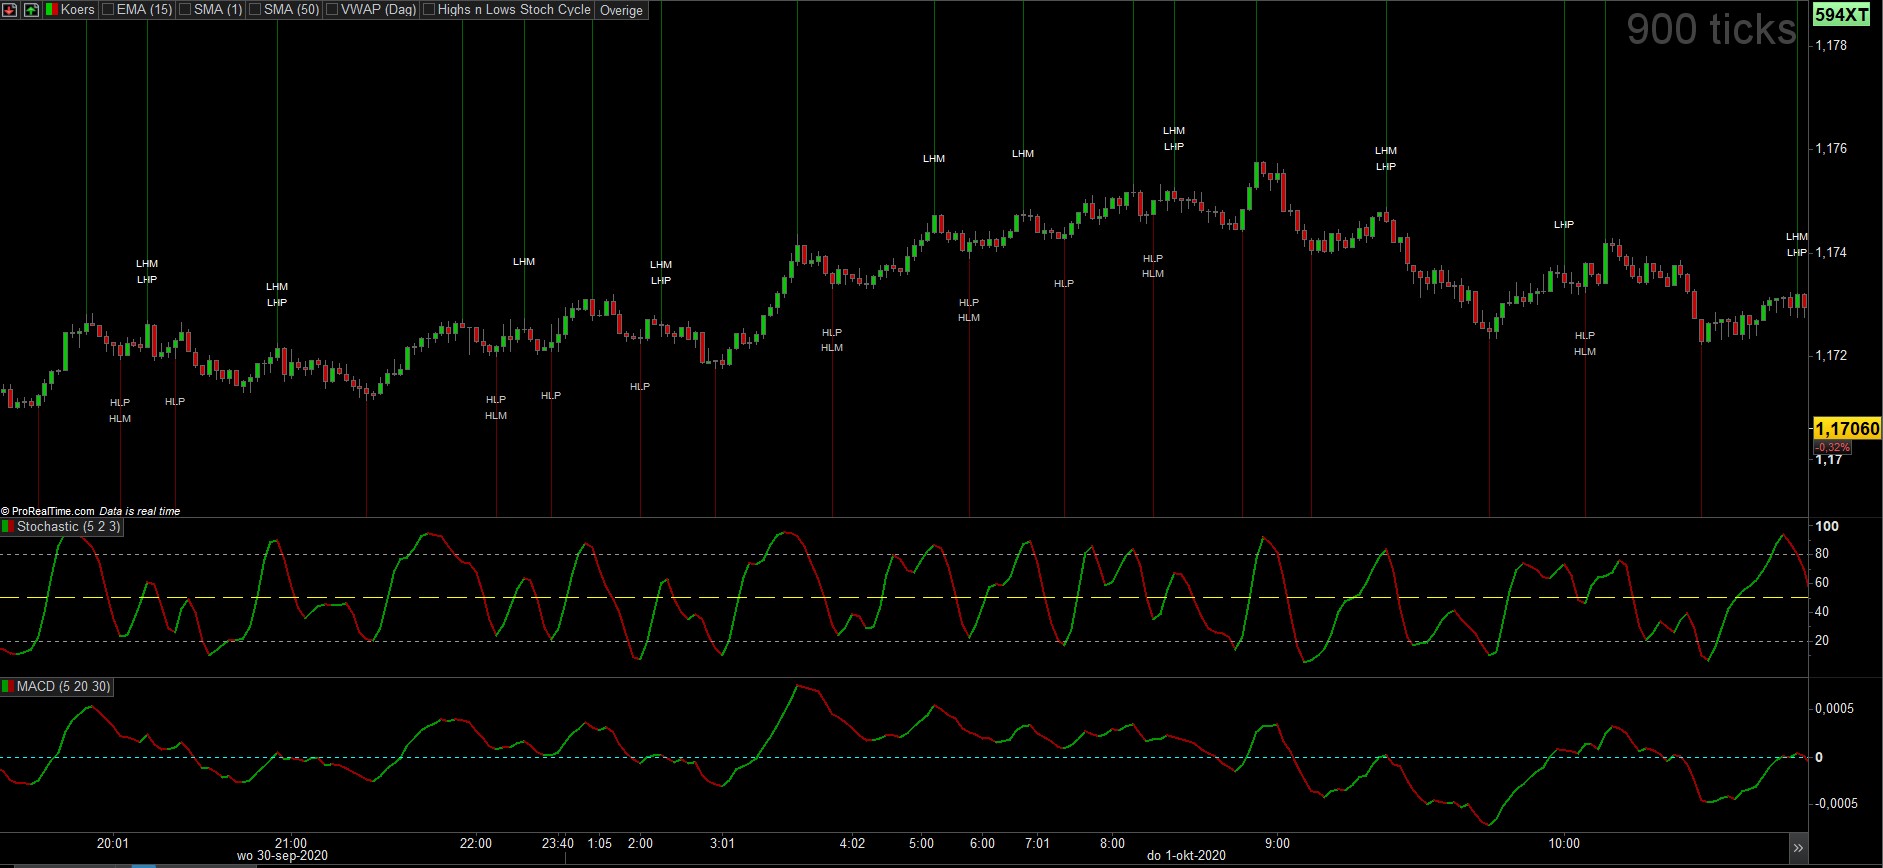
I manage to program to define the highest high and lowest low, and also the previous highest high and lowest low but I only manage to show them as lines. That makes to much noise in my charts so I am looking for a way where I can mark ONLY the candles with the highest high and the lowest low in the cycle and preferable that is tells me also if this highest high is higher or lower then the previous highest high from the previous cycle.
So my challenge is in the part where I want to DrawText and define the candle where to do draw text. It needs to mark the highest high when the cycle high is over and not during the cycle high. And if the macd has made a lower high during that cycle high.
// This indicator marks highs and lows based of price and macd based on the Stochastic cycle
K = stochastic[5,3]
D = average[3](K)
sma20 = average[20]
macdl = macdline[5,20,30]


//start of cycle low looking for the lowest price and lowest MACD as long as Stochastic %D<50
If D =< 50 and D[1] > 50 then
incyclelow = 1
lowestprice2 = lowestprice
Lowestprice = low
macdlowest2 = macdlowest
macdlowest = macdl

endif

//End of cycle low
If K => 50 and K[1] < 50 then
incyclelow = 0
endif

//lowest macd and price in Stochastic cycle %D<50
if incyclelow then
lowestprice = min(lowestprice, low)
macdlowest = min(macdlowest, macdl)
endif


//start of cycle high looking for the higestest price and higest MACD as long as Stochastic %D>50
If D => 50 and D[1] < 50 then
incyclehigh = 1
highestprice2 = highestprice
HighestPrice = high
macdhighest2 = macdhighest
macdhighest = macdl

endif

//End of cycle high
If K < 50 and K[1] > 50 then
incyclehigh = 0
endif

//highest stoch and price in cycle high
if incyclehigh then
highestPrice = max(highestPrice, high)
macdhighest = max(macdhighest, macdl)
endif

//LONG
if incyclelow = 0 and lowestprice > lowestprice2 then
DRAWTEXT ("HLP", barindex, low-0.0008, Dialog, Bold, 10) COLOURED(0,0,0)
endif
if incyclelow = 0 and macdlowest > macdlowest2 then
DRAWTEXT ("HLM", barindex, low-0.0010, Dialog, Bold, 10) COLOURED(0,0,0)
endif

//SHORT
if incyclehigh=0 and  highestprice < highestprice2 then
DRAWTEXT ("LHP", barindex, high+0.0008, Dialog, Bold, 10) COLOURED(0,0,0)
endif
if incyclehigh =0 and macdhighest < macdhighest2 then
DRAWTEXT ("LHM", barindex, high+0.0010, Dialog, Bold, 10) COLOURED(0,0,0)
endif

return lowestprice as "lowest price in cycle low",macdlowest as "lowest macdline in cycle low",  lowestprice2 as "previous lowest price in cycle low", macdlowest2 as "previous lowest macdline in cycle low", highestprice as "highest price in cycle high",macdhighest as "highest macdline in cycle high", highestprice2 as "previous highest price in cycle high", macdhighest2 as "previous highest macdline in cycle high"
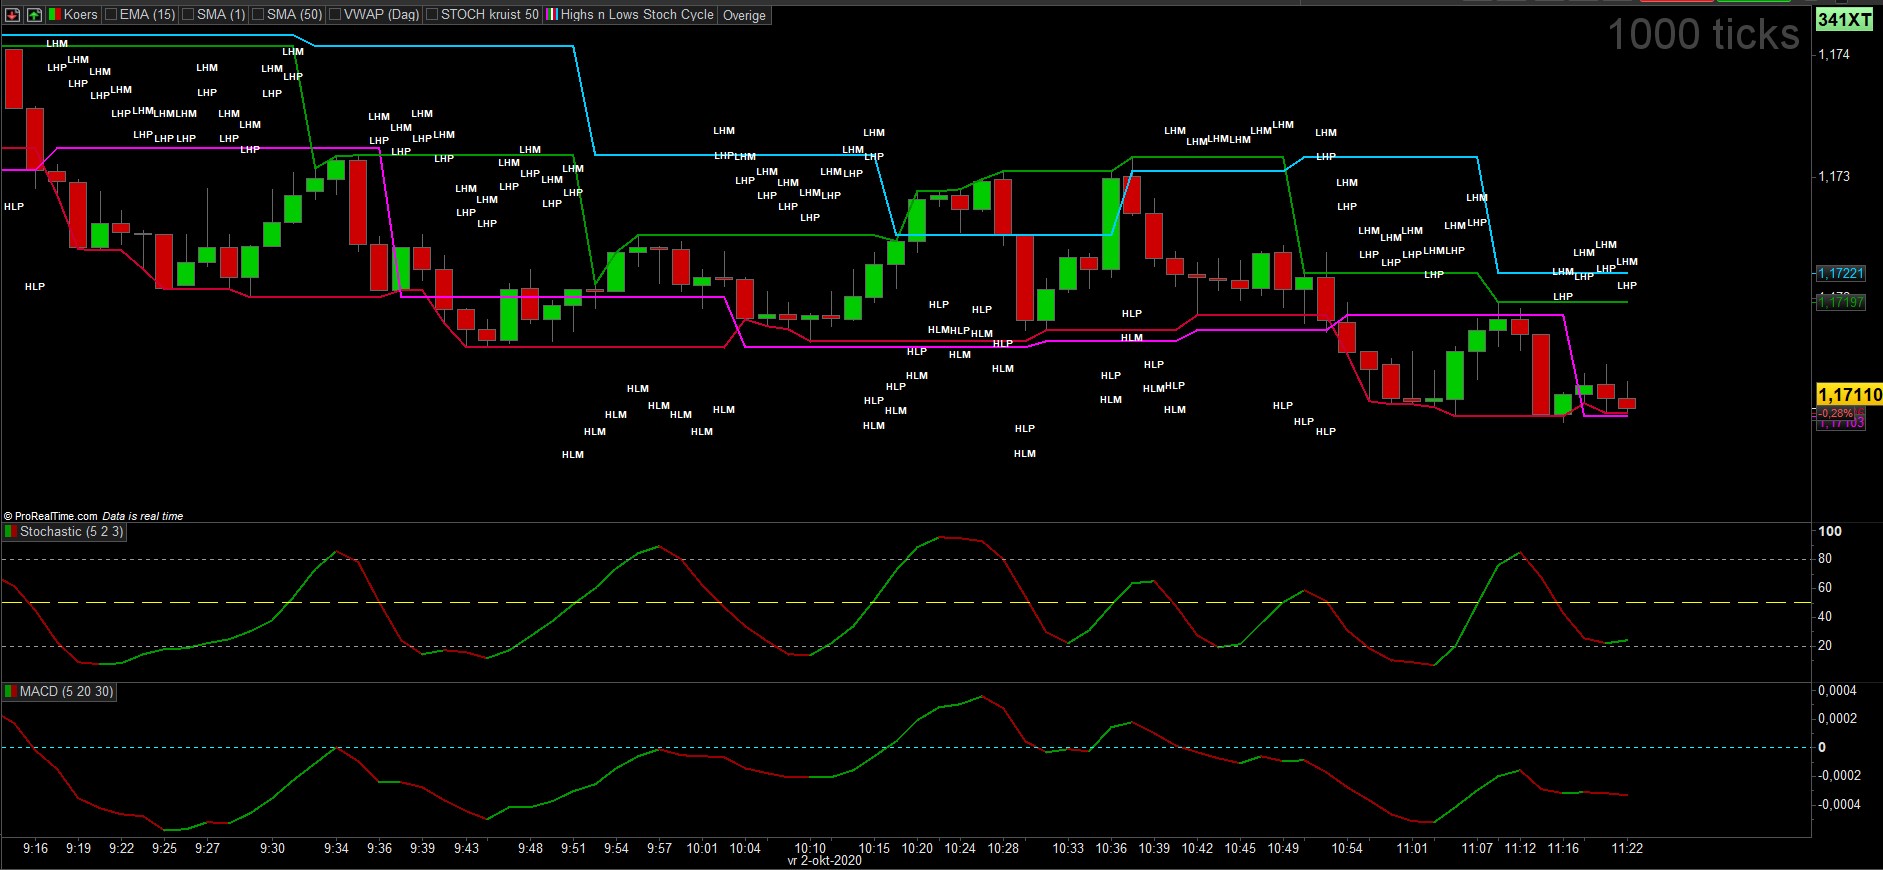
In my indicator you see the highs and lows and the previous highs and lows.
Red = lowest price
Purple = previous lowest price
Green = highest price
Light blue = previous highest price
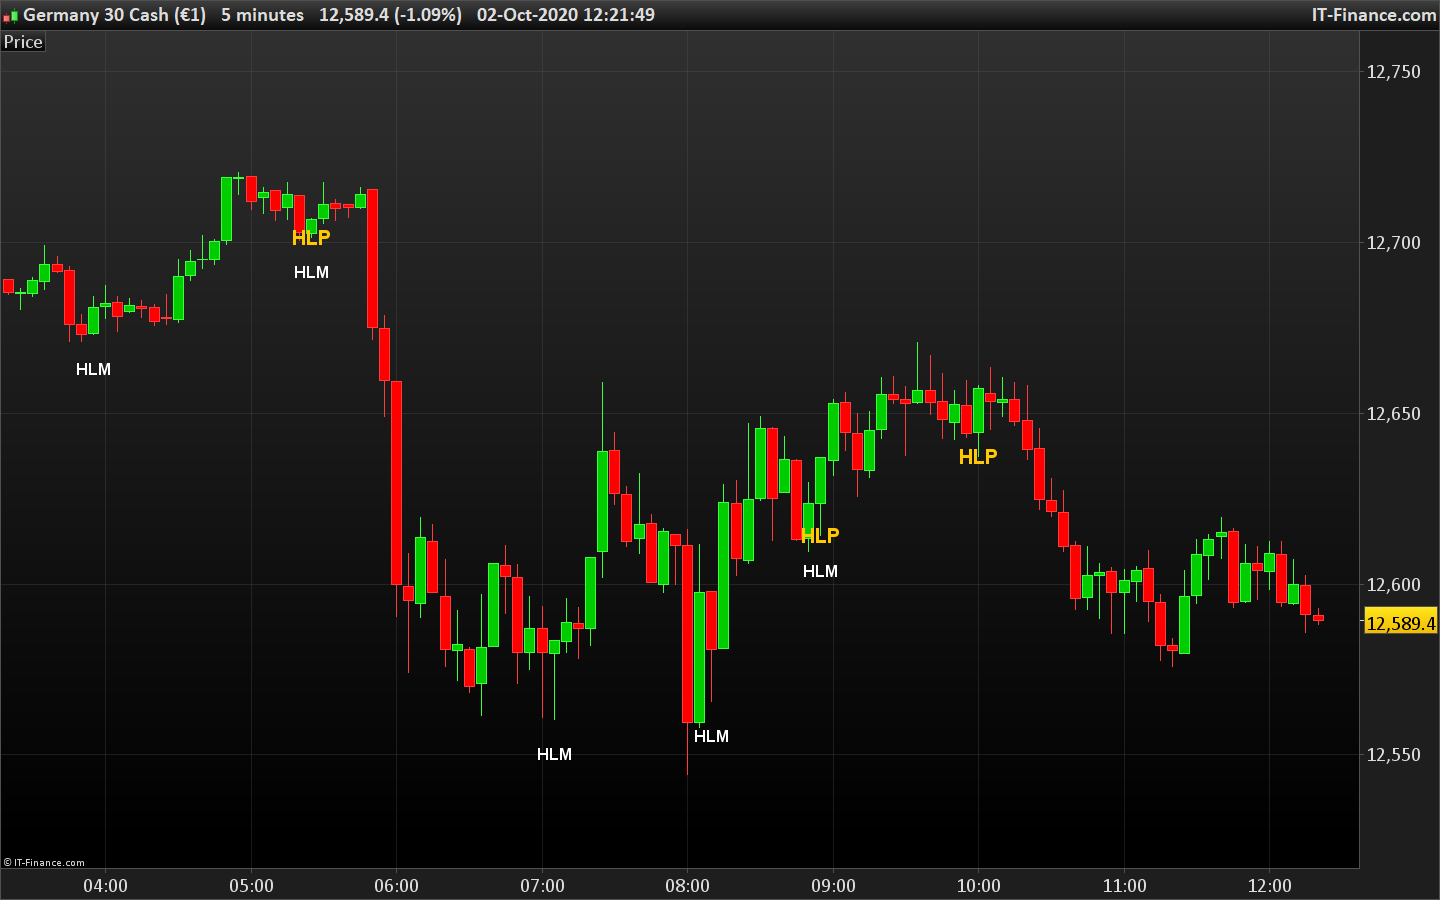
The signal from theHH HL LL and LH from the macd can also be done in a seperate indicator if it isn’t possible to combine them, The thing with the MACD of course is that the visibilaty of the signal depends on waht you trade.