Maz
MazParticipant
Veteran
Hi All,
Need some help devising a formula for replicating higher time frame indicators exactly on lower time frame views.
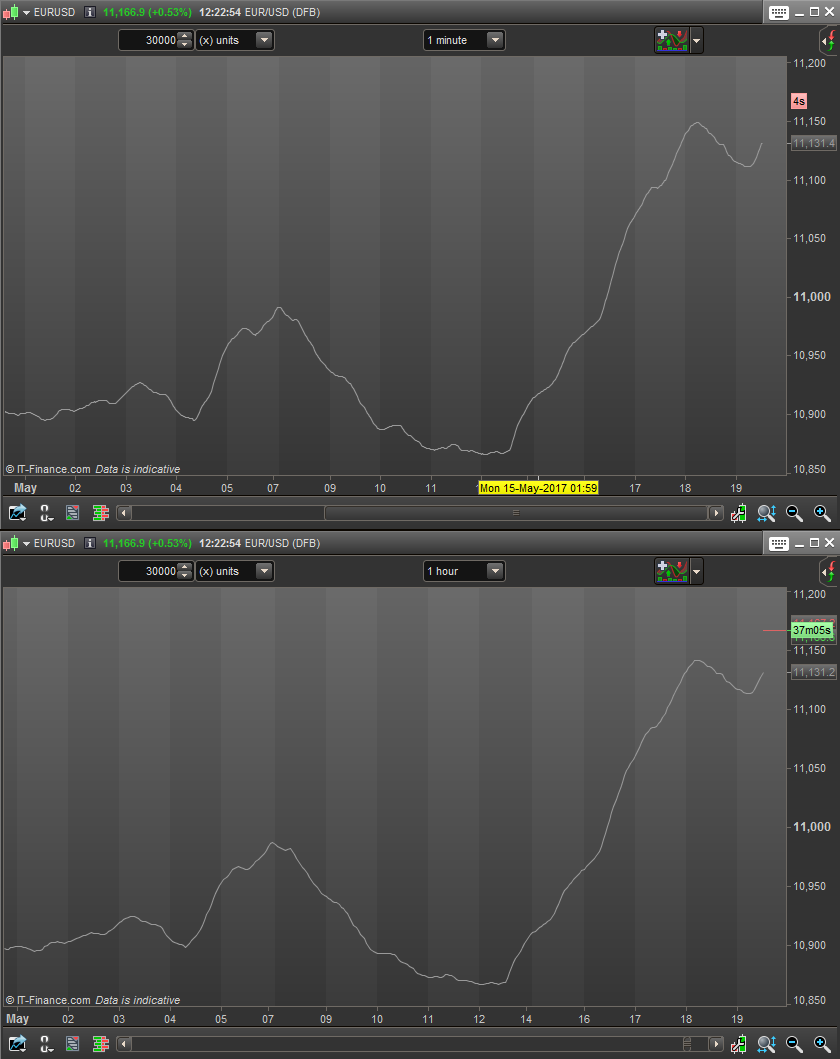
Take a look at the attached screen shot. Above graph shows 1 minute candles; Lower graph shows 1 hour candles. I wanted to have an MA look exactly the same on both lower and upper time frames. At first I thought “ok, 60 minutes in an hour, multiply period by 60” – not quite. Turns out the calculation for this is not so simple.
SO here is a first case study: an EMA[20] on H1 should be EMA[what] on M1 in order for them to both look exactly the same (or at least very very similar)?
Devise a formula to find small time frame indicator period, p, where P is the indicator period of the large time frame and c is the coefficient between them. Clue: means you need to find c first!
So, devise a formula to figure out the coefficient c, where L (aka m60 aka H1) is the larger time frame and m (aka m1) is the smaller (target) timeframe.
Keep in mind that we want to be able to convert from ANY larger time frame to ANY smaller time frame and have our resulting EMA look the same. So the formula should not be unique for H1 and m1 but universal for any combinations. Is this possible?
You have one hour. Your test time starts now… 😀 First one to complete the task gets a chocolate bar. :-p
Any questions let me know
Best,
M
Hi Maz – Thanks for bringing this up. Sorry, my above attachment (ema 1200 vs 20) got posted without the writing. I’m after the same solution ! I use the normal method you described but as you pointed out, it doesn’t work when there is an exponential average and fast moving prices but it’s as close as I can get without it being exact. It needs someone to perhaps factor in the exponential bit of the calculation to differentiate it from standard ma. I hope someone here has a better solution :-).
P.S. this is the formula for the approximated version if anyone is interested. We just need to find that missing coefficient…..
a*x = b*y
Where a & b are the two timeframes and x & y are the associated ema’s – you always want to solve for x/y. In this case it’s 60*20 = 1*y therefore y = 1200 ema
Great question, I was wondering the same but for ATR, I guess there isnt a close formula for that case. In general one of the task PRT developer should adress in my opinion is the possibility to code strategy in a time frame X that make reference to indicator and prices to any indicator Y.
On closer reflection, I’m not even sure it’s possible with an all-encompassing formula ? Because one TF has more data points than the other so these extra prices would affect the overall calculation and hence if the prices are constantly changing and as such so will their coefficient. Happy to be proven otherwise.
I agree there is no closed formula. the best you can do I guess is running an solver algo where you have the two curves, minimizing the sum of the difference squared of the observation point you have aavailable
MazParticipant
Veteran
Yea I feared you might come to that conclusion too :-/
A thought – if you were displaying H1 ema[20] in M1 (as say, ema[850] for example), then it would really need to be correct on the hour at least, with slight variation intra-hour. @Francesco78 – yes a solver as you described – alas PRT :-). Obviously the simplest fix is multi time frame trading systems!
Thanks guys.
It wouldn’t be the same in that case either as you run into the same problem of one calculation having more inputs than the other and hence influencing the average on the hour. They are pretty close in non volatile markets (eg overnight) as the averages get a chance to stabilize but not when they are rapidly changing. Yep MTF is the solution, I understand it’s in the works, can’t come soon enough !