I can’t find using the search
What I would like is to add the bollinger bands to a daily chart but that it displays the weekly bollinger bands
Any help much appreciated
David
Multi Time Frame is not currently available for indicators. It was due for release quite soon but Covid-19 has put a delay on most new releases on the platform.
As a work around you can create a dummy MTF strategy which draws the weekly bollinger bands on the daily chart.
Also if you are using v11 which has arrays then it should be possible to create an array of recent weekly closing prices and then calculate our own standard deviation of them to use to calculate our own bollinger bands.
Here is the dummy MTF strategy:
timeframe(weekly)
p = 20
upper = bollingerup[p]
lower = bollingerdown[p]
middle = average[p]

buy at -close limit

graphonprice upper
graphonprice lower
graphonprice middle
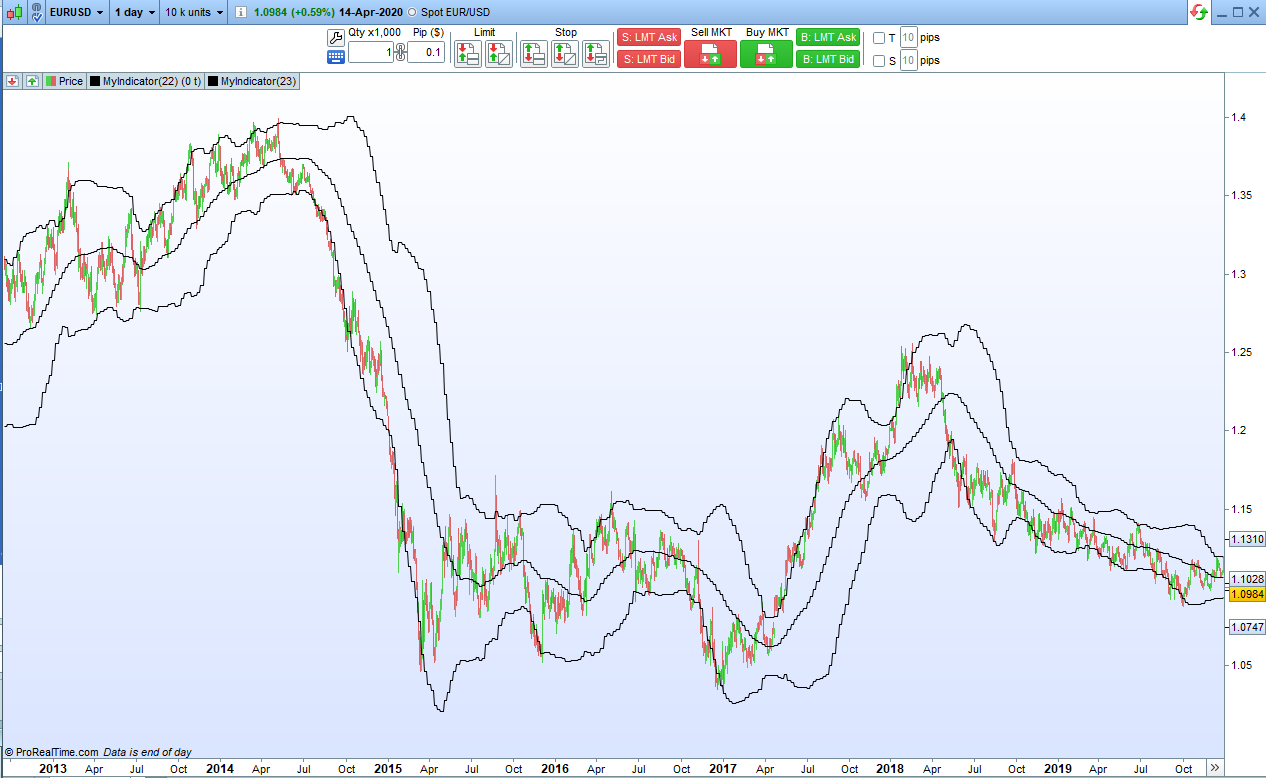
Here is the code for an indicator on PRTv11 that draws weekly bollinger bands on the daily chart. It updates the lines on Monday.
//Weekly Bollinger Bands On Faster Time Frame chart
//PRTv11
//By Vonasi
//Date: 20200415

p = 20
deviations = 2

//store each weeks close
if opendayofweek < opendayofweek[1] then
a = a+1
$price[a] = close[1]


if a >= p then
//get a mean of last p weeks close price
total = 0
for b = a downto a-p+1
total = total + $price[b]
next
avg = total/p

//calculate standard deviation
total = 0
for b = a downto a-p+1
total = total + (square($price[b]-avg))
next
stdev = sqrt(total/p)

//calculate bands
upper = avg + (stdev*deviations)
lower = avg - (stdev*deviations)
endif
endif

return upper as "upper", lower as "lower", avg as "avg"
Here is a version of the above code that instead of updating only on the first day of the week just like TIMEFRAME(WEEKLY,UPDATEONCLOSE) behaves more like TIMEFRAME(WEEKLY,DEFAULT) and updates every candle.
PRTv11 only due to the use of arrays.
//Weekly Bollinger Bands on Faster Time Frame updating every candle.
//By Vonasi
//Date: 20200415

//p = 20
//deviations = 2

once upper = undefined
once lower = undefined
once avg = undefined

//store each occurance
if opendayofweek < opendayofweek[1] then
a = a+1
$price[a] = close[1]
endif

if a+1 >= p then
$price[a+1] = close
//get a mean of last p weeks close price
total = 0
for b = a+1 downto a-p+2
total = total + $price[b]
next
avg = total/p

//calculate standard deviation
total = 0
for b = a+1 downto a-p+2
total = total + (square($price[b]-avg))
next

stdev = sqrt(total/p)

//calculate bands
upper = avg + (stdev*deviations)
lower = avg - (stdev*deviations)
endif

return upper as "upper", lower as "lower", avg as "avg"
Thank you for that, however when I attempt to create the indicator I get the following message:
The following variable is undefined;deviations, P
Yes you need to add them as external variables that you can then change the value of in the indicator configure window or remove the // before them on lines 5 and 6.
I plan to submit to the library two indicators that can display MTF standard deviation bands and MTF simple moving averages to any chart just as if we had MTF indicators – plus some other Bollinger band array based indicators that are quite interesting. PRT were doing maintenance today so I could not submit them but hopefully I will find time tomorrow but we will also have to wait for Nicolas to give them a five star review and make sure that they are colourful enough before they are released! (private joke)
the question is:
is there a way to calculate MTF moving average/bollinger via probacktest, but by choosing the close observations. Exemple: close of the day, or the week, at a specific time (to replicate cash markets on indexes), instead of the last candle of the chart for that day/week.
Yes that should be possible. With arrays you can fill the array with whatever values you want so if you fill it with the closing price at 1630 every day then you can calculate an average of the last p values in the array and then calculate standard deviation bands off this average.
I’ve just published an MTF simulating indicator to the library that might be of interest to you:
Multi Time Frame Simple Moving Averages and Standard Deviation Bands
This code should do it. Not tested as I don’t have faster than daily charts on my v11 at the moment). It updates on every new candle just like TIMEFRAME(x,DEFAULT) would do.
//Time of day Bollinger Bands
//By Vonasi
//Date: 20200420

p = 20
deviations = 2
mytime = 163000

once upper = undefined
once lower = undefined
once avg = undefined

//store each occurance
if opentime = mytime then
a = a+1
$price[a] = close[1]
endif

if a+1 >= p then
$price[a+1] = close
//get a mean of last p weeks close price
total = 0
for b = a+1 downto a-p+2
total = total + $price[b]
next
avg = total/p

//calculate standard deviation
total = 0
for b = a+1 downto a-p+2
total = total + (square($price[b]-avg))
next

stdev = sqrt(total/p)

//calculate bands
upper = avg + (stdev*deviations)
lower = avg - (stdev*deviations)
endif

return upper as "upper", lower as "lower", avg as "avg"