Hey!
I have a strategy that I would need help with programming for an exchange robot. Can you help me with that or do you have any you can recommend?
Sincerely
Morgan Jonsson
I have moved your post to a new topic for your specific request.
In order to assist you, please provide as much information as possible about your trading robot strategy please. Indicators used, entries and exit. Screenshots appreciated, thanks!
Hey!
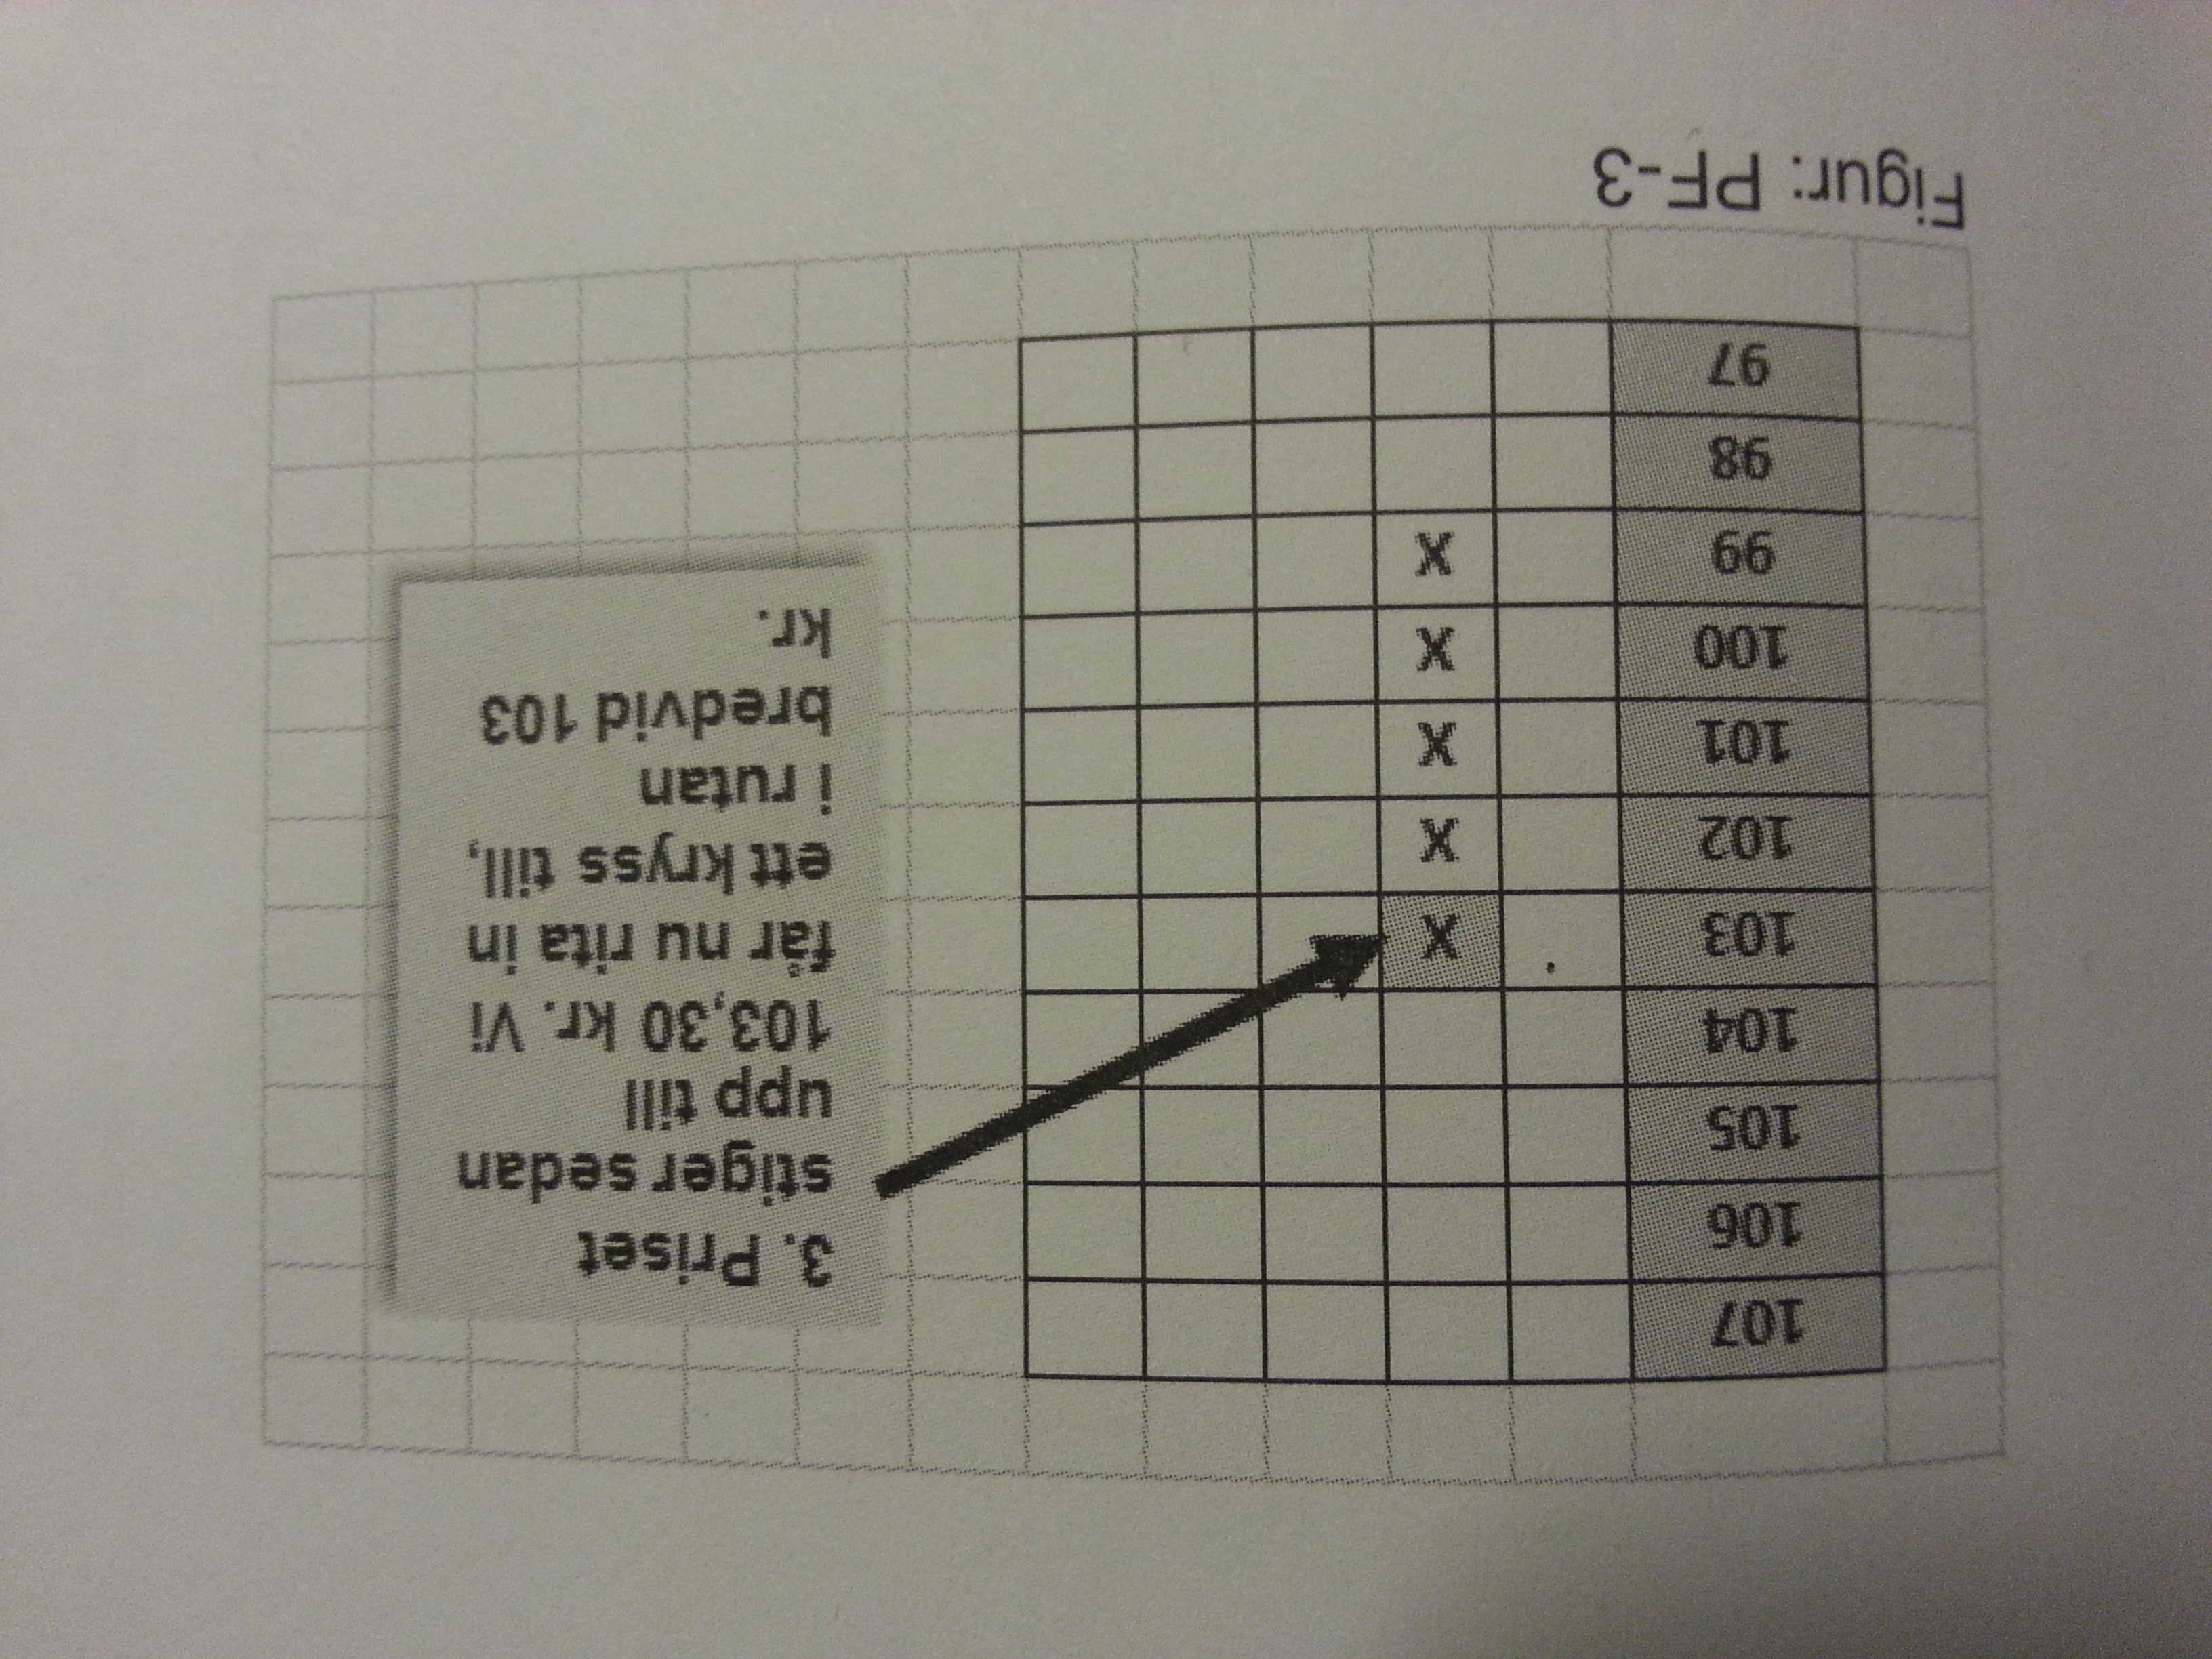
Here’s my strategy out: Pont and figure chart is moving only if the price is moving either up predetermined distance or down by a predetermined distance. If the price is moving when nothing happens in the chart.
Ruterna in the chart called boxes should be 0.2% or 2 points for day trading and 1%, or 10 points for swing trading. When the price goes up, the drawn cross (X) in the boxes and rings (o) when the price goes down. as long as the price rises so we draw the check åvanför each other. If the price starts to fall then so can any column change (trend reversal) be relevant. The rules for a column replacement is as follows: The price must fall at least three boxes, so that we get to do a column switching to draw then into at least three rings or more until it corresponds to the price decline. The rules are reversed for column switching for the rise.
Buy and sell signals
1 Three-top buy signal. Three-bottom sell signal.
2 Three-top buy signal with rising peak. Three-bottom sell signal with decreasing bottoms.
3 buy signal after a high wall. Single buy signal. Högväggen shall consist of at least eight to ten boxes. Sell Signal for high wall. Easy sell signal. Högväggen shall consist of at least eight to ten boxes.
Three top buy signal. We can expect the following outcomes:
33% of the signals reach 5-9-level gain (5-9%)
34% of the signals providing 1-4-level gain (1-4%)
33% of the signals gives a loss of 1-3-level loss of -1% to -3%.
Trailing-stop about -3% (boxes)
Want to add moving average calculated on the values of point and figure.
sending pictures in another email.
Sincerely
Morgan Jonsson
https://ch3302files.storage.live.com/y3p9LRdwep-F93BT44BYdWspLQ6MTWKofHqx16qIWbE1wvzo0kG0qG_FXM9ymmT2hCqhrS9k0U0CNhonY8wPa0olw/JPEG_20161216_170938_-139280228.jpg?psid=1&ck=4&ex=720
Hey!
I can not send more photos to your page can not be bothered with it? How do I send more photos?
Sincerely
Morgan Jonsson
I think that point and figure charts are not much different from Renko charts.
The first difference is : Renko boxes grow sidewards, point and figure boxes only up and down. But both have no defined time axis. You can make a Renko chart from a point and figure chart by adding each new box diagonally, instead of vertically.
The second difference (in most cases) is, that point and figure charts switch direction after at least three new boxes have been added in the opposite direction. In a Renko diagram, this happens normally after two boxes appear in the other direction. But we can as well take three or four boxes as the switching criterion.
If this is true, I think you can use my Renko automated trading system I recently posted to this site (http://www.prorealcode.com/prorealtime-trading-strategies/renko-automated-trading-system/). Just change the number of boxes needed to switch direction from 2 to 3. All other remarks I made there will also hold for point and figure charts, I think.
These would be the changes in line 23 and line 35 :
If (totalbricksup[1] = 0 OR totalbricksup[1] = 1) AND totalbricksup >= 3  then
   buysignal = 1
  endif


and
If (totalbricksdown[1] = 0 OR totalbricksdown[1] = 1) AND totalbricksdown >= 3  then
   shortsignal = 1
  endif
Let me know what you think.
Another difference between Renko and point and figure charts is, that in Renko charts a new box is also drawn in the opposite direction, when only 1 such new box appears. In point and figure charts, less than 3 boxes in the opposite direction are simply ignored. But his should make no difference for the trading system I posted.
Hey!
Thanks so much for your help! I have to back test the system but I am completely new to this and may not be running the test of the system.
Sincerely
Morgan Jonsson
I will post a complete trading system for point & figure charts as a new entry in the library. Please have a look there.
@verdi55
Strategy well received, but parameter “LowerBorderBox” is missing. Please tell me what is the right parameter to add, many thanks.
LowerBorderBox has no value to set externally. It is determined at each bar and is the lower boundary of the price box in which the current close falls. For example : Close = 10263, box size = 20, then : LowerBorderBox will be 10260. And the box ranges from 10260 to 10280. OK ?
Hmm.. maybe because I’m on leave or because I need a rest, but ProBacktest refuse compiling 🙂 and needs this variable defined!
Please attach here the ITF file, would be easier for me, thank you again verdi.
Sorry. I deleted one line too much. Before line 12 in the code I submitted, add the following :
LowerBorderBox = round((close / Boxsize) – 0.5) * Boxsize
Now it should work, I think.
I tried several times to add the itf file, but I always get the same error message : html upload error. What can I do ?
You mean add itf file here on forum? or if you are talking about the code submit form, this bug has been fixed today, sorry for inconvenience 🙁
Thanks for the missing line, it now works fine.
Here is the correct itf file. It has the variation of boxsize in the parameter optimization section.

