Help converting “Trend Following MAs 3D” Indicator from Trading View

Viewing 6 posts - 1 through 6 (of 6 total)
  • Author
    Posts
  • #166864 quote
    denmardenmar
    Participant
    Veteran

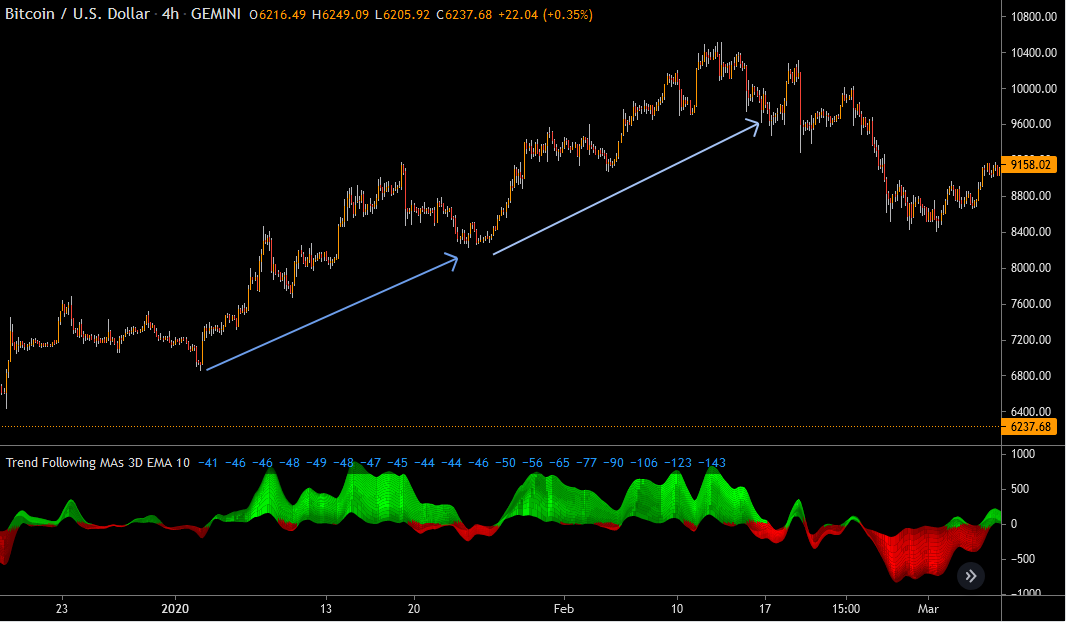
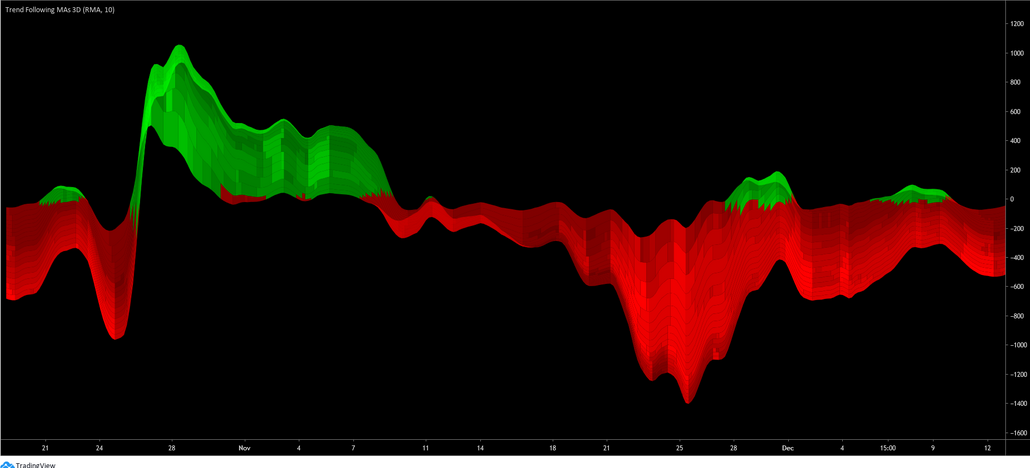
    I would be most grateful if somebody could please convert this indicator.

    It seems much more intuitive than the standard heatmap/spectrogram attempts to display changes occurring across multiple moving averages.

    Thank you

    Denmar

    study("Trend Following MAs 3D", precision=0)
    matype= input('EMA', title = "MA Type", options =['EMA', 'SMA', 'RMA', 'WMA', 'VWMA'])
    ulinreg = input(true, title = "Use Linear Regression")
    linprd = input(10, title = "Linear Regression Period", minval = 2)
    
    getma(len)=>
        _ret = matype == 'EMA' ? ema(close, len) : matype == 'RMA' ? rma(close, len) : matype == 'VWMA' ? vwma(close, len) : matype == 'WMA' ? wma(close, len) : sma(close, len)
        _ret := ulinreg ? linreg(_ret, linprd, 0) : _ret
        _ret
    
    p1 = getma(5) - getma(10)
    p2 = p1 + getma(10) - getma(15)
    p3 = p2 + getma(15) - getma(20)
    p4 = p3 + getma(20) - getma(25)
    p5 = p4 + getma(25) - getma(30)
    p6 = p5 + getma(30) - getma(35)
    p7 = p6 + getma(35) - getma(40)
    p8 = p7 + getma(40) - getma(45)
    p9 = p8 + getma(45) - getma(50)
    p10 = p9 + getma(50) - getma(55)
    p11 = p10 + getma(55) - getma(60)
    p12 = p11 + getma(60) - getma(65)
    p13 = p12 + getma(65) - getma(70)
    p14 = p13 + getma(70) - getma(75)
    p15 = p14 + getma(75) - getma(80)
    p16 = p15 + getma(80) - getma(85)
    p17 = p16 + getma(85) - getma(90)
    p18 = p17 + getma(90) - getma(95)
    p19 = p18 + getma(95) - getma(100)
    
    l1 = plot(p1, color = na)
    l2 = plot(p2, color = na)
    l3 = plot(p3, color = na)
    l4 = plot(p4, color = na)
    l5 = plot(p5, color = na)
    l6 = plot(p6, color = na)
    l7 = plot(p7, color = na)
    l8 = plot(p8, color = na)
    l9 = plot(p9, color = na)
    l10 = plot(p10, color = na)
    l11 = plot(p11, color = na)
    l12 = plot(p12, color = na)
    l13 = plot(p13, color = na)
    l14 = plot(p14, color = na)
    l15 = plot(p15, color = na)
    l16 = plot(p16, color = na)
    l17 = plot(p17, color = na)
    l18 = plot(p18, color = na)
    l19 = plot(p19, color = na)
    
    getwidth(a, b)=>
        t = abs(a - b)
        w = t * 10 / (highest(t, 200) - lowest(t, 200))
        w := max(w, 4)
        m = p1 > 0 ? p1 > nz(p1[1]) ? w > nz(w[1]) ? w + 1 : w - 1 : w > nz(w[1]) ? w - 3 : w - 2 : p1 < nz(p1[1]) ? w > nz(w[1]) ? -(w + 1) : -(w - 1) : w > nz(w[1]) ? -(w - 3) : -(w - 2)
        m
    
    getcolmult(trend)=>
        _ret = trend >= 10.0 ? #00FF00ff : trend >= 9.0 ? #00FF00ef : trend >= 8.0 ? #00FF00df : trend >= 7.0 ? #00FF00cf : trend >= 6.0 ? #00FF00bf :
           trend >= 5.0 ? #00FF00af : trend >= 4.0 ? #00FF009f : trend >= 3.0 ? #00FF008f : trend >= 2.0 ? #00FF007f : trend >= 1.0 ? #00FF006f :  
           trend <= -10.0 ? #FF0000ff : trend <= -9.0 ?  #FF0000ef : trend <= -8.0 ?  #FF0000df : trend <= -7.0 ?  #FF0000cf : trend <= -6.0 ?  #FF0000bf :
           trend <= -5.0 ?  #FF0000af : trend <= -4.0 ?  #FF00009f : trend <= -3.0 ?  #FF00008f : trend <= -2.0 ?  #FF00007f : trend <= -1.0 ?  #FF00006f :
           na
    
    getcol(p1, p2)=>
        m = getwidth(p1, p2)
       
        _ret = getcolmult(m)
        
    fill(l18, l19, color = getcol(p18, p19), transp = 0)
    fill(l17, l18, color = getcol(p17, p18), transp = 0)
    fill(l16, l17, color = getcol(p16, p17), transp = 0)
    fill(l15, l16, color = getcol(p15, p16), transp = 0)
    fill(l14, l15, color = getcol(p14, p15), transp = 0)
    fill(l13, l14, color = getcol(p13, p14), transp = 0)
    fill(l12, l13, color = getcol(p12, p13), transp = 0)
    fill(l11, l12, color = getcol(p11, p12), transp = 0)
    fill(l10, l11, color = getcol(p10, p11), transp = 0)
    fill(l9, l10, color = getcol(p9, p10), transp = 0)
    fill(l8, l9, color = getcol(p8, p9), transp = 0)
    fill(l7, l8, color = getcol(p7, p8), transp = 0)
    fill(l6, l7, color = getcol(p6, p7), transp = 0)
    fill(l5, l6, color = getcol(p5, p6), transp = 0)
    fill(l4, l5, color = getcol(p4, p5), transp = 0)
    fill(l3, l4, color = getcol(p3, p4), transp = 0)
    fill(l2, l3, color = getcol(p2, p3), transp = 0)
    fill(l1, l2, color = getcol(p1, p2), transp = 0)
    f1.png f1.png f2.png f2.png
    #166871 quote
    NicolasNicolas
    Keymaster
    Legend

    Added to my list.

    #167693 quote
    denmardenmar
    Participant
    Veteran

    Hi Nicolas,

    If this is proving to difficult I would willingly settle for just the lines without the colouration – just a suggestion.

    Thanks.

    #168157 quote
    denmardenmar
    Participant
    Veteran

    I would really appreciate it if somebody could have a look at the code and please transcribe the logic into english or (preferably) write the code for plotting the first line – I should be able to take it from there. Thanks in advance.

    #168352 quote
    NicolasNicolas
    Keymaster
    Legend

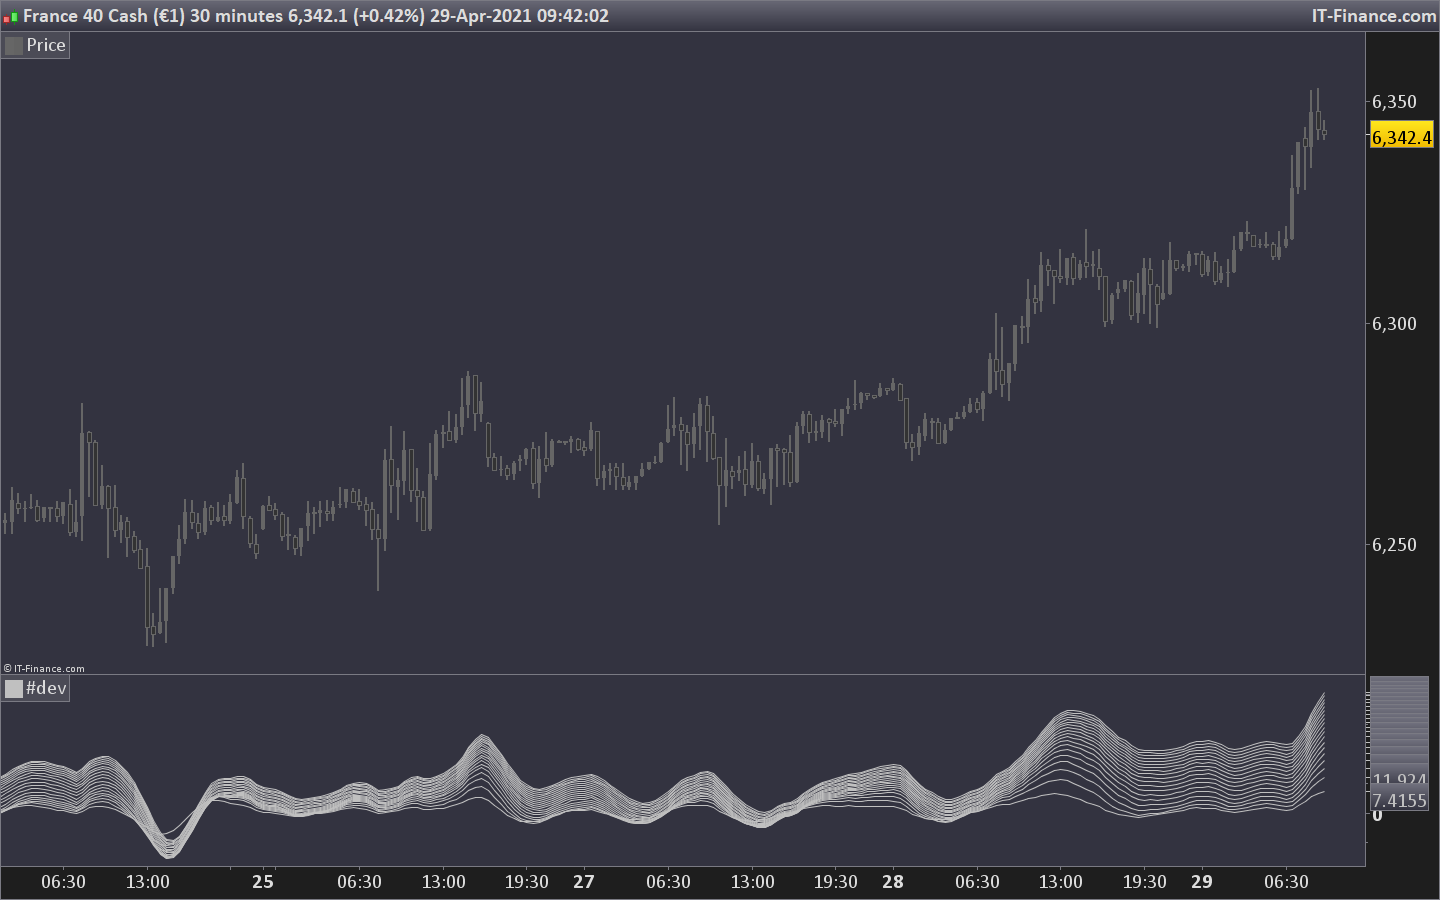
    easy part first, without the dynamic color between the curves:

    matype= 1 //0 = SMA 1 = EMA 2 = WMA 3 = Wilder 4 = Triangular 5 = End point 6 = Time series 7 = Hull (PRT v11 only) 8 = ZeroLag  (PRT v11 only)
    //ulinreg = 1 // Use Linear Regression
    linprd = 10 //Linear Regression Period
    
    p1 = linearregression[linprd](average[5,matype]) - linearregression[linprd](average[10,matype])
    p2 = p1+(linearregression[linprd](average[10,matype]) - linearregression[linprd](average[15,matype]))
    p3 = p2+(linearregression[linprd](average[15,matype]) - linearregression[linprd](average[20,matype]))
    p4 = p3+(linearregression[linprd](average[20,matype]) - linearregression[linprd](average[25,matype]))
    p5 = p4+(linearregression[linprd](average[25,matype]) - linearregression[linprd](average[30,matype]))
    p6 = p5+(linearregression[linprd](average[30,matype]) - linearregression[linprd](average[35,matype]))
    p7 = p6+(linearregression[linprd](average[35,matype]) - linearregression[linprd](average[40,matype]))
    p8 = p7+(linearregression[linprd](average[40,matype]) - linearregression[linprd](average[45,matype]))
    p9 = p8+(linearregression[linprd](average[45,matype]) - linearregression[linprd](average[50,matype]))
    p10 = p9+(linearregression[linprd](average[50,matype]) - linearregression[linprd](average[55,matype]))
    p11 = p10+(linearregression[linprd](average[55,matype]) - linearregression[linprd](average[60,matype]))
    p12 = p11+(linearregression[linprd](average[60,matype]) - linearregression[linprd](average[65,matype]))
    p13 = p12+(linearregression[linprd](average[65,matype]) - linearregression[linprd](average[70,matype]))
    p14 = p13+(linearregression[linprd](average[70,matype]) - linearregression[linprd](average[75,matype]))
    p15 = p14+(linearregression[linprd](average[75,matype]) - linearregression[linprd](average[80,matype]))
    p16 = p15+(linearregression[linprd](average[80,matype]) - linearregression[linprd](average[85,matype]))
    p17 = p16+(linearregression[linprd](average[85,matype]) - linearregression[linprd](average[90,matype]))
    p18 = p17+(linearregression[linprd](average[90,matype]) - linearregression[linprd](average[95,matype]))
    p19 = p18+(linearregression[linprd](average[95,matype]) - linearregression[linprd](average[100,matype]))
    
    return p1,p2,p3,p4,p5,p6,p7,p8,p9,p10,p11,p12,p13,p14,p15,p16,p17,p18,p19

    Note that due to lack of function capability of ProBuilder, I have set of the curve to use linear regression, while it was an option in the original code.

    trend-following-ma-3d.png trend-following-ma-3d.png
    #168361 quote
    denmardenmar
    Participant
    Veteran

    Thank you

Viewing 6 posts - 1 through 6 (of 6 total)
  • You must be logged in to reply to this topic.

ProRealAI ProRealAI New

Stuck on this ProBuilder code?

Describe what this topic is trying to build, in plain English, and ProRealAI writes the ProRealTime™ indicator, screener or system for you.

Available in 7 languages
Try ProRealAI

Help converting “Trend Following MAs 3D” Indicator from Trading View


ProBuilder: Indicators & Custom Tools

New Reply
Author
author-avatar
denmar @denmar Participant
Summary

This topic contains 5 replies,
has 2 voices, and was last updated by denmardenmar

5 years, 4 months ago.

Topic Details
Forum: ProBuilder: Indicators & Custom Tools
Language: English
Started: 04/12/2021
Status: Active
Attachments: 3 files
ProRealCode ProRealCode
Loading...