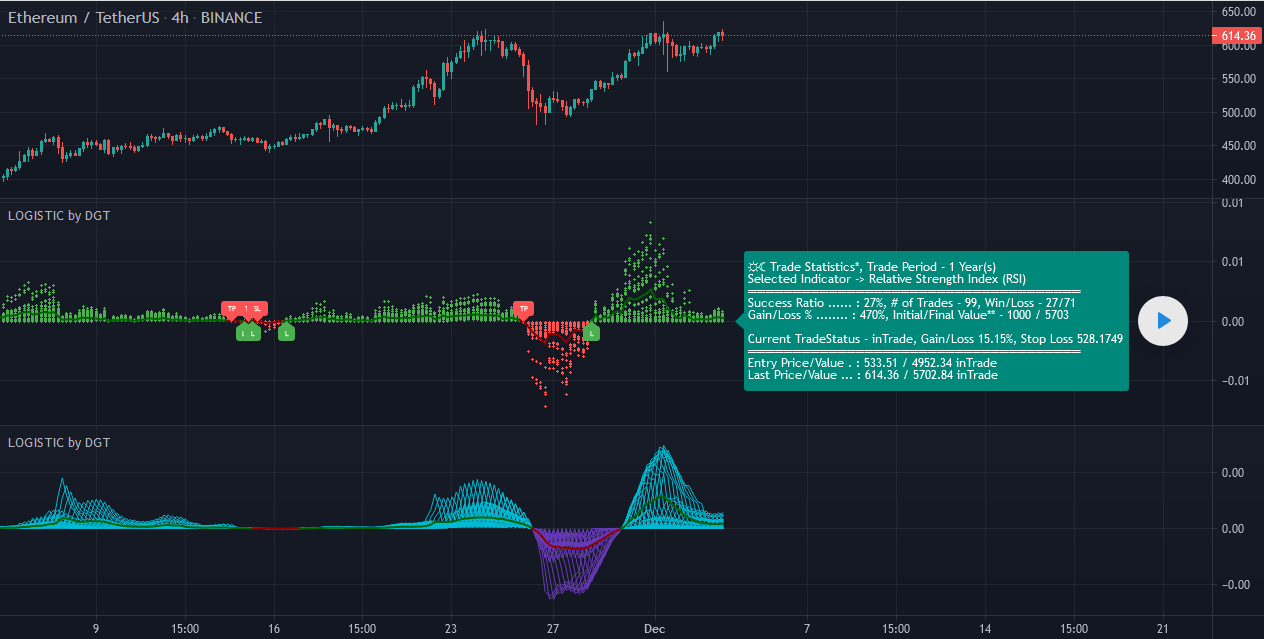
Please help converting this indicator.
(https://www.tradingview.com/script/NioHIxY1-Logistic-RSI-STOCH-ROC-AO-by-DGT/)
According to the author “The logistic map connects fluid convection, neuron firing, the Mandelbrot set and so much more.”
(https://www.tradingview.com/script/jUuBT0bO-Logistic-EMA-w-Signals-by-DGT/)
The original code includes RSI, Stochastics, ROC and OA (Awesome Oscillator) options. As the indicator name is not formalised it could be called the Logistic RSI for RSI version etc but if a more appropriate name can be proposed that’s fine. However it would be nice to have the other indicators as well. Maybe separate indicators or all in one with a generic name?
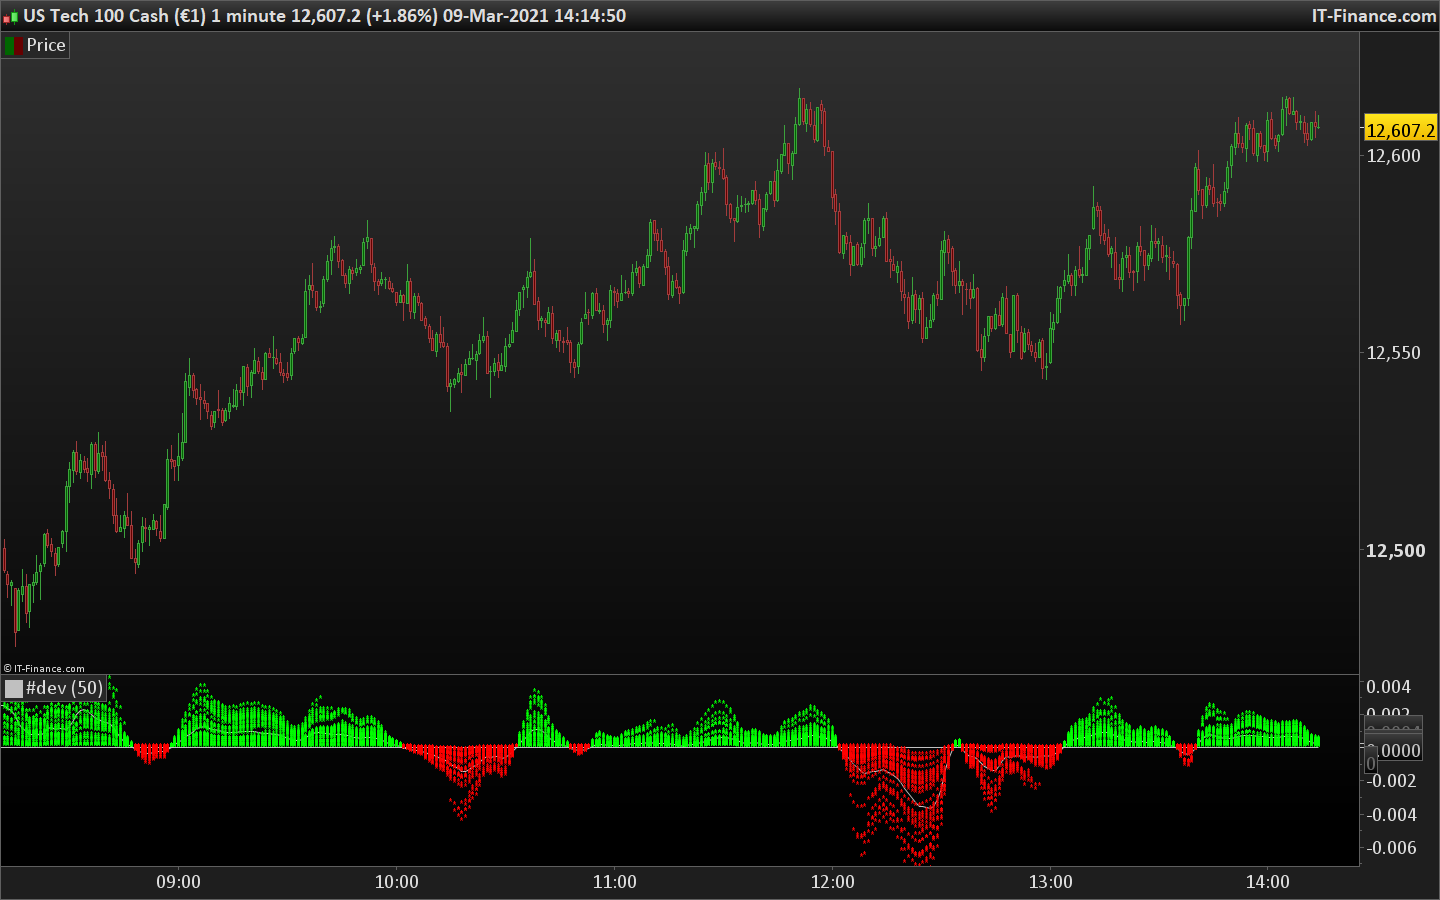
Several display options are available (see Attachments). I would prefer the contour-type of display.
Usage: Main form of usage is cross of the zero lie. Also possibly divergence.
Thank you.
// This source code is subject to the terms of the Mozilla Public License 2.0 at https://mozilla.org/MPL/2.0/
// © dgtrd

//@version=4
study("Logistic RSI, STOCH, ROC, AO, ... by DGT", shorttitle="LOGISTIC by DGT")//, resolution="")

ti         = input("Logistic Dominance", "Select Indicator", options = ["Awesome Oscillator (AO)", "Logistic Dominance", "Rate of Change (ROC)", "Relative Strength Index (RSI)", "Stochastic (STOCH)"])
source     = input(close,       "Source", input.source)
length     = input(13,          "Logistic Length", minval = 1)
d          = input(false,       "Only Standart Deviation Line of Array's Elements")
style      = input(false,       "Enable Line Plotting Style")
uC         = input(color.green, "Bullish Color", input.color)
dC         = input(color.red  , "Bearish Color", input.color)


isBackTest = input(false,       "═══════ ═ Backtest On/Off ═ ═══════")
dasCapital = input(1000.,       "Initial Capital")
lenBckTst  = input(1,           "Backtest Period (Year)", step = .25)
lblInOutSL = input(true,        "Show Entry/Take Profit(Exit)/Stop Loss Labels")

dummy      = input(true,        "═══════ ═ Optimization ═ ═══════")
srcInOut   = input(close,       "Source : Entry/Exit Price Assumption")
stopLoss   = input(1.,          "Stop Loss %", step=.1, minval = 0) / 100

lenLD      = input(5,           "Length : Logistic Dominance", minval = 1)
lenROC     = input(9,           "Length : Rate of Change (ROC)", minval = 1)
lenRSI     = input(14,          "Length : Relative Strength Index (RSI)", minval = 1)
lenSTO     = input(14,          "Length : Stochastic (STOCH)", minval = 1)

// Functions ════════════════════════════════════════════════════════════════════════════════════ //

f_logmap(_s, _r, _l) => _r * _s / highest(_l) * (1 - _s / highest(_l))

f_map(_s, _r, _v) =>
    mapeq = f_logmap(_s, _r, length)
    lmap = mapeq
    for i = 0 to 29
        array.push(_v,lmap)
        lmap := _r * abs(mapeq[i]) * (1 - mapeq[i])
    lmap

// -Calculations ════════════════════════════════════════════════════════════════════════════════ //

r = if ti == "Awesome Oscillator (AO)"
    sma(hl2, 5) / sma(hl2, 34) - 1
else if ti == "Logistic Dominance"
    -f_logmap(-source, change(source, lenLD) / source[lenLD], lenLD) - f_logmap(source, change(source, lenLD) / source[lenLD], lenLD)
else if ti == "Rate of Change (ROC)"
    change(source, lenROC) / source[lenROC]
else if ti == "Relative Strength Index (RSI)"
    rsi(source, lenRSI) / 100 - .5
else if ti == "Stochastic (STOCH)"
    stoch(source, high, low, lenSTO) / 100 - .5

var v = array.new_float(0)

val = f_map(source, r, v)
s = style ? 2 : 3

// -Plotting ════════════════════════════════════════════════════════════════════════════════════ //

plot(d ? na : val            , "Last Iteration", val >= 0             ? uC : dC, 1, s)
plot(d ? na : array.get(v,1 ), "2nd Iteration" , array.get(v,1 ) >= 0 ? uC : dC, 1, s)
plot(d ? na : array.get(v,2 ), "3rd Iteration" , array.get(v,2 ) >= 0 ? uC : dC, 1, s)
plot(d ? na : array.get(v,3 ), "4th Iteration" , array.get(v,3 ) >= 0 ? uC : dC, 1, s)
plot(d ? na : array.get(v,4 ), "5th Iteration" , array.get(v,4 ) >= 0 ? uC : dC, 1, s)
plot(d ? na : array.get(v,5 ), "6th Iteration" , array.get(v,5 ) >= 0 ? uC : dC, 1, s)
plot(d ? na : array.get(v,6 ), "7th Iteration" , array.get(v,6 ) >= 0 ? uC : dC, 1, s)
plot(d ? na : array.get(v,7 ), "8th Iteration" , array.get(v,7 ) >= 0 ? uC : dC, 1, s)
plot(d ? na : array.get(v,8 ), "9th Iteration" , array.get(v,8 ) >= 0 ? uC : dC, 1, s)
plot(d ? na : array.get(v,9 ), "10th Iteration", array.get(v,9 ) >= 0 ? uC : dC, 1, s)
plot(d ? na : array.get(v,10), "11th Iteration", array.get(v,10) >= 0 ? uC : dC, 1, s)
plot(d ? na : array.get(v,11), "12th Iteration", array.get(v,11) >= 0 ? uC : dC, 1, s)
plot(d ? na : array.get(v,12), "13th Iteration", array.get(v,12) >= 0 ? uC : dC, 1, s)
plot(d ? na : array.get(v,13), "14th Iteration", array.get(v,13) >= 0 ? uC : dC, 1, s)
plot(d ? na : array.get(v,14), "15th Iteration", array.get(v,14) >= 0 ? uC : dC, 1, s)
plot(d ? na : array.get(v,15), "16th Iteration", array.get(v,15) >= 0 ? uC : dC, 1, s)
plot(d ? na : array.get(v,16), "17th Iteration", array.get(v,16) >= 0 ? uC : dC, 1, s)
plot(d ? na : array.get(v,17), "18th Iteration", array.get(v,17) >= 0 ? uC : dC, 1, s)
plot(d ? na : array.get(v,18), "19th Iteration", array.get(v,18) >= 0 ? uC : dC, 1, s)
plot(d ? na : array.get(v,19), "20th Iteration", array.get(v,19) >= 0 ? uC : dC, 1, s)
plot(d ? na : array.get(v,20), "21st Iteration", array.get(v,20) >= 0 ? uC : dC, 1, s)
plot(d ? na : array.get(v,21), "22nd Iteration", array.get(v,21) >= 0 ? uC : dC, 1, s)
plot(d ? na : array.get(v,22), "23rd Iteration", array.get(v,22) >= 0 ? uC : dC, 1, s)
plot(d ? na : array.get(v,23), "24th Iteration", array.get(v,23) >= 0 ? uC : dC, 1, s)
plot(d ? na : array.get(v,24), "25th Iteration", array.get(v,24) >= 0 ? uC : dC, 1, s)
plot(d ? na : array.get(v,25), "26th Iteration", array.get(v,25) >= 0 ? uC : dC, 1, s)
plot(d ? na : array.get(v,26), "27th Iteration", array.get(v,26) >= 0 ? uC : dC, 1, s)
plot(d ? na : array.get(v,27), "28th Iteration", array.get(v,27) >= 0 ? uC : dC, 1, s)
plot(d ? na : array.get(v,28), "29th Iteration", array.get(v,28) >= 0 ? uC : dC, 1, s)
plot(d ? na : array.get(v,29), "30th Iteration", array.get(v,29) >= 0 ? uC : dC, 1, s)

array.remove(v, 0)
aStDev = sign(array.avg(v)) * array.stdev(v)
plot(aStDev, "Standard Deviation of Array's Elements", array.avg(v) >= 0 ? #006400 : #910000, 2)
array.clear(v)

// -BackTest ════════════════════════════════════════════════════════════════════════════════════ //

startBckTst  = time > timenow - lenBckTst * 31556952000

var inTrade    = false

if isBackTest

    var capital       = dasCapital
    var entryPrice    = 0.
    var exitPrice     = 0.
    var trades        = 0
    var win           = 0
    var loss          = 0

    crossover  = crossover (aStDev, 0)
    crossunder = crossunder(aStDev, 0)

    longCondition     = barstate.islast ? crossover [1] : crossover
    shortCondition    = barstate.islast ? crossunder[1] : crossunder

    stopLossCondition = inTrade ? close < entryPrice * (1 - stopLoss) : 0

    if startBckTst and longCondition and not inTrade
        entryPrice   := srcInOut
        inTrade      := true
        trades       := trades + 1

        if lblInOutSL
            label longLabel = label.new(bar_index, 0, text="L"
             ,tooltip="entry price  : " + tostring(entryPrice) + "\nentry value : " + tostring(capital, "#.##")
             ,color=color.green, style=label.style_label_up, textcolor=color.white, textalign=text.align_center, size=size.tiny)

if (shortCondition or stopLossCondition) and inTrade
        exitPrice    := srcInOut
        inTrade      := false
        capital      := capital * (exitPrice / entryPrice)

        if exitPrice > entryPrice
            win      := win  + 1
        else
            loss     := loss + 1

        if lblInOutSL
            txt = stopLossCondition ? "SL" : "TP"
            label shortLabel = label.new(bar_index, 0, text=txt
                 ,tooltip="change .......... : " + tostring((exitPrice / entryPrice - 1) * 100, "#.##") + "%\nentry/exit price : " + tostring(entryPrice) + " / " + tostring(exitPrice) + "\nnew capital ..... : " + tostring(capital, "#.##")
                 ,color=color.red, style=label.style_label_down, textcolor=color.white, textalign=text.align_center, size=size.tiny)


    var years         = (timenow - time) / 31556952000

    var yearsTxt      = ""
    var remarks       = ""

    if years < lenBckTst
        lenBckTst    := years
        yearsTxt     := tostring(lenBckTst, "#.##") + " Years***"
        remarks      := "\n\n*longs only\n**final value, if trade active displays estimated final value\n***max available data for selected timeframe : # of bars - " + tostring(bar_index)
    else
        yearsTxt     := tostring(lenBckTst, "#.##") + " Year(s)"
        remarks      := "\n\n*longs only\n**final value, if trade open displies estimated final value"

    inTradeTxt        = inTrade ? "inTrade" : "not inTrade"
    estimated         = inTrade ? capital * (close / entryPrice) : capital
    entryTxt          = inTrade ? tostring(entryPrice) : "not inTrade"
    lastTrdTxt        = inTrade ? ", Gain/Loss " + tostring((estimated/capital - 1) * 100, "#.##") + "%, Stop Loss " + tostring(entryPrice * (1 - stopLoss)) : ""

    tooltipTxt        = "entires/exits are calculated based on standard deviation value of array's elements (aStDev)\n -long entry, when aStDev > 0\n -take profit, when aStDev < 0\n -stop loss if last value falls by " + tostring(stopLoss * 100) + "% of entry price" + remarks


    label indiLabel   = label.new(time, 0
         ,text="☼  Trade Statistics*, Trade Period - " + yearsTxt +
          "\nSelected Indicator -> " + ti +
          "\n═════════════════════════════════════" +
          "\nSuccess Ratio ...... : " + tostring((win/trades)*100, "#") + "%" + ", # of Trades - " + tostring(trades) + ", Win/Loss - " + tostring(win) + "/" + tostring(loss) +
          "\nGain/Loss % ........ : " + tostring((estimated/dasCapital - 1) * 100, "#") + "%" + ", Initial/Final Value** - " + tostring(dasCapital) + " / " + tostring(estimated, "#") +
          "\n\nCurrent TradeStatus - " + inTradeTxt + lastTrdTxt +
          "\n═════════════════════════════════════" +
          "\nEntry Price/Value . : " + entryTxt + " / " + tostring(capital, "#.##") + " " + inTradeTxt +
          "\nLast Price/Value ... : " + tostring(close) + " / " + tostring(estimated , "#.##") + " " + inTradeTxt
         ,tooltip=tooltipTxt
         ,color=inTrade ? estimated/dasCapital > 1 ? color.teal : color.maroon : color.gray, xloc=xloc.bar_time, style=label.style_label_left, textcolor=color.white, textalign=text.align_left)

    label.set_x(indiLabel, label.get_x(indiLabel) + round(change(time)*3))
    label.delete(indiLabel[1])

bgcolor(isBackTest and startBckTst and startBckTst != startBckTst[1] ? color.blue : na)