Hi there,
Got this strategy from Trading View and it looks all right. As my program skills stopped in the 80’s with the C64, I was wondering if somebody could convert this Pine Script into prorealtime code cheers!
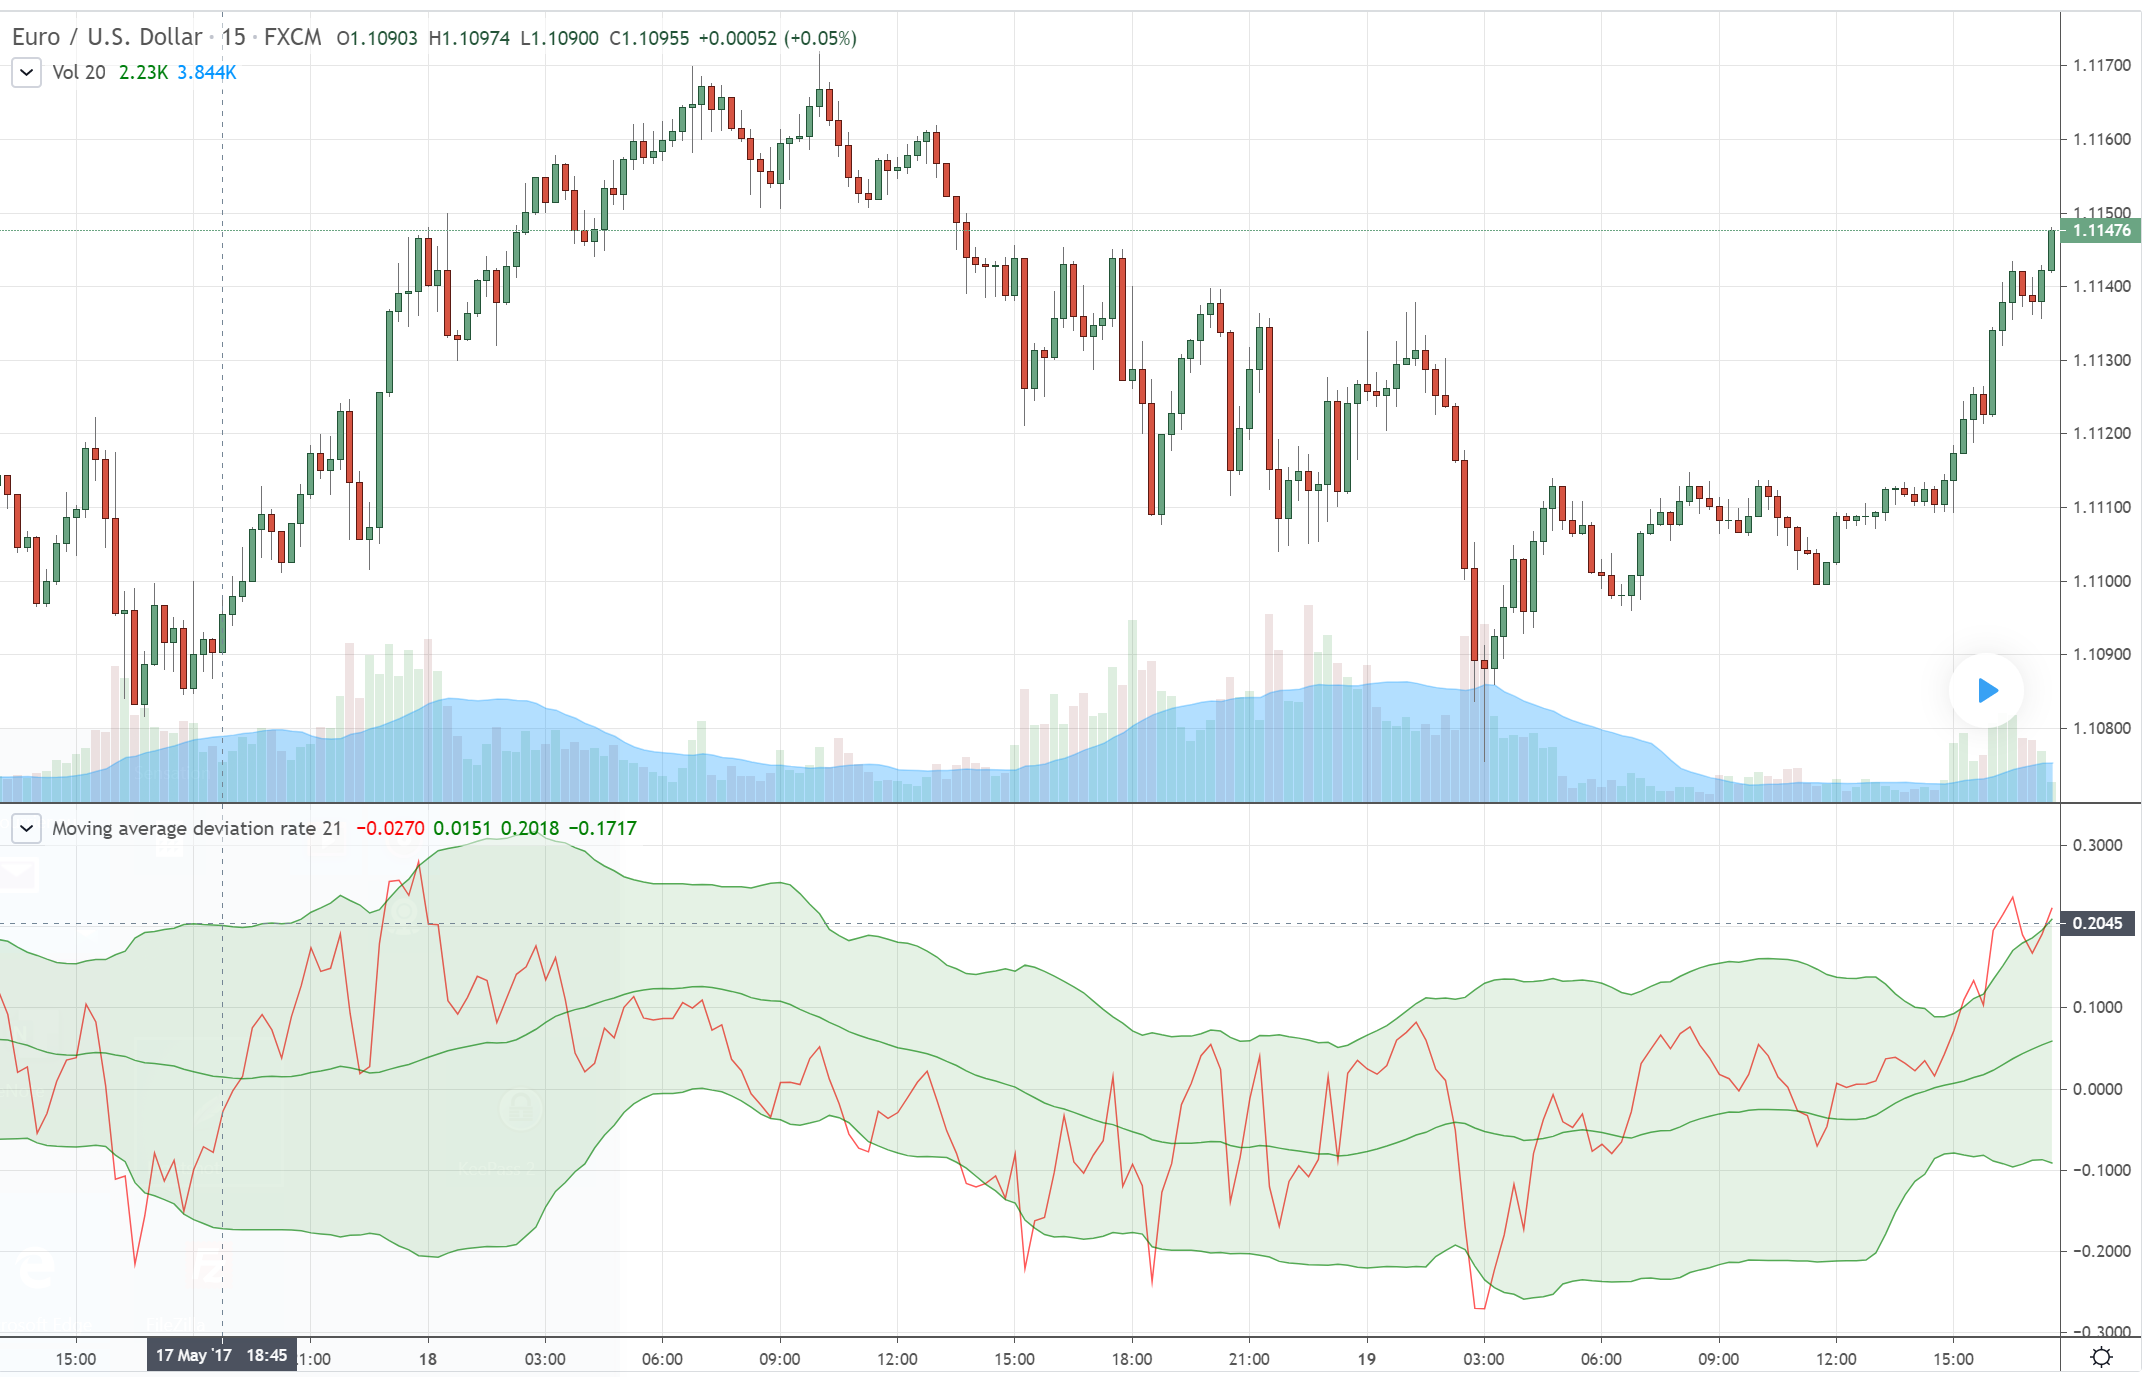
Moving average deviation rate
Simple moving average deviation rate and standard deviation.
The bollinger band is momentum value standard devition.
Bat the bollinger band is not normal distribution to close price.
Moving average deviation rate is normal distribution.
This indicator is draw Moving average deviation rate and fill area 2σ standard devition.
If it exceeds 2σ, it is a trading opportunity.
//@version=3
study(“Moving average deviation rate”, overlay=false)
//input
_maPeriod = input(21, title=”Moving average period”)
//deviation rate
_sma = sma(close, _maPeriod)
_rate = close / _sma * 100 – 100
//deviation rate std
_stdCenter = sma(_rate, _maPeriod * 2)
_std = stdev(_rate, _maPeriod * 2)
_plusDev = _stdCenter + _std * 2
_minusDev = _stdCenter – _std * 2
plot(_rate, color=red)
_plotCenter = plot(_stdCenter, color=green)
_plotPlus = plot(_plusDev, color=green)
_plotMinus = plot(_minusDev, color=green)
fill(_plotCenter, _plotPlus, color=green)
fill(_plotCenter, _plotMinus, color=green)
BITE1437 – Welcome to the forums.
Please follow the instructions found here (which can also be found under ‘Help’) when requesting a free code conversion:
https://www.prorealcode.com/free-code-conversion/
Please add all the missing information to this topic.
There are some simple rules that everyone using the forums is expected to follow. Your post has broken one or more of these rules.
The forum rules are as follows. I have highlighted in bold the rule/rules that you have not followed:
Post your topic in the correct forum.
ProRealTime Platform Support only platform related issues.
ProOrder only strategy topics.
ProBuilder only indicator topics.
ProScreener only screener topics
General Discussion any other topics.
Welcome New Members for new forum members to introduce themselves.
Only post in the language of the forum that you are posting in. For example English only in the English speaking forums and French only in the French speaking forums.
Always use the ‘Insert PRT Code’ button when putting code in your posts to make it easier for others to read.
Do not double post. Ask your question only once and only in one forum. All double posts will be deleted anyway so posting the same question multiple times will just be wasting your own time and will not get you an answer any quicker. Double posting just creates confusion in the forums.
Be careful when quoting others in your posts. Only use the quote option when you need to highlight a particular bit of text that you are referring to or to highlight that you are replying to a particular member if there are several involved in a conversation. Do not include large amounts of code in your quotes. Just highlight the text you want to quote and then click on ‘Quote’.
Give your topic a meaningful title. Describe your question or your subject in your title. Do not use meaningless titles such as ‘Coding Help Needed’.
Do not include personal information such as email addresses or telephone numbers in your posts. If you would like to contact another forum member directly outside of the forums then contact the forums administrator via ‘Contact Us’ and they will pass your details on to the member that you wish to contact.
Always be polite and courteous to others.
Have fun.
I have edited your post where required. Please ensure that your future posts meet these few simple forum rules. 🙂
This is not a strategy but an indicator. I added a picture to your post.
This is not a strategy but an indicator. You’ll find below the prorealtime code for the Moving Average Deviation Rate:
//Moving average deviation rate
//input
maPeriod = 21

//deviation rate
sma = average[maPeriod](close)
rate = close / sma * 100 - 100

//deviation rate std
stdCenter = average[maPeriod * 2](rate)
istd = std[maPeriod * 2](rate)
plusDev = stdCenter + istd * 2
minusDev = stdCenter - istd * 2

return rate coloured(255,0,0), stdcenter coloured(0,255,0), plusdev coloured(0,255,0), minusdev coloured(0,255,0)