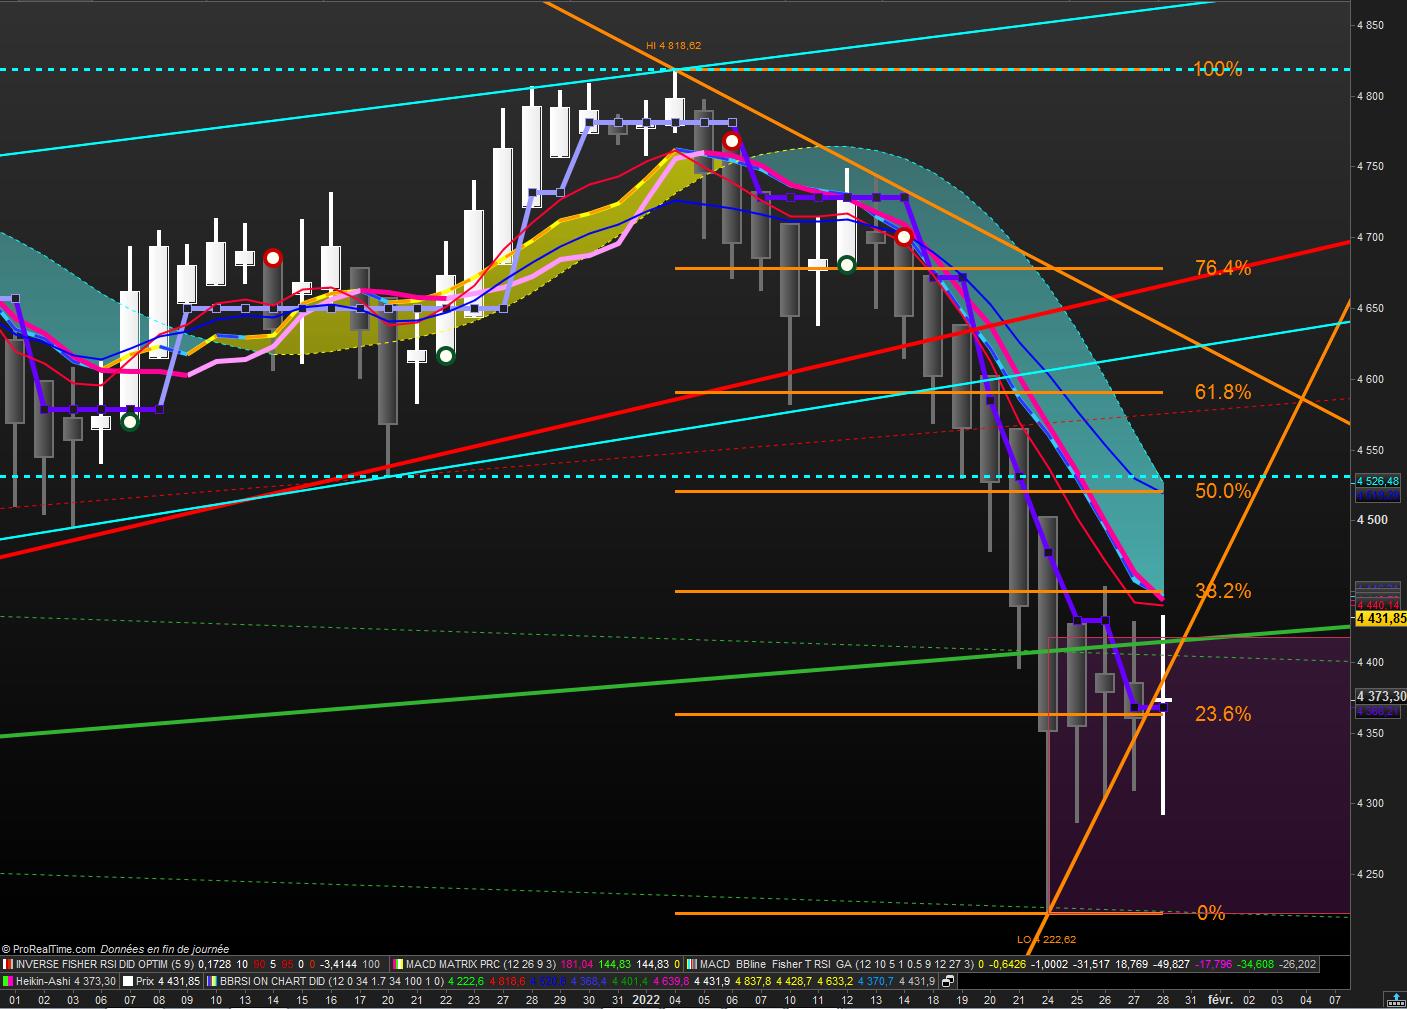
Orange : un bel exemple où le point marque bien le début de tendance.
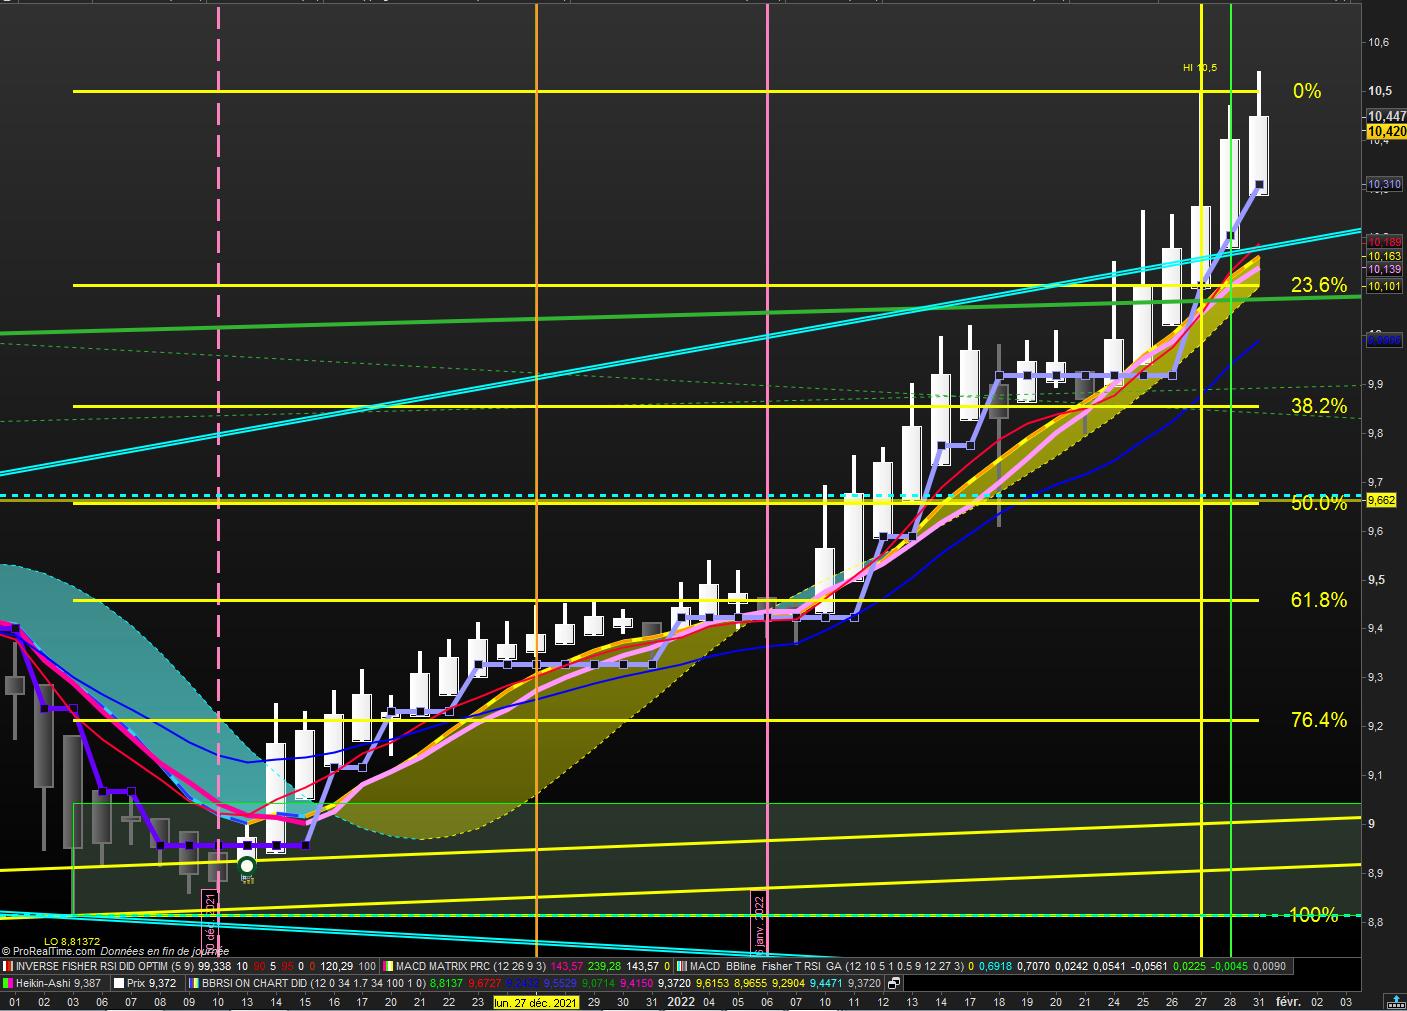
SP500 Après ce magnifique doji porteur d’eau on devrait avoir demain un beau point vert ?!
Pourquoi pas du MTF, mais je ne trade que les actions du SRD et quelques ETF. Avec mon horizon de trading je donne priorité au daily.
Je descend dans les unités inférieures juste quand j’achète ou vend.
Alors tu as les mains libres …
merci de ton aide.
Tu as d’autres critères tels que moyennes mobiles? Volumes? etc.
Les seuls critères de ce code me suffisent merci pour cette stratégie, j’ai déjà plus de 200 screeners et 800 indicateurs.
Tiens, essayes ça… je ne l’ai pas nettoyé, mais en principe ça fonctionne. Le résultat sera classé par RSI décroissant. Les signes devant le RSI >0 ou <0 indiquent le sens à trader.
green=0
red=0

xClose = (open+high+low+close)/4
IF BarIndex=0 THEN
xOpen = open
xHigh = high
xLow = low
ELSe
xOpen = (xOpen[1] + xClose[1])/2
xHigh = Max(Max(high, xOpen), xClose)
xLow = Min(Min(low, xOpen), xClose)
ENDIF
green = xopen<xclose and xlow=xopen
red   = xopen>xclose and xhigh=xopen
//greensum = summation[5](xClose > xOpen) >= 3
//redsum   = summation[5](xClose < xOpen) >= 3
////////////////////////////////////////////////////
lastpointx=0

if green and not green[1] then
lastpointx = 1
Direction = +1
IF lastpointx <> lastpointx[1] THEN
//drawpoint(barindex,baseUP,5) coloured (9,82,40,255) // green
ENDIF
elsif red and not red[1] then
lastpointx = -1
Direction = -1
IF lastpointx <> lastpointx[1] THEN
//drawpoint(barindex,baseDN,5) coloured(200,0,0,255)// red
ENDIF
endif

iRSI = round(rsi[14]*Direction,0)
// code proscreener d'exemple
SCREENER[lastpointx = 1 OR lastpointx = -1](iRSI as "RSI")
Bonjour Khaled
En daily sur le SRD j’ai 54 retours (50 affichés).Mais tous ces retours ne sont pas les “drawpoints” sur le dernier jour, exemple : Catana group, Bigben interactiv,axa,bains de mer etc …
d’autre part je ne vois pas les signes <> devant le rsi ? serais-je bigleux
merci de me dire
bonne journée
Et voilà nous avons bien notre signal su le SP500 comme annoncé hier
Bons trades à tous
Je viens de voir le classement selon le RSI, désolé.
A ton tour de m’aider un peu… Je ne trade que les indices, essentiellement Dow, SP500 et DAX. Quels sont tes top 3 indicateurs qui marchent bien en M30/H1?
Je l’ai pourtant essayé hier (mais seulement sur des indices, Brent et Gold) en M15, M30 et H1 et ça marchait correctement. Ensuite, tu peux avoir le signal qui s’affiche et qui disparait aussitôt lorsqu’il y a importante variation de prix dans la même bougie. La meilleure façon de vérifier et de voir si ton asset est toujours dans la liste du screener lorsque tu ne vois pas de signal.
RE-
Comme je suis radin je n’ai pas le temps réel ! (LOL). Tout simplement parce que ce n’est pas ma nature et mon horizon de placement.J’ai essayé c’est pas pour moi.
Cette année ça fera 42 ans que je suis sur les marchés financiers comme particulier, alors de bons indicateurs il y en a pléthore.
Le bon indicateur c’est celui que l’on maitrise (à peu près). chacun a sa vérité. C’est donc le travail et la discipline qui feront la différence, il n’y a pas de secret.
Comme piste j’ai construis au fil des années une moyenne mobile toute personnelle qui marche pas mal.
Difficile d’en extraire 3 sur la quantité, J’aime bien l’invers fisher transform et le vwap lissé sur plusieurs jours que j’ai redécouvert récemment .
les cycles de Hurst c’est pas mal non plus. etc etc
Si tu passes au sud de l’Espagne tu peux t’arrêter on pourra discuter autour d’une manzanilla
En séparant le screen en UP and DOWN on a la totalité du jour car l’affichage est limité à 50. Ainsi sur le SRD on a 39+15 = 54 … la totalité du jour
Pourtant le screener est a peaufiner pour afficher que les signaux de la dernière cotation.
// SCREENER KHALED UP  01.02.2022


green=0
//red=0

xClose = (open+high+low+close)/4
IF BarIndex=0 THEN
xOpen = open
//xHigh = high
xLow = low
ELSe
xOpen = (xOpen[1] + xClose[1])/2
//xHigh = Max(Max(high, xOpen), xClose)
xLow = Min(Min(low, xOpen), xClose)
ENDIF
green = xopen<xclose and xlow=xopen
//red   = xopen>xclose and xhigh=xopen
//greensum = summation[5](xClose > xOpen) >= 3
//redsum   = summation[5](xClose < xOpen) >= 3
////////////////////////////////////////////////////
lastpointx=0

if green and not green[1] then
lastpointx = 1
Direction = +1
IF lastpointx <> lastpointx[1] THEN
//drawpoint(barindex,baseUP,5) coloured (9,82,40,255) // green
ENDIF
//elsif red and not red[1] then
//lastpointx = -1
//Direction = -1
//IF lastpointx <> lastpointx[1] THEN
//drawpoint(barindex,baseDN,5) coloured(200,0,0,255)// red
ENDIF
//endif

iRSI = round(rsi[12]*Direction,0)
// code proscreener d'exemple
//SCREENER [lastpointx = 1 OR lastpointx = -1] (iRSI as "RSI")
SCREENER [lastpointx = 1 ] (iRSI as "RSI")
// SCREENER KHALED DW  01.02.2022


//green=0
red=0

xClose = (open+high+low+close)/4
IF BarIndex=0 THEN
xOpen = open
xHigh = high
//xLow = low
ELSe
xOpen = (xOpen[1] + xClose[1])/2
xHigh = Max(Max(high, xOpen), xClose)
//xLow = Min(Min(low, xOpen), xClose)
ENDIF
//green = xopen<xclose and xlow=xopen
red   = xopen>xclose and xhigh=xopen
//greensum = summation[5](xClose > xOpen) >= 3
//redsum   = summation[5](xClose < xOpen) >= 3
////////////////////////////////////////////////////
lastpointx=0

//if green and not green[1] then
//lastpointx = 1
//Direction = +1
//IF lastpointx <> lastpointx[1] THEN
//drawpoint(barindex,baseUP,5) coloured (9,82,40,255) // green
//ENDIF
if red and not red[1] then
lastpointx = -1
Direction = -1
IF lastpointx <> lastpointx[1] THEN
endif
endif
//drawpoint(barindex,baseDN,5) coloured(200,0,0,255)// red
//ENDIF
//endif

iRSI = round(rsi[12]*Direction,0)
// code proscreener d'exemple
//SCREENER [lastpointx = 1 OR lastpointx = -1] (iRSI as "RSI")
SCREENER [lastpointx = -1 ] (iRSI as "RSI")
J’aime les challenges… Peux-tu stp m’envoyer le lien sur le code d’origine de l’indicateur et je vais faire de mon mieux?
Tout est parti de là :
// CUL PLAT NICOLAS  07.01.2022

defparam CALCULATEONLASTBARS = 50

xClose = (open+high+low+close)/4
IF BarIndex=0 THEN
xOpen = open
xHigh = high
xLow = low
ELSe
xOpen = (xOpen[1] + xClose[1])/2
xHigh = Max(Max(high, xOpen), xClose)
xLow = Min(Min(low, xOpen), xClose)
ENDIF

green = xopen<xclose and xlow=xopen
red = xopen>xclose and xhigh=xopen
////////////////////////////////////////////////////
if green and not green[1] then
drawpoint(barindex,xlow,5) coloured (9,82,40) //(0,200,0)// green
elsif red and not red[1] then
drawpoint(barindex,xhigh,5) coloured(200,0,0)// red
endif
/////////////////////////////////////////////////OK
if  green > green [1] then
drawpoint(barindex,xlow,3) coloured (254,254,226) // jaune clair //(9,82,40) // green
elsif  red > red [1] then
drawpoint(barindex,xhigh,3) coloured (254,254,226) // jaune clair //(200,0,0)// red
endif
///////////////////////////////////////////////

/////////////////////////////////////////////////
 return

// DRAWCANDLE (Open[0],High[0],Low[0], Close[0] ) Coloured(0,0,0)Bordercolor(0,0,0)