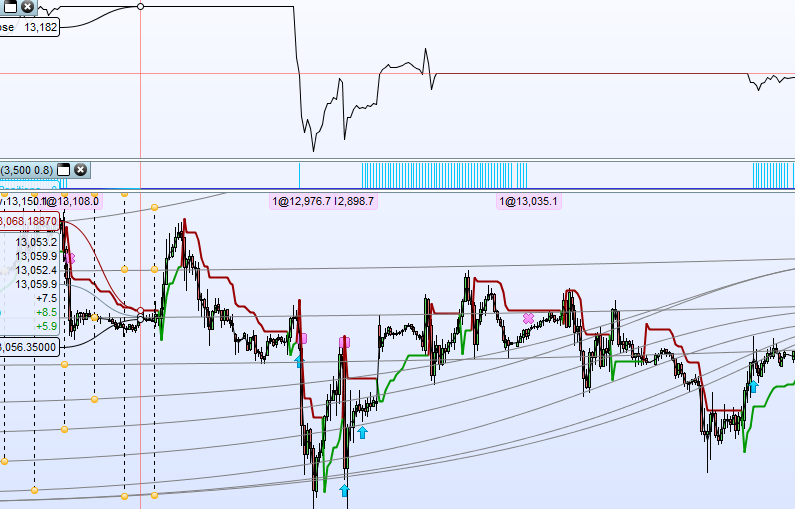
I was working on a strategy on a 30 minute chart and was using ‘GRAPH close’ along with graphing of one other value but noticed that sometimes the graphed result of close was flat-lining when the close price in the main chart was still clearly moving.
Image attached. I have removed the other variable for clarity.
Maybe trading closed at that time for that instrument?
It was on the DAX. I assumed that GRAPH Close will just pick up the same data as the chart it is attached to but it appears not.
There is something wrong in the code somewhere. Where is placed the GRAPH instruction? At the end of the program? Seems that GRAPH is activated when ONMARKET.
Very last line.
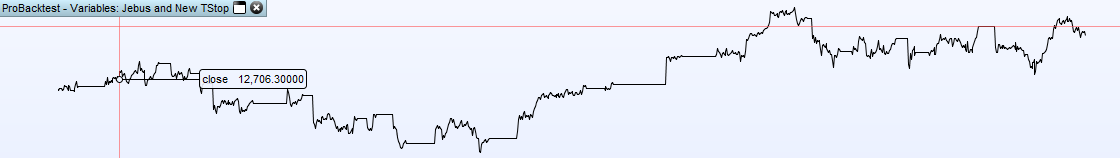
I did have some IF THEN conditions above it for calculating other graph lines but I have even removed them completely and just left GRAPH close at the very end of the code and I still get bit flat lines all over the place. Image attached.
I notice that some of the flat lines are just after a trade has closed but then other trades have closed and graph has continued to draw correctly.
Image attached.
I have zoomed in and I now can see that the close stops graphing always when in a trade (not at the close of it as I first thought) and then does not start again until a new trade is opened. GRAPH is the very last line in the code and is not within any IF THEN.
Never seen something like that before. Difficult to help without the code itself, and PRT guys will feel the same 😐
Check all divisions to be sure there are no ‘division by zero’ somewhere.
Here’s the code. I was just playing around with one of Jebus’s rough codes and trialling out a different style of trailing stop. Sorry there are a lot of // in it due to all the trial and error stuff.
// Created by JEBUS 05.01.2018
//Modified by Vonasi

DEFPARAM CumulateOrders = false

HighATR = 3500
Perc = 0.8
//ATRDivi = 3
//ATRMultiple = 6

//ATR1 = AverageTrueRange[HighATR]
//ATR2 = AverageTrueRange[HighATR/ATRDivi]
//x = MIN(ATR1, ATR2)*ATRMultiple

x = close * (perc/100)

Capital = 10000
Equity = Capital + StrategyProfit
PositionSize = Max(1, Equity * (1/Capital))
PositionSize = Round(PositionSize*100)
PositionSize = PositionSize/100

//PositionSize = 1

//Entry Conditions
indicator1 = WilderAverage[6](close)
indicator2 = TEMA[100](close)
c1 = (indicator1 CROSSES OVER indicator2)
indicator3 = WilderAverage[25](medianPrice)
indicator4 = WilderAverage[50](medianPrice)
c2 = (indicator3 < indicator4)

IF Not OnMarket and c1 AND c2 and BarIndex > HighATR THEN
BUY PositionSize CONTRACT AT MARKET
SL = Round(x)
//TP = Round(x)
ENDIF

IF OnMarket and TotalPrice < TotalPrice[1] THEN
SL = SL - ((TotalPrice[1] - TotalPrice))
//TP = TP - ((TotalPrice[1] - TotalPrice)*1)
//ELSE
//IF OnMarket and TotalPrice > TotalPrice[1] THEN
//SL = SL + ((TotalPrice[1] - TotalPrice))
//TP = TP + ((TotalPrice - TotalPrice[1]))
//ENDIF
ENDIF

// Conditions to exit long positions
indicator5 = WilderAverage[6](close)
indicator6 = TEMA[100](close)
c3 = (indicator5 CROSSES UNDER indicator6)

IF c3 THEN
SELL AT MARKET
ENDIF

IF SL = 0 THEN
SL = -1
ENDIF

//IF TP = 0 THEN
//TP = -1
//ENDIF

SET Stop pLoss SL
//SET Target pProfit TP

//Graph Calculations
IF OnMarket THEN
SLG = positionprice - SL
//TPG = tradeprice + TP
ELSE
IF Not OnMarket THEN
SLG = close
//TPG = close
ENDIF
ENDIF

//Graph TPG coloured(0,128,0)
Graph SLG coloured(128,0,0)
Graph Close
Solved it. The problem was the way you put stoploss with SET STOP PLOSS, it must be an absolute value:
SET Stop pLoss abs(SL)
OR with:
SET Stop pLoss max(0,SL)
Which leads us neatly onto my other post:
SET STOP pLOSS with negative value
I’m a little confused as the code works fine as a trailing stop loss with a negative value for SET STOP pLOSS but you are saying that it stops GRAPH from displaying the correct CLOSE value?
It throws an error somewhere in the system that prevent everything else to compute correctly .. that’s how I interpret it. When something goes weird with ProBacktest, look first at variables values, it usually solves everything! 🙂
Sorry to take up so much of your precious time but I just want to clarify my understanding of SET STOP PLOSS.
I’m thinking that it sends a market order to close a trade at a stop level x pips below your PositionPrice. At the close of each candle you can change the value of x and it sends a new order. If for example candle close is at a price of 2000, your PositionPrice is at 1000 and you set a negative value of -500 as your STOP pLOSS then the stop order is set at 1500. This all seems to work fine when I run the code but the GRAPH function is completely confused by these values.
I guess at the end of the day I’ll just have to give up on my new find of SET STOP pLOSS with negative values and go back to SELL STOP orders which will achieve the same thing.
Even if you can code it, it doesn’t mean that the order will be accepted by the broker server. SET STOP is not meant to accept negative value.
Of course, the probacktest bug you encountered should not exist. I’ll send an email to IT Finance about it.
OK – good point. I have posted a question on the other thread at
https://www.prorealcode.com/topic/set-stop-ploss-with-negative-value/
Sorry to be jumping around!