Hi everyone,
I’m using the Halftrend Triple I founded here on PRC.
I noticed that when I copy the code in a EA, there are some differencies between the value of the halftrend with identical parameters .
Sometimes they are the same, sometimes not.
Do you have any explanation on it ?
Thanks !
amplitude2 = 60
lowpricei1 = Lowest[Amplitude1](low)
highpricei1 = Highest[Amplitude1](high)
lowma1 = average[Amplitude1](low)
highma1 = average[Amplitude1](high)

if barindex>Amplitude1 then

if(nexttrend1=1) then

maxlowprice1=Max(lowpricei1,maxlowprice1)

if(highma1<maxlowprice1 and Close<Low[1]) then
trend1=1.0
nexttrend1=0
minhighprice1=highpricei1
endif

endif

if(nexttrend1=0) then

minhighprice1=Min(highpricei1,minhighprice1)

if(lowma1>minhighprice1 and Close>High[1]) then
trend1=0.0
nexttrend1=1
maxlowprice1=lowpricei1
endif

endif

if(trend1=0.0) then

if(trend1[1]<>0.0) then
up1=down1[1]
else
up1=Max(maxlowprice1,up1[1])
endif
down1=0.0

else

if(trend1[1]<>1.0) then
down1=up1[1]
else
down1=Min(minhighprice1,down1[1])
endif
up1=0.0
endif

endif

if up1>0 then
halftrend1 = up1
color1 = 1
else
halftrend1 = down1
color1 = -1
endif
Hi, welcome to PRC forums, I’m moving your post from French forum “Support ProOrder” to English forum “ProOrder support”, as the custom on PRC forums is to use the language of the forum we post in
Please share your automatic strategy code in order to understand why it happened and to replicate the issue.
Hello Nicolas,
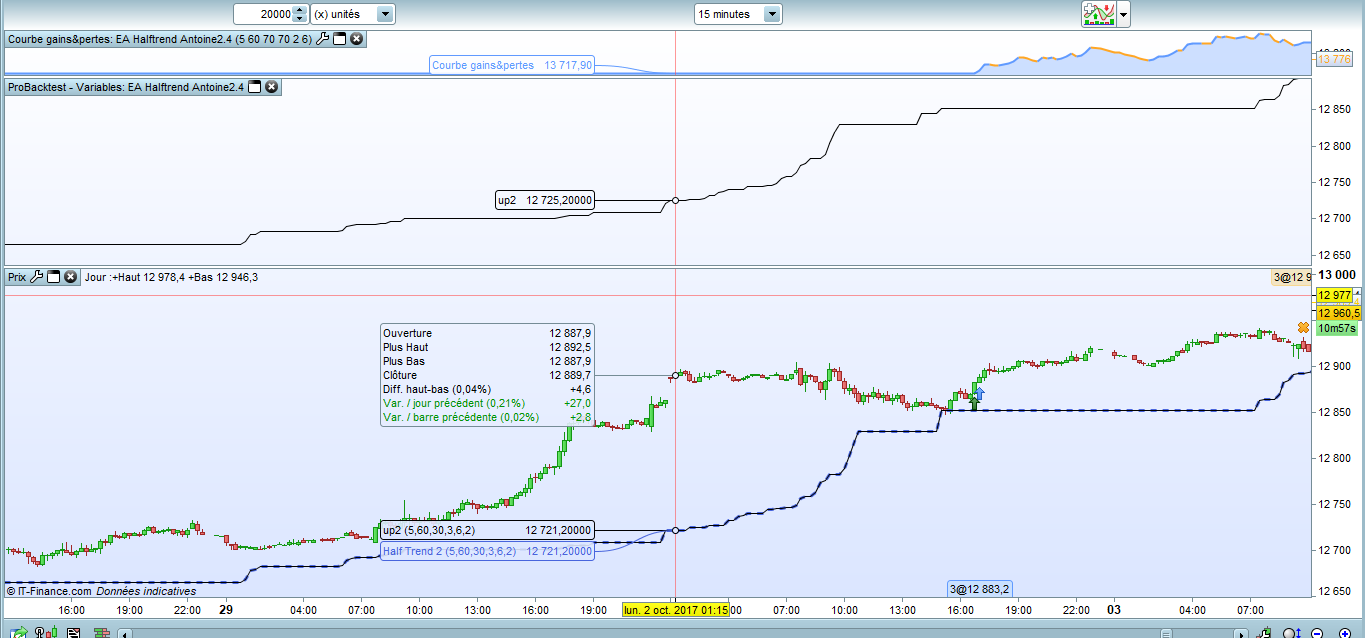
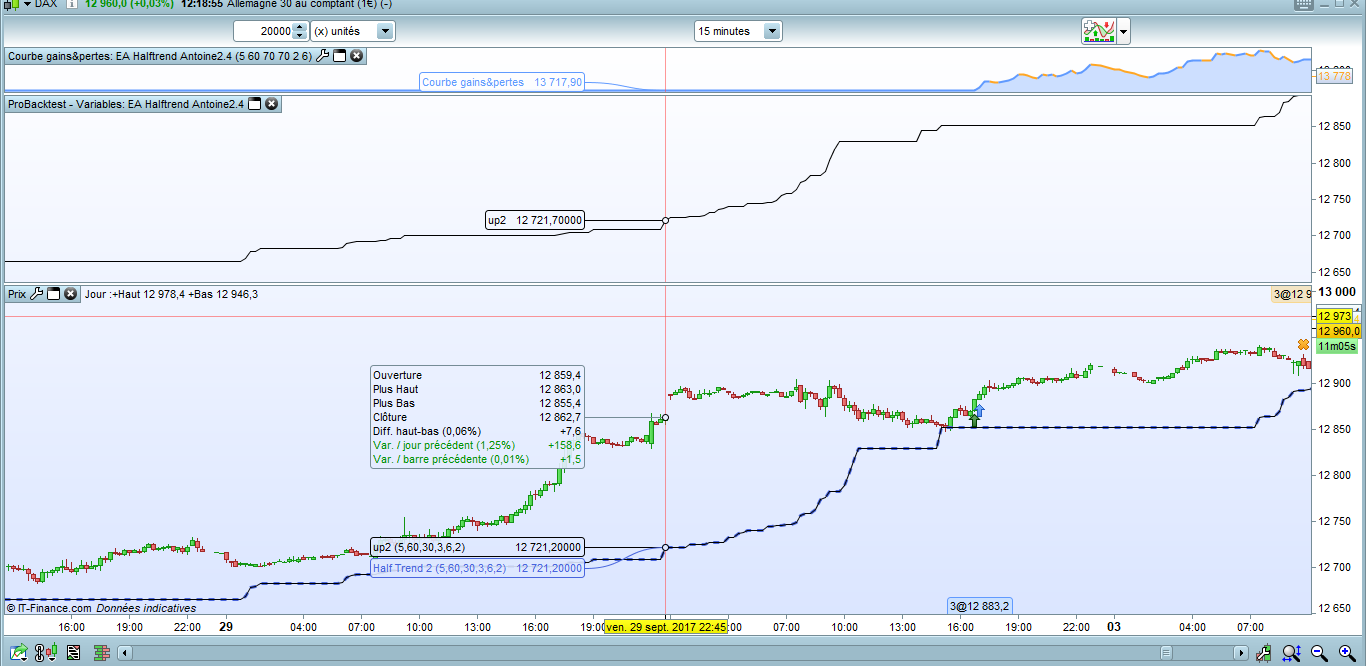
here is the code, I use it on dax M15, I noticed a difference between Halftrend 10 on EA and Indicator, on october 9th 2017 at 6am for example (halftrend10 graph by EA = 12976,9 ; halftrend10 on indicator= 12 975,1)
Amplitude1 = 10
Amplitude2 = 60

N=3
////////////////////////////////////////
//HL #1

lowpricei1 = Lowest[Amplitude1](low)
highpricei1 = Highest[Amplitude1](high)
lowma1 = average[Amplitude1](low)
highma1 = average[Amplitude1](high)

if barindex>Amplitude1 then

if(nexttrend1=1) then

maxlowprice1=Max(lowpricei1,maxlowprice1)

if(highma1<maxlowprice1 and Close<Low[1]) then
trend1=1.0
nexttrend1=0
minhighprice1=highpricei1
endif

endif

if(nexttrend1=0) then

minhighprice1=Min(highpricei1,minhighprice1)

if(lowma1>minhighprice1 and Close>High[1]) then
trend1=0.0
nexttrend1=1
maxlowprice1=lowpricei1
endif

endif

if(trend1=0.0) then

if(trend1[1]<>0.0) then
up1=down1[1]
else
up1=Max(maxlowprice1,up1[1])
endif
down1=0.0

else

if(trend1[1]<>1.0) then
down1=up1[1]
else
down1=Min(minhighprice1,down1[1])
endif
up1=0.0
endif

endif

if up1>0 then
halftrend1 = up1
color1 = 1
else
halftrend1 = down1
color1 = -1
endif

/////////////////////////////////////////////////////

// -- HL #2
lowpricei2 = Lowest[Amplitude2](low)
highpricei2 = Highest[Amplitude2](high)
lowma2 = average[Amplitude2](low)
highma2= average[Amplitude2](high)

if barindex>Amplitude2 then

if(nexttrend2=1) then

maxlowprice2=Max(lowpricei2,maxlowprice2)

if(highma2<maxlowprice2 and Close<Low[1]) then
trend2=1.0
nexttrend2=0
minhighprice2=highpricei2
endif

endif

if(nexttrend2=0) then

minhighprice2=Min(highpricei2,minhighprice2)

if(lowma2>minhighprice2 and Close>High[1]) then
trend2=0.0
nexttrend2=1
maxlowprice2=lowpricei2
endif

endif

if(trend2=0.0) then

if(trend2[1]<>0.0) then
up2=down2[1]
else
up2=Max(maxlowprice2,up2[1])
endif
down2=0.0

else

if(trend2[1]<>1.0) then
down2=up2[1]
else
down2=Min(minhighprice2,down2[1])
endif
up2=0.0
endif

endif

if up2>0 then
halftrend2 = up2
color2 = 1
else
halftrend2 = down2
color2 = -1
endif


//////////////////////////////////////////////////////////
////////////// CONDITIONS ENTREE LONG  ///////////////////
//////////////////////////////////////////////////////////


IF (up2 > 0 and down1[1] > 0 and up1 > 0) OR(up1 > 0 and down2[1] >0 and up2 > 0) then

Buy N contract at market
Set stop ploss 50
ENDIF


IF color1 then
ENDIF
IF color2 then
ENDIF


//////////////////////////////////////////////////////////
////////////// CONDITIONS SORTIE LONG  ///////////////////
//////////////////////////////////////////////////////////
IF longonmarket then
iF halftrend1[1] > halftrend1 then
Sell at market
ENDIF
ENDIF

GRAPH HAlftrend1
GRAPH HAlftrend2
This is odd, cause I don’t notice any differences between the Halftrend indicator and the one embedded into your strategy … Are you sure you are comparing the same periods?
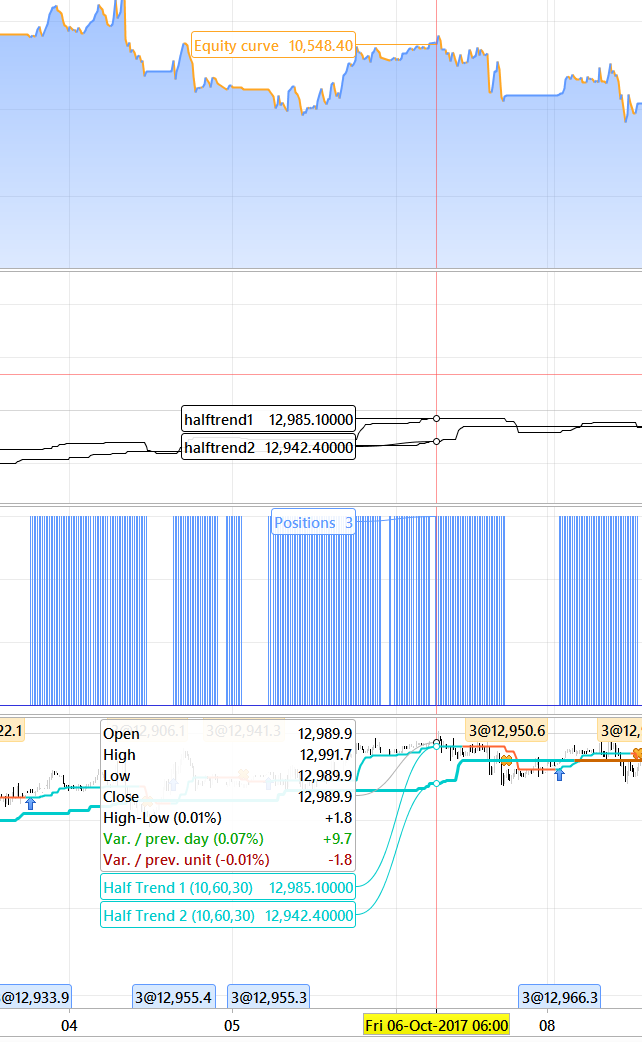
Did you try on M15, GER30, 9 October 2017 at 6:00 am ? these are not exactly the same for me.
95% of the time these are the same, but the 5% where these differs make difference between arrow (entry) in my Indicator and real entry in proOrder.
Maybe you have the optional setting of not using weekend data? And any monday morning data based on calculations from friday’s data in the indicator, might differ from the backtest on PRT server using weekend data (even if you chose not to on your pc)? Had a similar thing long ago and that’s when Nicolas told me about this weekend data option not affecting backtest run on PRT servers but only indicators on PC…
Thank’s Noobywan. Actually I thought about this possibility, and I remember I tried with and without weekend datas but I didn’t change. the value are identical (unless for the date I’m a comparing).
Whatever I’m pretty sure that value overnight and weekend are commited to these differencies in value..
Not in the EA, and here are the settings in PRT
Quel est ton courtier ? IG ?
Bonjour Nicolas, oui je suis chez IG, mais j’effectue ces backtest sur PRT CFD.
Je pense que le problème est résolu, c’était bien l’histoire de données du week-end qu’il fallait activer, j’avais du me planter en essayant des réglages..
Une fois les données activée pour le weekend je n’ai plus de Gap entre le vendredi soir et le lundi matin, j’ai maintenant une bougie. Dans le Backtest elle devait bien être prise en compte, mais pas dans l’indicateur qui considérait un gap.
Merci pour votre aide !
Yellow card to Nicolas (haha! How did I miss this) for switching the conversation to French in the English forum!
OMG too much or not enough coffee! 😆