Maz
MazParticipant
Veteran
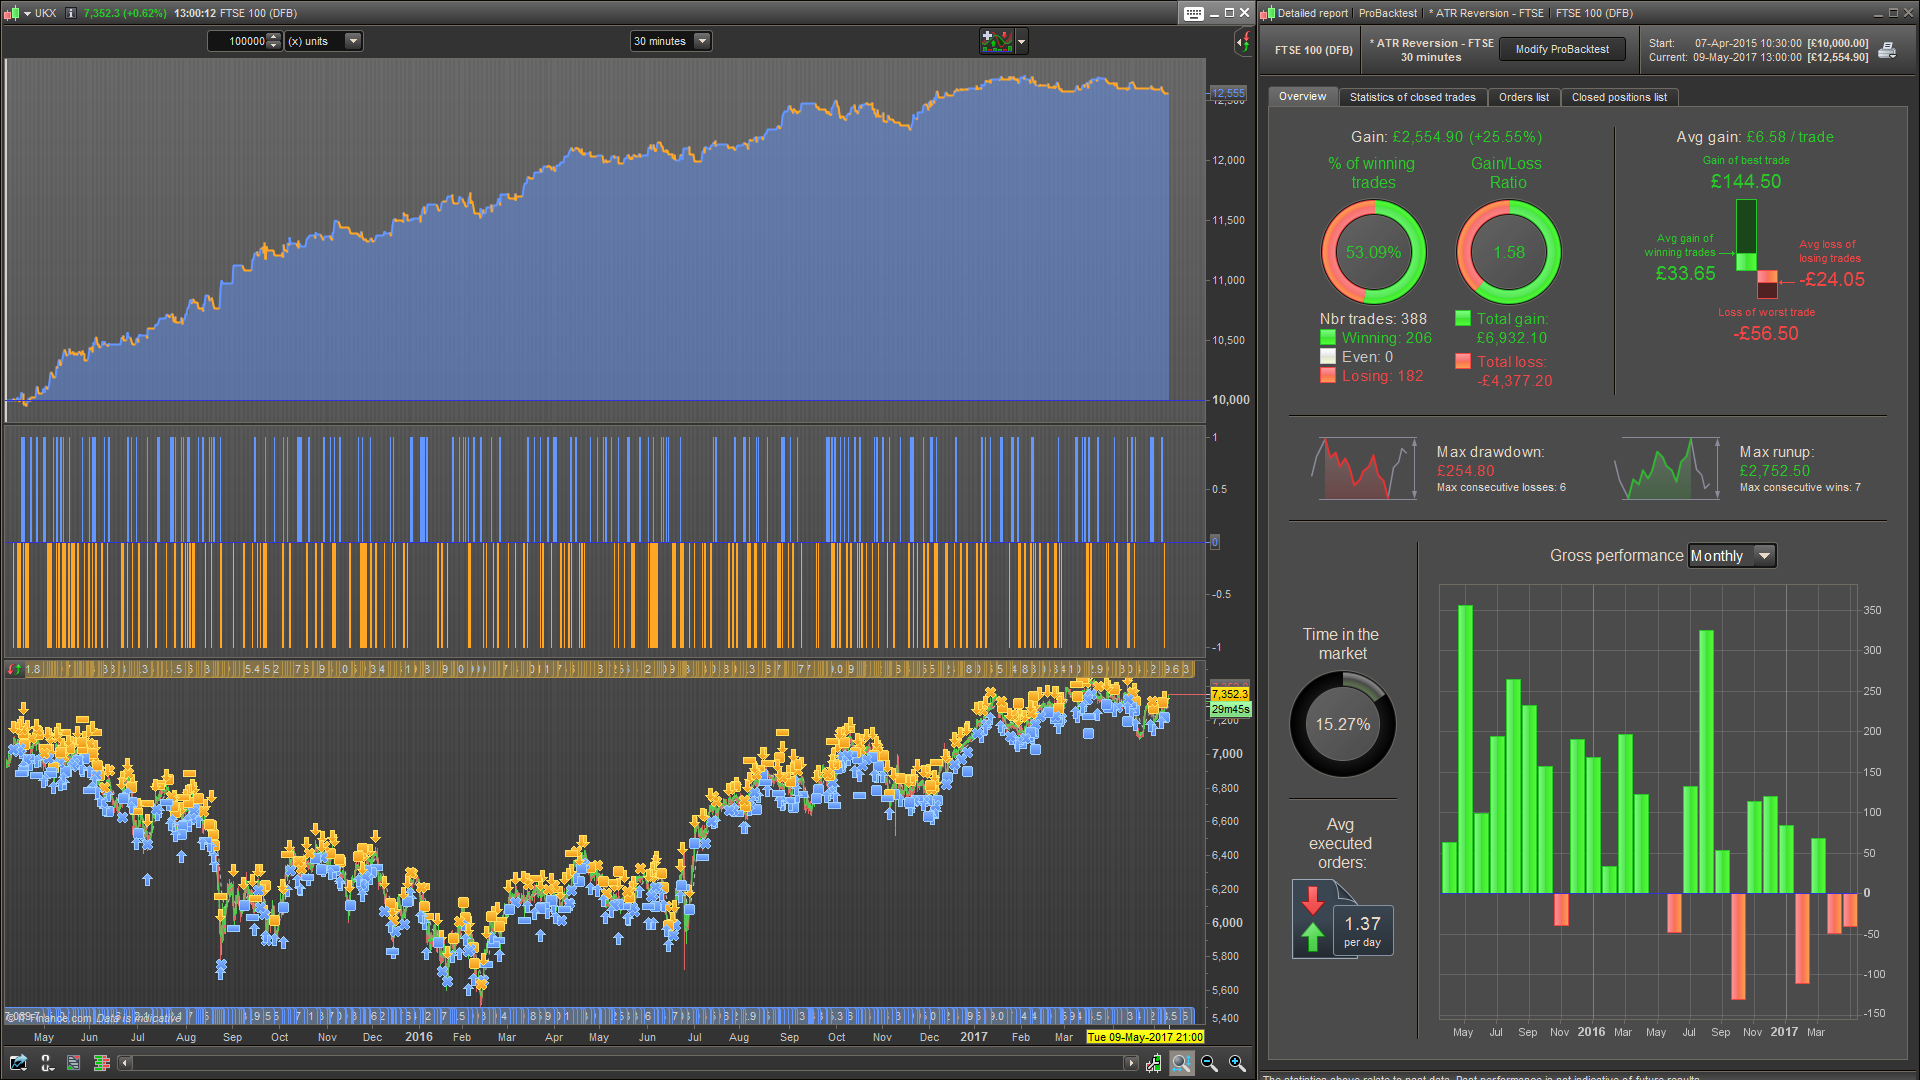
@GDKLockout (thank you and welcome) posted a strategy to the library here. Unfortunately the back test did not take spread into account so ignore the equity curve.
I’ve started a topic on this here in case the system has some potential once coded properly; was hoping to get a few ideas going.
Here’s a basic framework to get started on. There are pretty much no filters, no funky stop or limit mechanisms; just variable optimization work. Separated long and short components into different optimizations. Spread set to 1.
// ATR based Reversion
// Maz @ prorealcode.com | GDKLockout @ prorealcode.com
// Questions: prtmaz at gmail dot com
// Version 0.22

DEFPARAM CumulateOrders = False
DEFPARAM FLATBEFORE = 080000
DEFPARAM FLATAFTER = 210000

// Constants
once positionSize = 1
once optimization = 1

// Variable optimization sets
if optimization = 1 then // FTSE M39
startTime = 080000
endTime = 210000
tradingTime = time >= startTime and time < endTime

atrPeriodLong = 13 //12
atrPeriodShort = 20 //12

atrMultipleLong = 2
atrMultipleShort = 2

rangeWinMultLong = 1.6 // 2.5
rangeWinMultShort = 2.1 // 2.5
elsif optimization = 2 then

endif

// -- Indicators & functions -----
upBar = close > open
dnBar = close < open
bodyRange = abs(open-close)

atrLong = AverageTrueRange[atrPeriodLong]
atrThreshLong = (atrLong * atrMultipleLong)
barAtThreshLong = bodyRange > atrThreshLong

atrShort = AverageTrueRange[atrPeriodShort]
atrThreshShort = (atrShort * atrMultipleShort)
barAtThreshShort = bodyRange > atrThreshShort

// -- Entry Condition logic -----
bc = tradingTime
bc = bc and barAtThreshLong and dnBar

sc = tradingTime
sc = sc and barAtThreshShort and upBar

// -- Execution logic -----
if bc then
buy positionSize shares at market
SET STOP pLOSS bodyRange
bcTarget = (bodyRange*rangeWinMultLong)*pipsize
SET TARGET pPROFIT bcTarget

elsif sc then
sellshort positionSize shares at market
SET STOP pLOSS bodyRange
scTarget = (bodyRange*rangeWinMultShort)*pipsize
SET TARGET pPROFIT scTarget
endif
ITF attached
Let’s get filtering 🙂
Hi Maz,
Thank you so much for your interest and effort in helping with this.
I can explain the theory behind how I traded this strategy manually if you think it would help. I wasn’t using any indicators at all and just introduced the atr as a measurement for the purpose of trying to automate this. I also used my own support and resistance lines as confirmation, but have no idea how to write this into the code.
Just to note: In my back test i did set the spread to 1, I just double checked this too.
I was wondering if you could please explain the following bits of code in layman’s terms to help me under stand the changes you made, I will explain what i think you mean.
atrPeriodLong = 13
atrPeriodShort = 20
Do you mean you have adjusted the strategy to have a atr of 13 for longs and 20 for shorts instead of the 12 standard?
rangeWinMultLong = 1.6
rangeWinMultShort = 2.1
Again is this an adjustment to the targets instead of my 2.5*body?
Is the above two examples of optimization, as in playing around with the numbers to get better results?
bcTarget = (bodyRange*rangeWinMultLong)*pipsize
what does the *pipsize part do here?
thanks in advance, and I apologize for what must seem like infantile questions.
Regards
GDK
MazParticipant
Veteran
Hi,
Apologies on the spread comment. My mistake.
To answer your questions in order: yes, yes and yes. You are correct on all. “*pipsize” takes care of those who are quoted a pip with sizes other than 1
Please could you elaborate on what support/resistance lines you were looking at and what the rules around them were? State the rules in English and I’ll see if I can take care of the code.
Hi.
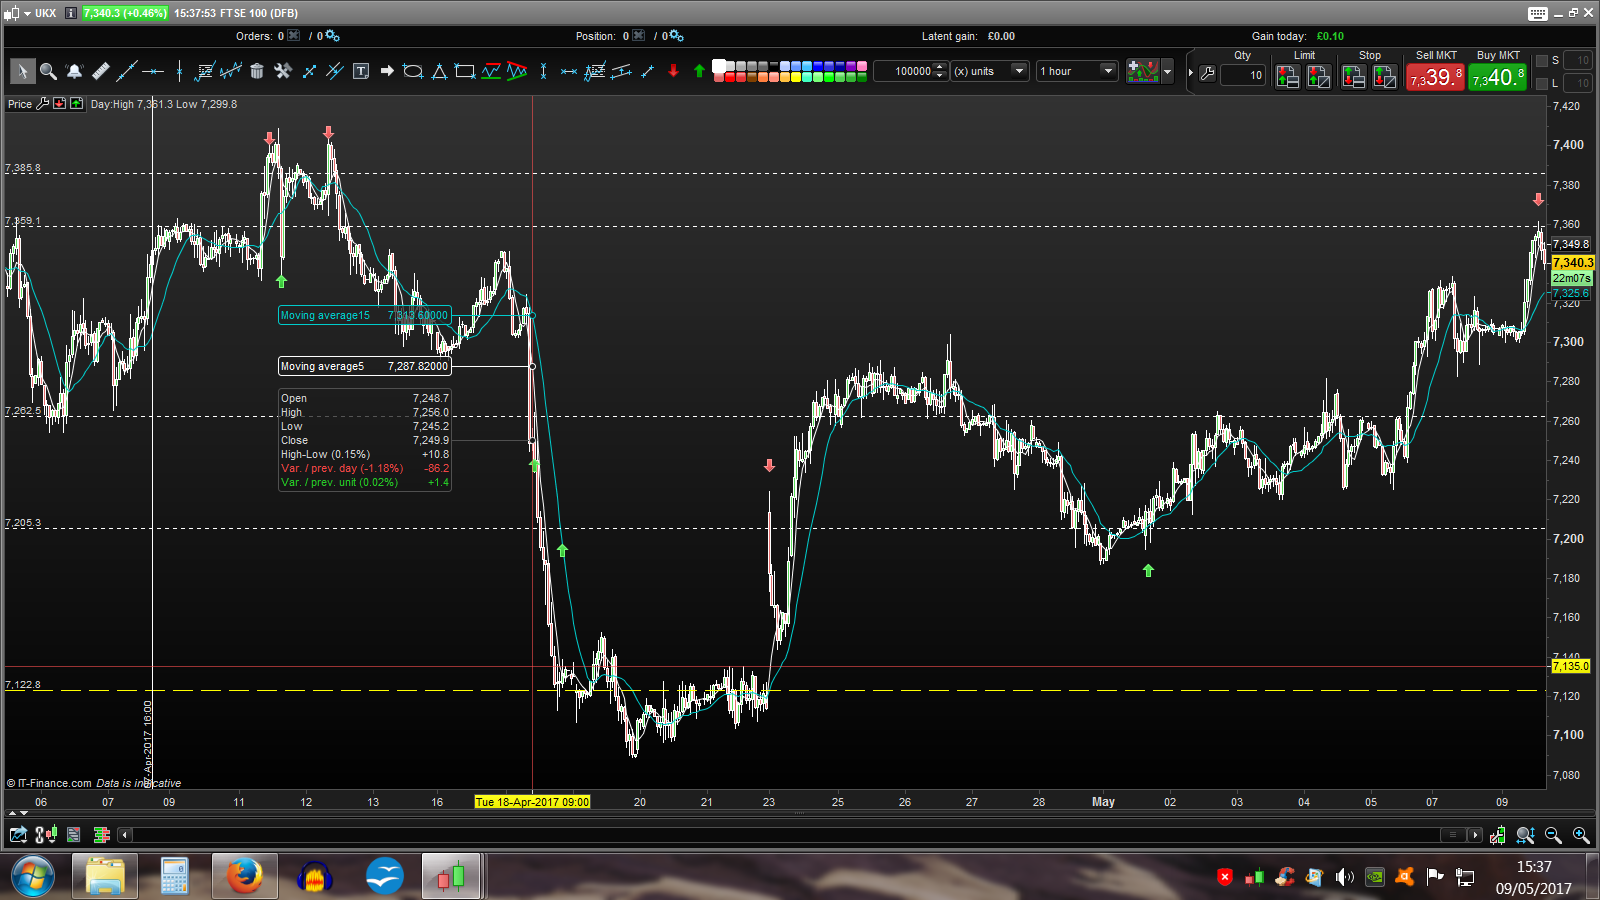
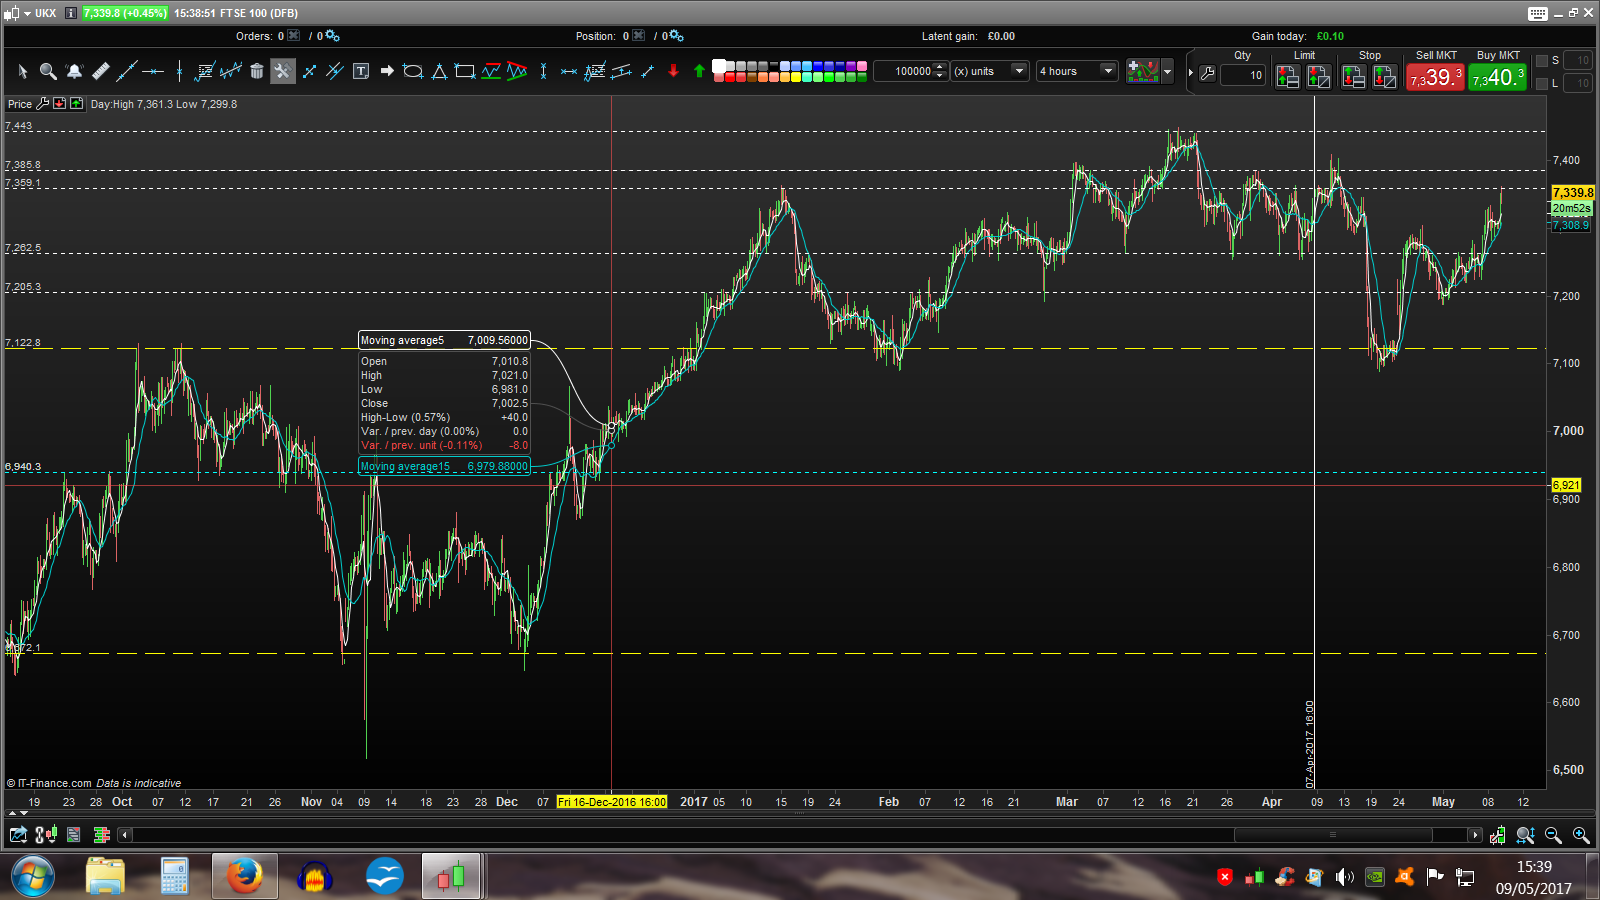
Please see the two screen shots of my current support and resistance levels. ( 1hour chart show action to the right of the vertical line) They are extreme points marked out on the 4 hour and 1 hour charts that mark levels of interest for the big players. ( i treat them more like bands 30 pips or so wide but use lines for clean charts). The Yellow one is the marker for trend reversal and would be used with extreme caution.
I have found that when price action accelerates towards and through these points a reversal is likely. See marked the trades I would have taken on the 1 hour chart. I look for a deceleration after the support or resistance level on the 5 min chart for my entry point.
the stop loss will be the same size as the leading candle length on the 30 min chart and I will move my stop loss to break even at around 20 pips profit, however this is more a money management technique and is a trade off of draw down over potential profit, i will often re enter the same trade again. and I am willing to give up this for an automated system.
As you can see its not fool proof but the winners are considerably bigger than the losers. On my spread sheet of real trades I have 68% winning trades at 3.81:1 RR over the last 4 years I have been doing this. with little variation from quarter to quarter.
Just again, its the previous strength of the reversals that take place at these levels that determine the support and resistance.
I aos would like to note that in trying to explain the philosophy behind the system i have realized how subjective a lot of it is, It is incredible difficult to to definitively explain my years of intuitive learning from studying the charts.
Hello and thank you for pointing out this strategy.
As I noticed that conceptually is very similar to the work we are doing on the DAX discussed here:
Dax adaptable strategy Breakout/Mean reversion
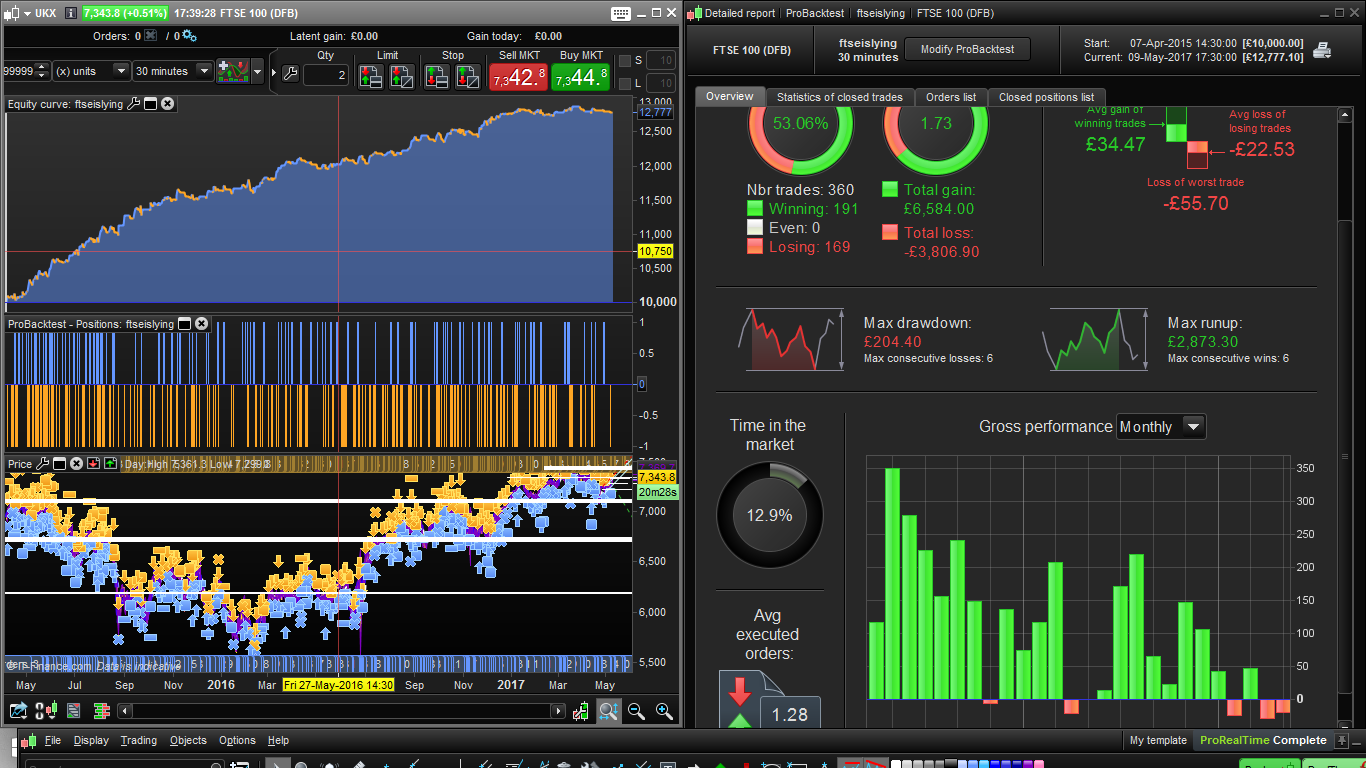
I tried to introduce a filter based on the ADX indicator.
As the strategy is mean reverting I have introduced a new variable for short and longs, called adxmax and added the condition that for the trade ADX has to be lower than adxmax.
Pls find attached the results. No big changes, but a slightly better equity curve.
// ATR based Reversion
// Maz @ prorealcode.com | GDKLockout @ prorealcode.com
// Questions: prtmaz at gmail dot com
// Version 0.22
DEFPARAM CumulateOrders = False
DEFPARAM FLATBEFORE = 080000
DEFPARAM FLATAFTER = 210000
// Constants
once positionSize = 1
once optimization = 1
// Variable optimization sets
if optimization = 1 then // FTSE M39
startTime = 080000
endTime = 210000
tradingTime = time >= startTime and time < endTime
adxperiodlong = 18
adxperiodshort = 18
adxmaxlong = 26
adxmaxshort = 40
atrPeriodLong = 13 //12
atrPeriodShort = 20 //12
atrMultipleLong = 2
atrMultipleShort = 2
rangeWinMultLong = 1.6 // 2.5
rangeWinMultShort = 2.1 // 2.5
elsif optimization = 2 then
endif
// -- Indicators & functions -----
upBar = close > open
dnBar = close < open
bodyRange = abs(open-close)
adxlong = adx[adxperiodlong]
adxshort = adx[adxperiodshort]
atrLong = AverageTrueRange[atrPeriodLong]
atrThreshLong = (atrLong * atrMultipleLong)
barAtThreshLong = bodyRange > atrThreshLong
atrShort = AverageTrueRange[atrPeriodShort]
atrThreshShort = (atrShort * atrMultipleShort)
barAtThreshShort = bodyRange > atrThreshShort
meanrevertinglong = adxlong < adxmaxlong
meanrevertingshort = adxshort <adxmaxshort
// -- Entry Condition logic -----
bc = tradingTime
bc = bc and barAtThreshLong and dnBar
bc = bc and meanrevertinglong
sc = tradingTime
sc = sc and barAtThreshShort and upBar
sc = sc and meanrevertingshort
// -- Execution logic -----
if bc then
buy positionSize shares at market
SET STOP pLOSS bodyRange
bcTarget = (bodyRange*rangeWinMultLong)*pipsize
SET TARGET pPROFIT bcTarget
elsif sc then
sellshort positionSize shares at market
SET STOP pLOSS bodyRange
scTarget = (bodyRange*rangeWinMultShort)*pipsize
SET TARGET pPROFIT scTarget
endif
Let me know what you think
Regards
Francesco
Hi Francesco,
Yes it was reading that Dax break out strategy that prompted me to try code my one. I has always gone by the moto ” the Dax breaks and the Fste fakes”
ahah sounds appropriate 🙂 I wonder if with some optimized parameter we could profit also from a Ftse brake and a Dax fake. Have you ever tried?
Im not sure i understand what you mean?
I think you mean that they break and fake in tandem, at the same time? No i have never tried this.
No I just meant to code a breakout strategy for Ftse100 that goes together with a your mean reverting strategy.
Basically the same I did for the Dax in the discussion I posted above.
As you see I included and ADX filter in your original code in order not to take mean reverting position when there is a more or less defined trend.
SO basically we could try to include also a breakout strategy in your code when the ADX is greater then a certain threshold.
ah Ok, I have a bit more learning to do on the ADX indicator before I can comment on that. I am really happy for your input and look forward to grinding out some variables tomorrow.
I aos would like to note that in trying to explain the philosophy behind the system i have realized how subjective a lot of it is
Finding the same levels that you find easily by looking at the graphics will be a real challenge 🙂
Maybe you could help, please review this
support resistance indicator on a price chart to see if it has any similarity to the way you are drawing these levels (this one only find support lines currently).