Hello everyone.
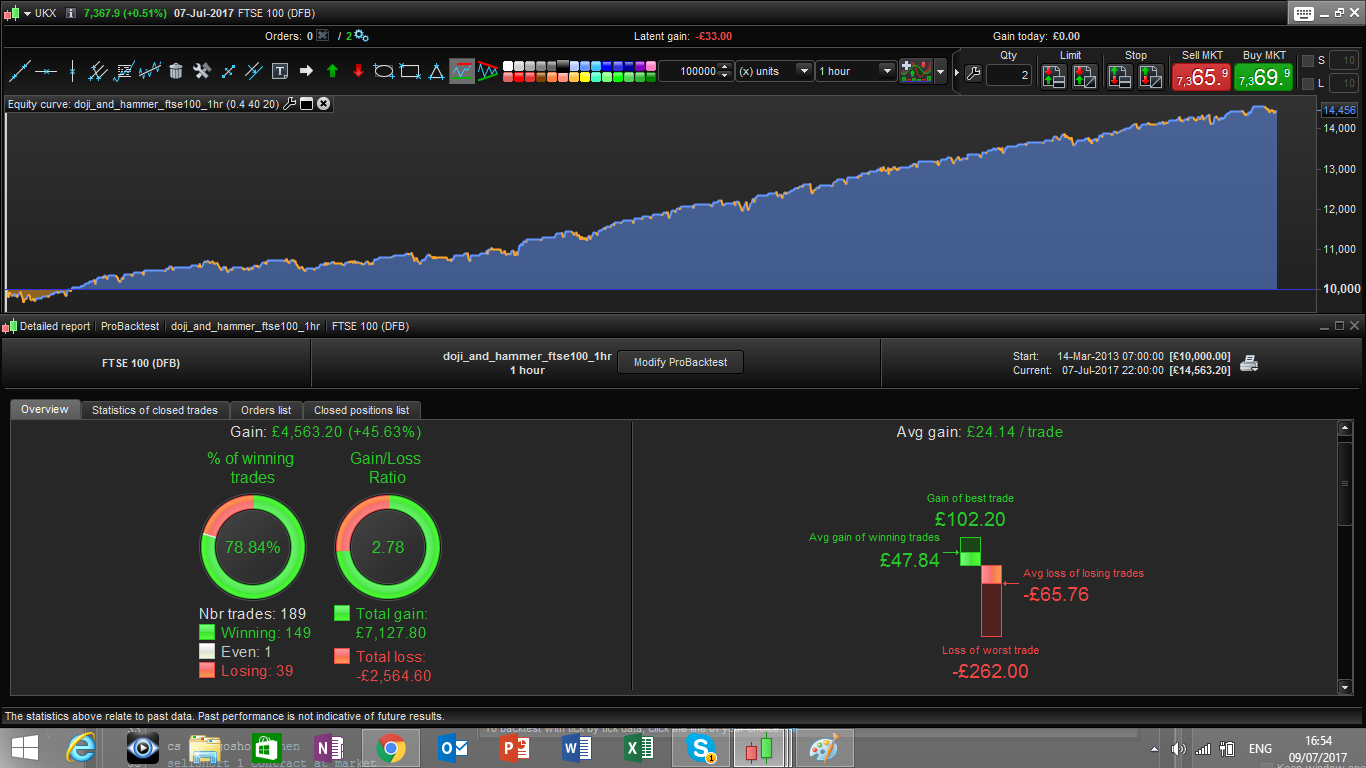
I have found this strategy on the FTSE 100 by playing with candlestick pattern.
In particular here I assumed that 2 doji bull/bear candle are followed by an hammerdown/hammerup candle.
I then added some momentum filter condition based on 3 simple moving average.
The optimization involve:
- the parameter x that define how much doji are the candle
- the profit target
- the trailing stop
Moving averages are not optimized, and long and short trailing stops are set to be the same to avoid overfitting.
Hope you like it.
Francesco
defparam cumulateorders = false
///money management
reinv = 0
leverage= 3

IF REINV = 1 THEN  // réinvestissement
capital = 10000 + strategyprofit
n = (capital / 10000) *leverage
else
n = 1
ENDIF

///market conditions

av1 = average[5](close)
av2 = average[10](close)
av3 = average[50](close)
bull = close> av1 and close >av2 and close > av3
bear = close <av1 and close <av2 and close <av3

///optimized variables
x = 0.6
PR = 50
timestart = 070000
timeend = 230000
TG = 40


///candle pattern defirnitions

timeok = time>timestart and time < timeend
dojibull2 = open[2]<close[2] and abs(open[2]-close[2])/(high[2]-low[2])<x
dojibull1 = open[1]<close[1] and abs(open[1]-close[1])/(high[1]-low[1])<x
dojibear2 = open[2]>close[2] and abs(open[2]-close[2])/(high[2]-low[2])<x
dojibear1 = open[1]>close[1] and abs(open[1]-close[1])/(high[1]-low[1])<x
hammerup = min(open,close)>high-(high-low)/2 //and max(open,close) < min(open[1],close[1])
hammerdown = max(open,close)<low+(high-low)/2 //and max(open,close)<min(open[1],close[1])//and timeok

//trade conditions
cl = (dojibull2 and dojibull1) and hammerdown and bull
cs=  (dojibear2 and dojibear1) and hammerup and bear


if cs  and timeok then
sellshort n contract at market
endif

if cl  and timeok then
buy n contract at market
endif

///ttailing stops
if not onmarket then
MAXPRICE = 0
MINPRICE = close
PREZZOUSCITA = 0
ENDIF
if longonmarket then
MAXPRICE = MAX(MAXPRICE,close)
if MAXPRICE-tradeprice(1)>=TG*pointsize then
PREZZOUSCITA = MAXPRICE-TG*pointsize
ENDIF
ENDIF
if shortonmarket then
MINPRICE = MIN(MINPRICE,close)
if tradeprice(1)-MINPRICE>=TG*pointsize then
PREZZOUSCITA = MINPRICE+TG*pointsize
ENDIF
ENDIF
if onmarket and PREZZOUSCITA>0 then
EXITSHORT AT PREZZOUSCITA STOP
SELL AT PREZZOUSCITA STOP
ENDIF

//fixed profit target
set target pprofit PR
Hi Francesco, another great addition, thank you.
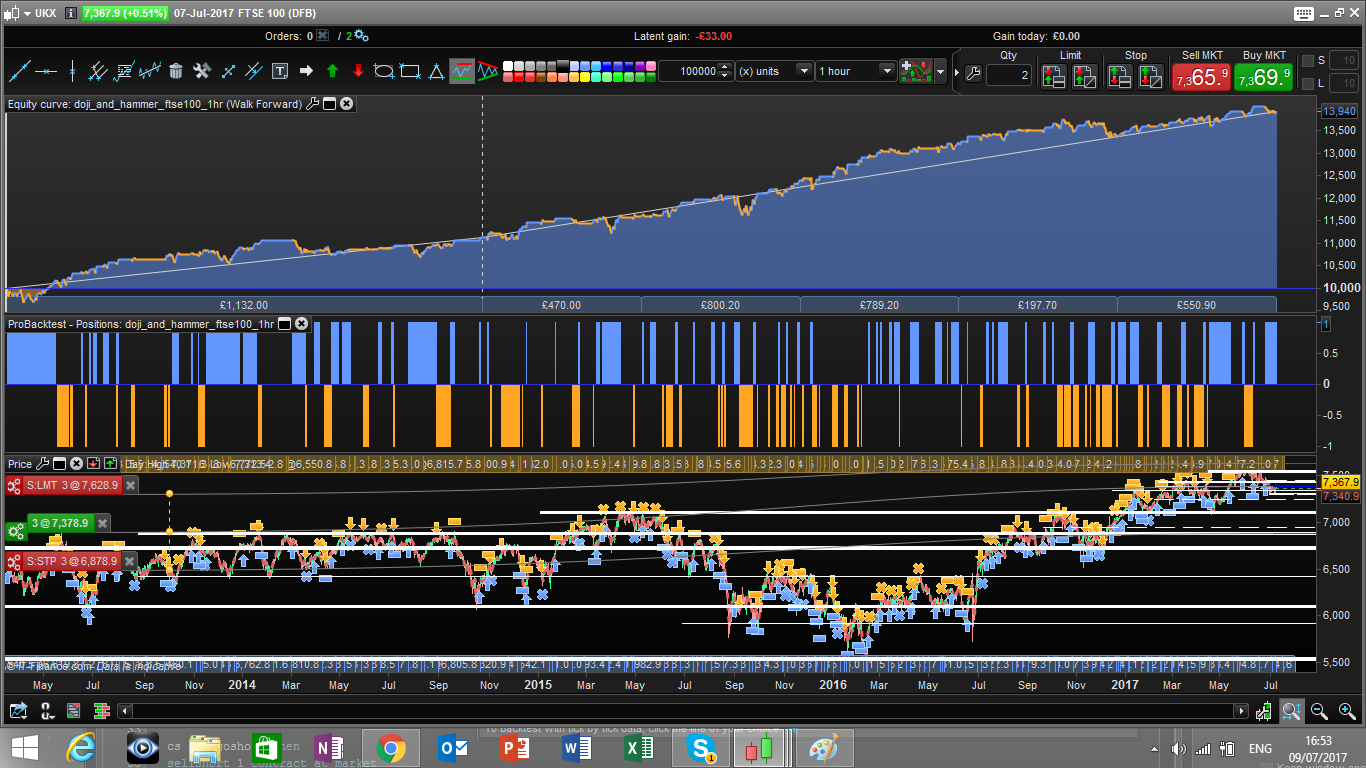
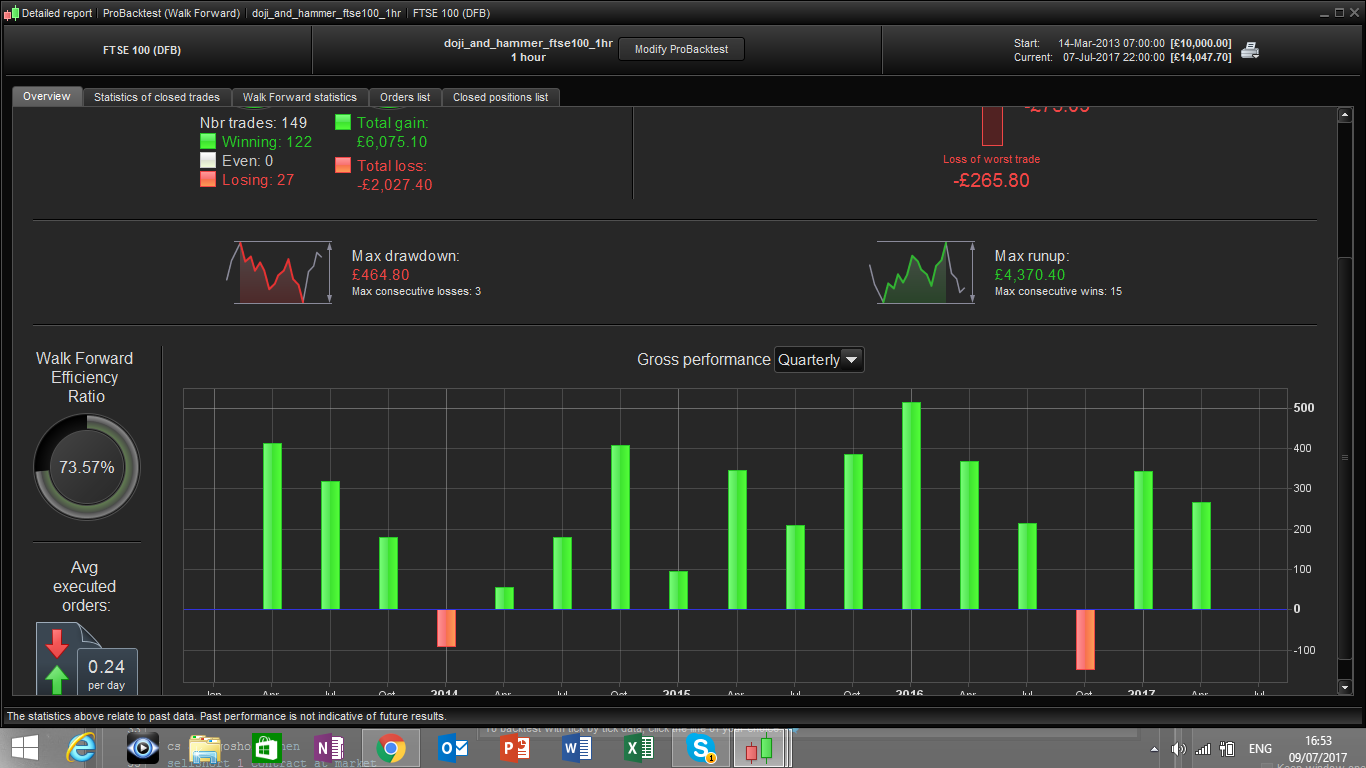
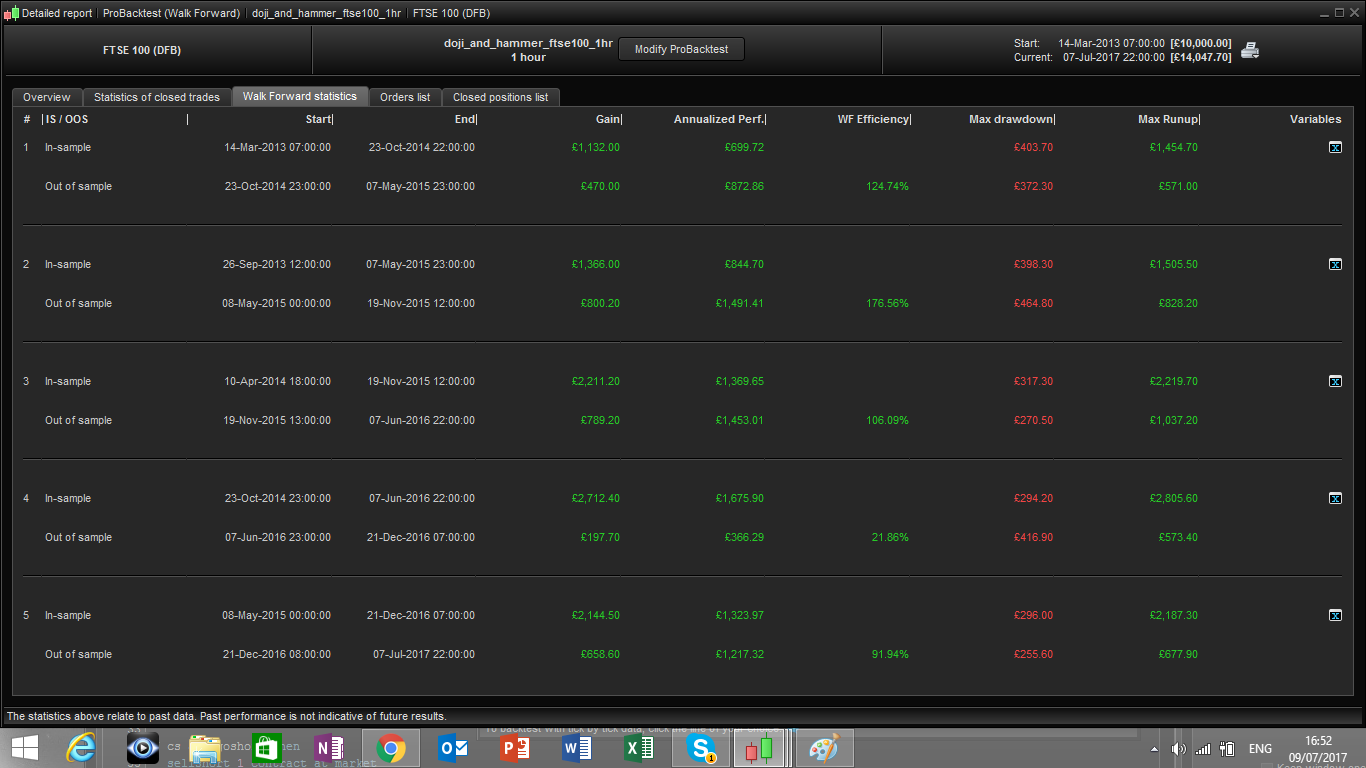
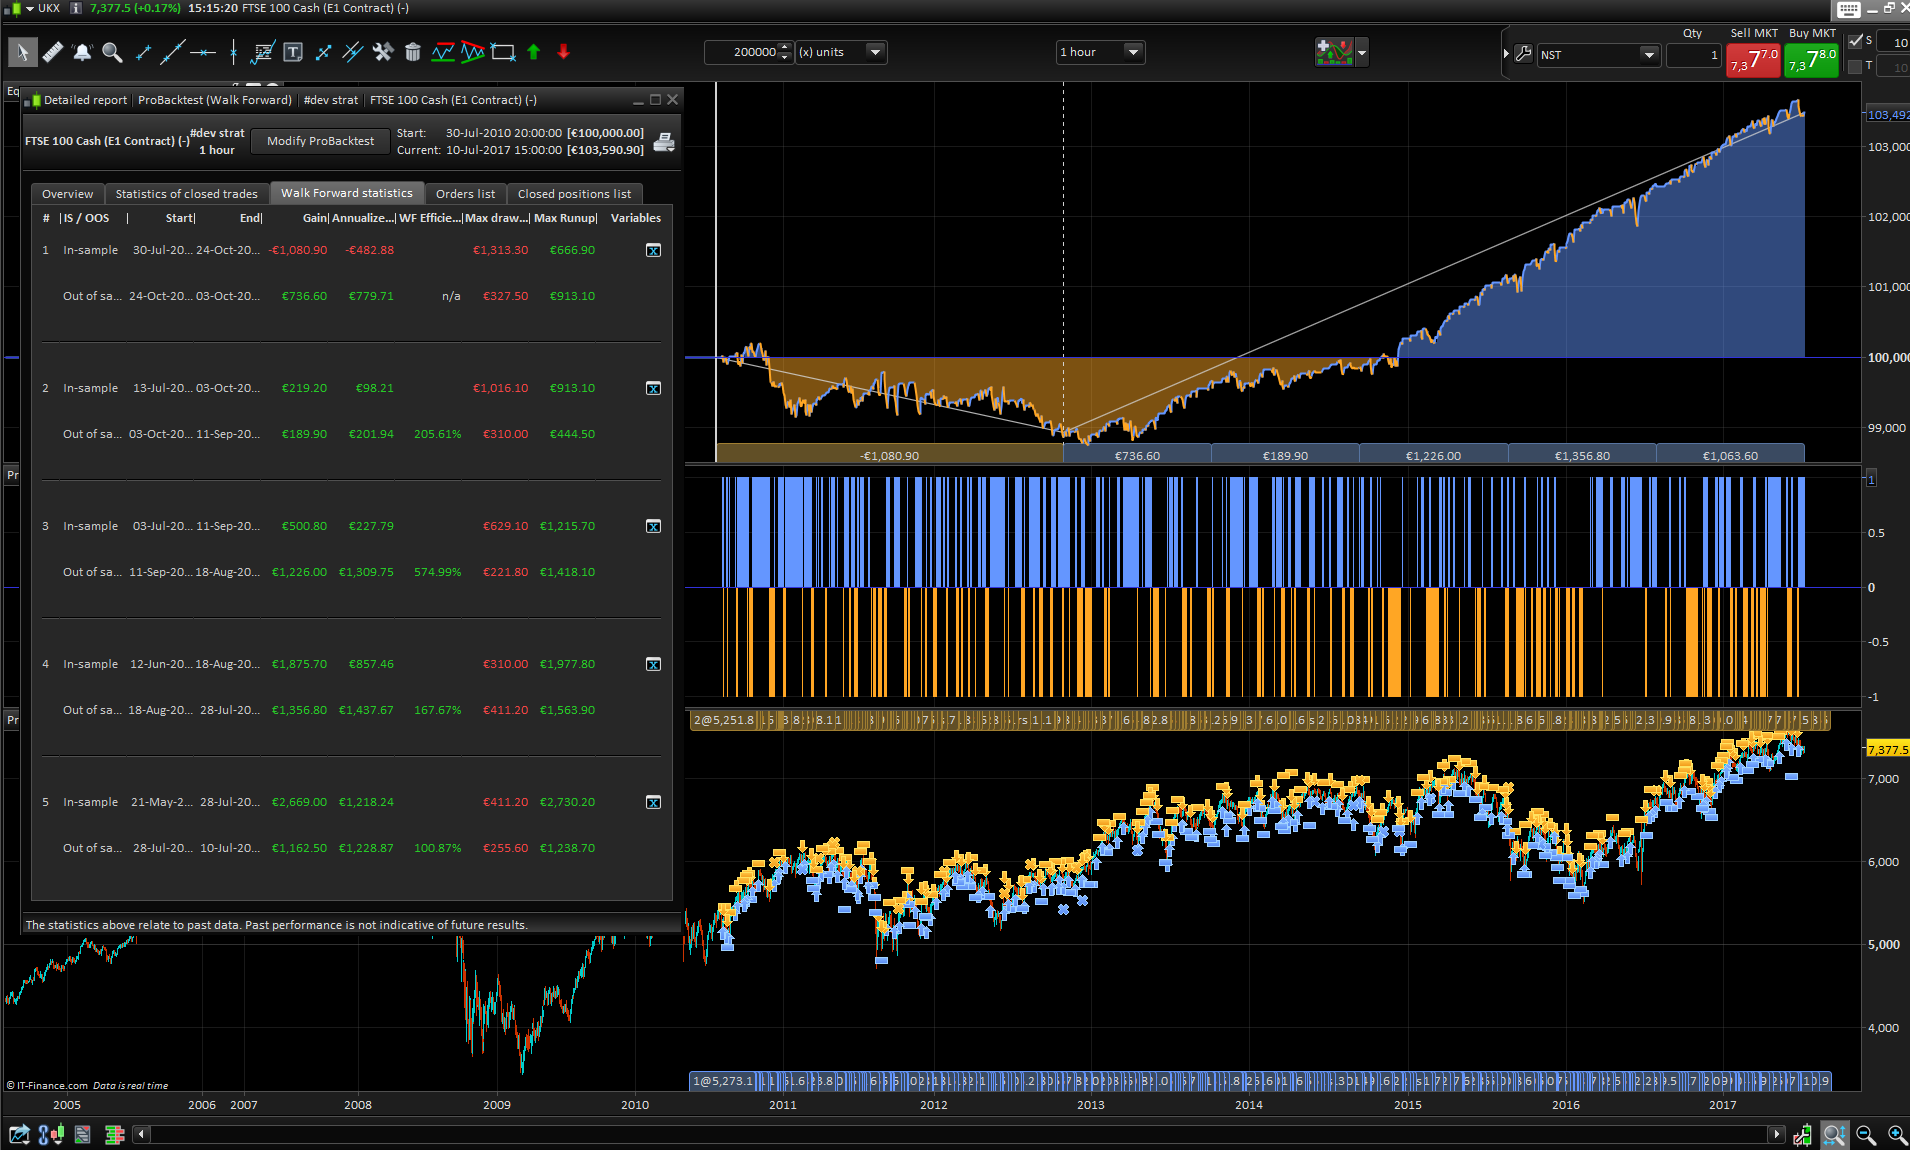
I just made a WF analysis on a 200k bars basis and this is what I found (picture attached).
Even if the overall result is so-so, there are things that annoy me, please consider them as advises and don’t be offend 🙂
- I think I should use more than 5 WFA on this longer period, at least 10 (double size of your own test, made on 100k bars).
- the first IN SAMPLE result is not good
- some of the OOS results are giving huge Walk Forward Ratio (+500% !)
- I used 10-100 for PR and TG with a 10 points step and all the best OOS optimized variables are set to 10 (?!)
Beside this, the strategy has performed well before the start of your own 100k bar backtest, that’s why I’m a bit perplexed of the whole analysis..
What were the settings of your optimisation for PR and PG please?
Thank you Nicolas, no offense at all! I am actually happy to see that you spent some time to analyse the strategy in more details.
My settings for the WF were the same as yours, I also considered x as a variables ranging from 0.4 to 0.6 with steps 0.1.
Im running it again in order to give you the details of the optimal value for the variables in the different IN SAMPLE and will let you know
HI Nicolas, do you get the same results as I get on the 100k bar?
Thanks
Francesco
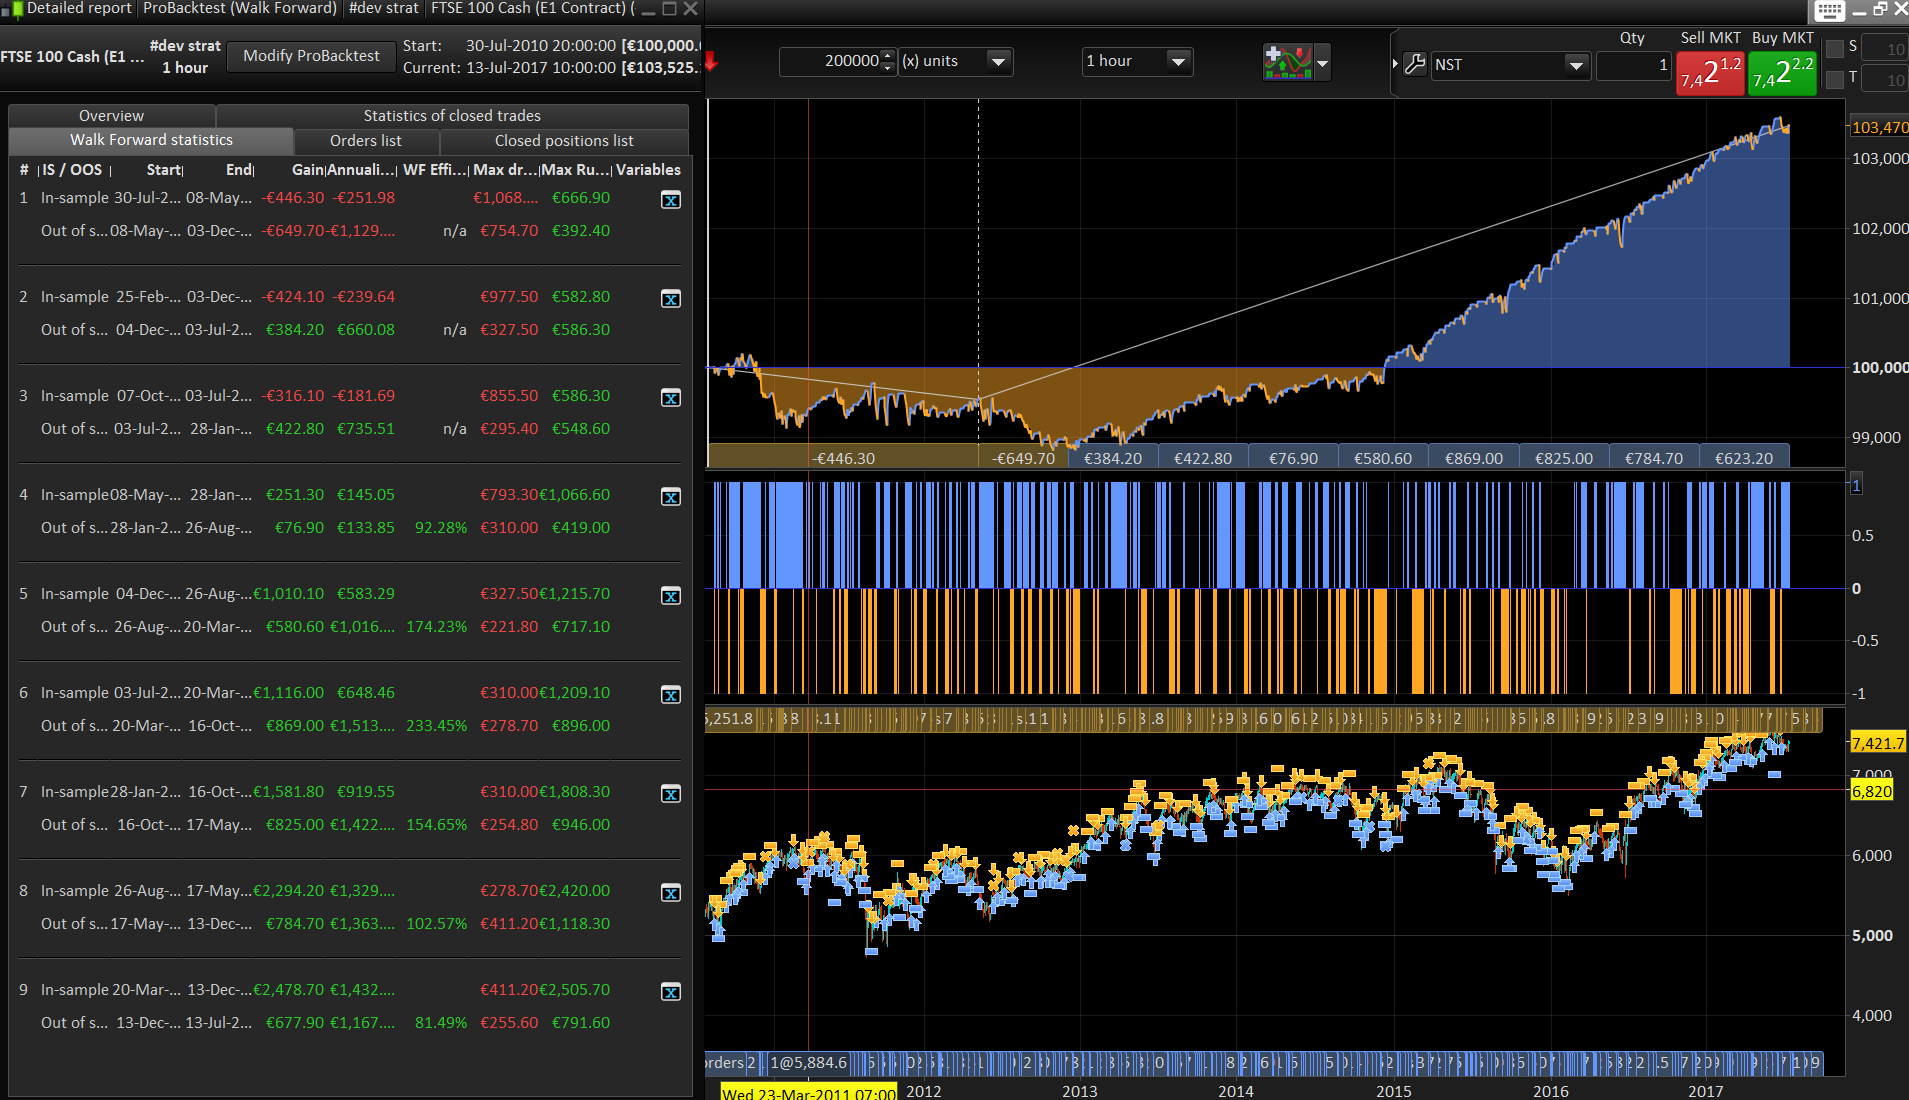
Did not test on 100k bar but as far as I could do in tick mode with another try here with 9 OOS periods.
Thank you Nicolas, just for my info if you optimize without WF on the 200k bars how does it look?
Many thanks
I started this one one demo but got the “zero division” problem or what you call it. Is there any fix for it?
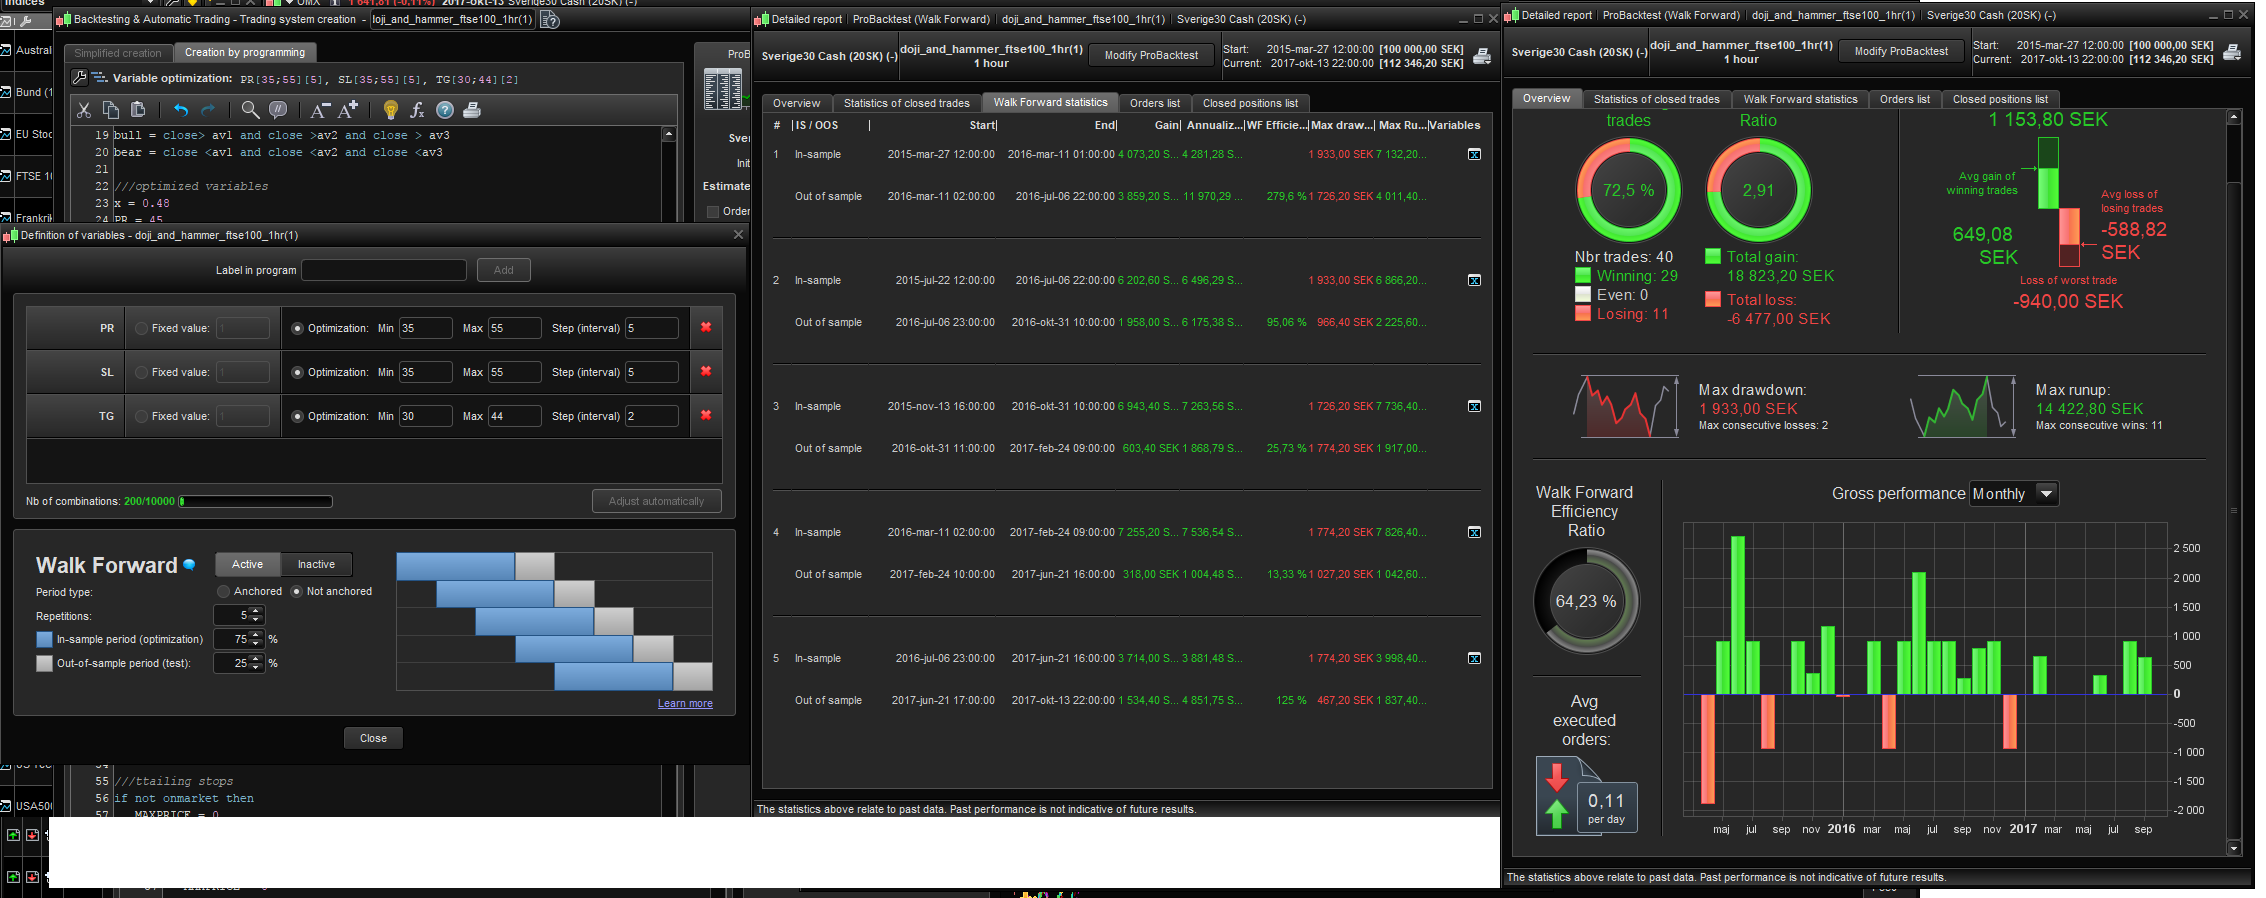
Not sure the strategy will work because of above error, but I optimized it for OMX if anyone is interested.
@ozz87
I think you can get rid of the zero division error by ensuring there are enough bars loaded to complete the candlesticks patterns calculation:
defparam preloadbars=1000
Another great idea Francesco! And many thanks to you Nicolas. Will keep working on this with WF testing and such. The shorting looks insane in ftse!
Interesting results nicolas.
Also im interested in hearing about your thoughts about this: If a strategy is optimized for 1 market, lets say FTSE. Then you copy/paste that same strat on lets say DAX. If it shows positive results and steady curve, does this make the strategy more robust and sturdy? Or is this a useless thing to look for?
Im sorry if you guys think this is too off topic! Great strategy, great work.
Another question for you Francesco, i’ve seen a screenshot of some of your portfolio numbers, mighty impressive 🙂
I was just wondering, how long did it take you to make your first profitable strategy, and are you still running it?
and follow up regarding the question over: Have you had a strategy that was profitable, but stopped being profitable? How did u notice and when did you draw the line? Maybe when the max drawdown on backtest was beaten? (as in you’ve lost more than your backtested max drawdown?
I mean, when can you say that your strategy was too curve-fitted and not working in the real market anymore?
In other words: The more universal strat = better?
Please share your knowledge on this if possible! What does your experience tell you? 🙂
Also i got a question about running the same strategy on the same timeframe but on different markets with different optimized variables. Is this generally a stupid idea? Is it better to run the one strategy on just 1 market, then work on a new strategy?
@Nicolas: Thanks, I’ll try it 🙂 Got the error this morning also. And my optimization for OMX is gone, it seems PRT removes my codes when I log out sometimes, so got to make sure to export them from now on… 😉
@nicolas: The preloadbars code didn’t help. Still cannot run this code for unknown reason.
@ozz87
The only divisions I see that could generate this error are between lines 32 to 35. A rough solution would be to include these lines with a condition that make sure the differences between highs and lows are strictly superior to 0:
if (high[2]-low[2])>0 and (high[1]-low[1])>0 then
 dojibull2 = open[2]<close[2] and abs(open[2]-close[2])/(high[2]-low[2])<x
 dojibull1 = open[1]<close[1] and abs(open[1]-close[1])/(high[1]-low[1])<x
 dojibear2 = open[2]>close[2] and abs(open[2]-close[2])/(high[2]-low[2])<x
 dojibear1 = open[1]>close[1] and abs(open[1]-close[1])/(high[1]-low[1])<x
endif
what I normally do is the following:
dojibull2 = open[2]<close[2] and abs(open[2]–close[2])/(high[2]–low[2]+0.00000001)<x
dojibull1= open[1]<close[1] and abs(open[1]–close[1])/(high[1]–low[1]+0.00000001)<x
dojibear2= open[2]>close[2] and abs(open[2]–close[2])/(high[2]–low[2]+0.00000001)<x
dojibear1= open[1]>close[1] and abs(open[1]–close[1])/(high[1]–low[1]+0.00000001)<x