Hi,
I’m sort of a beginner and wonder how long you would test an algo in demo before going live.
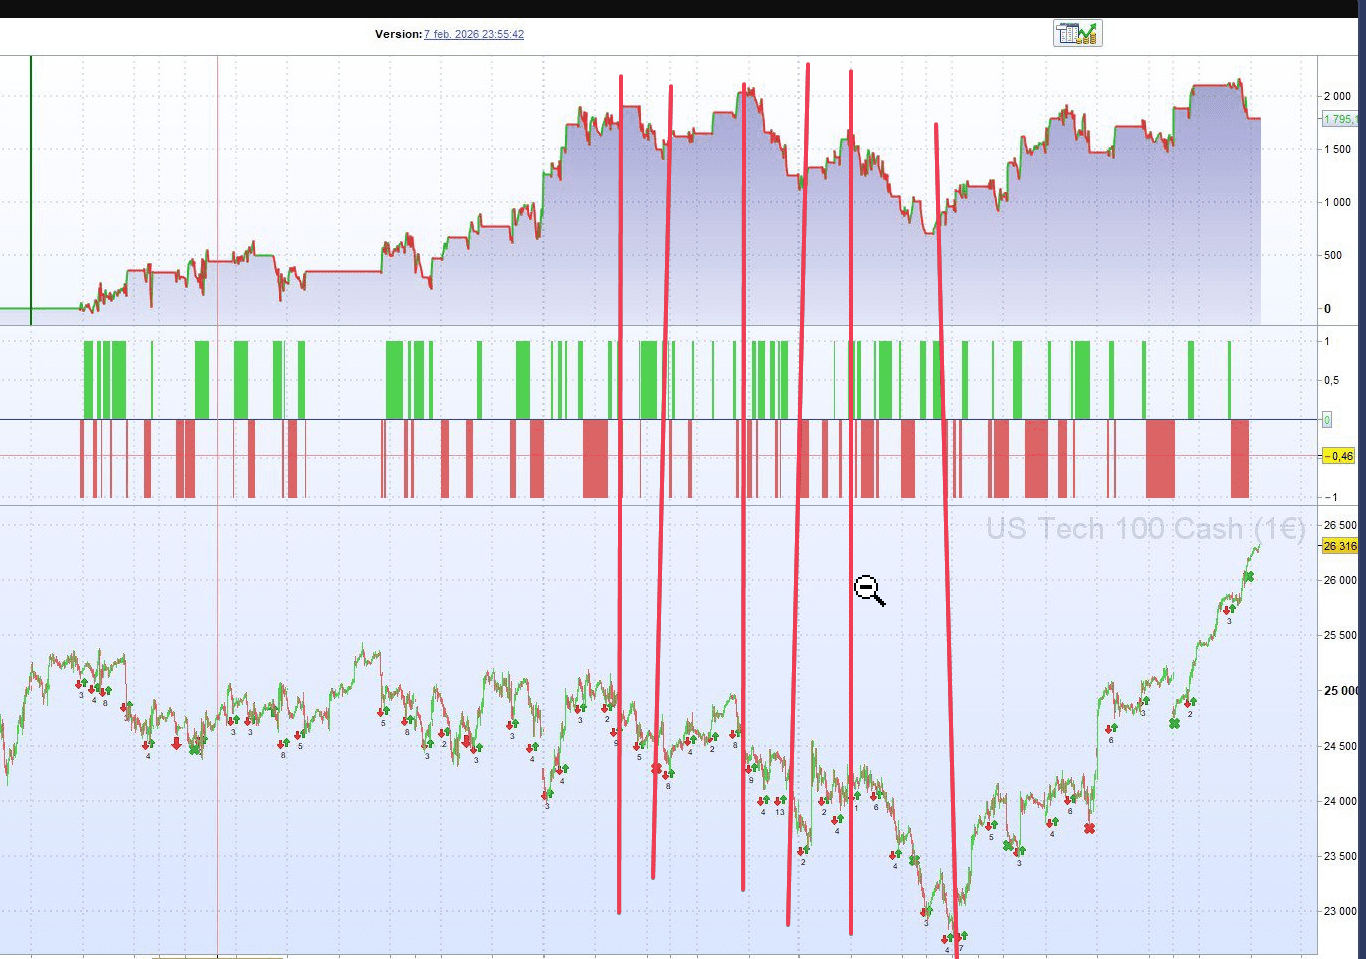
See my attached files.
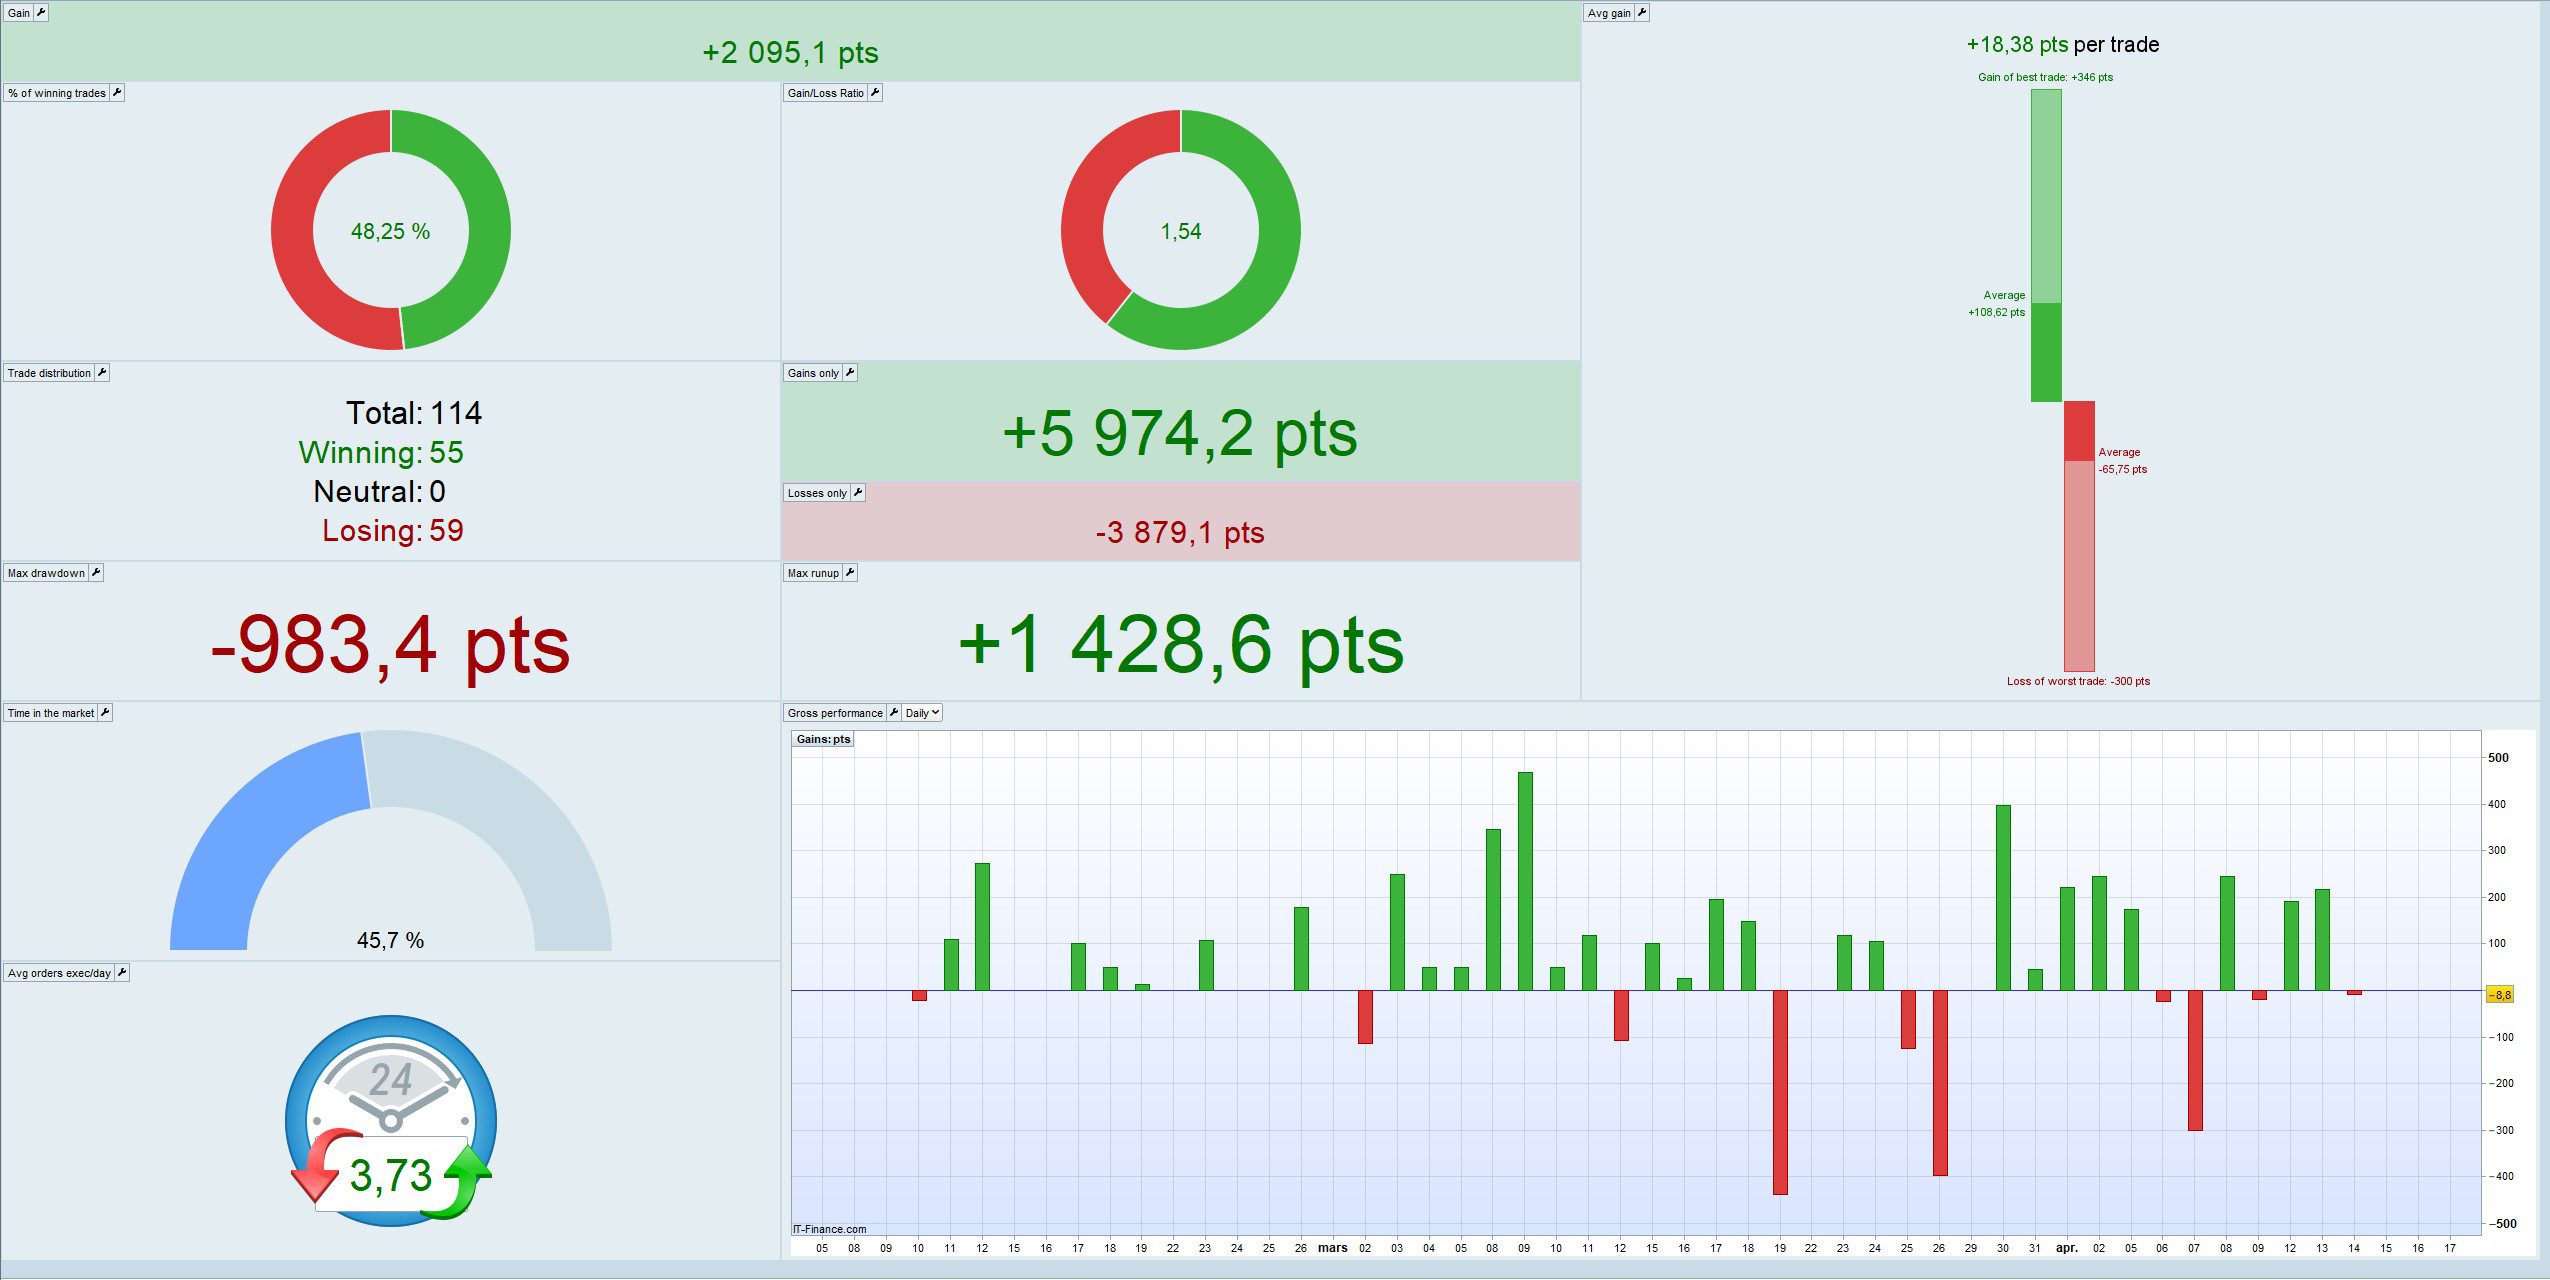
This is a algo running at a 30 second timeframe US100
(from start I developed it for Tick chart but realised that don’t work in PRT, just backtesting)
I started the algo 7/2 this year in demo.
Would you run it in demo longer or would you launch it at a live account if it was your algo?
Best regards Anders
Well done.
Every opinion may differ but I can only speak for myself coming into my fourth year automated and profitable for 2. 3-12 months for me depending on trade frequency/concept. Before I did this I had troubles and learnt about curve fitting..oh joy. Once you get a few validated you will not need to be in a hurry. Think of it as an assembly line process needing a concept>design>prototype>robustness testing>live. Sow seeds like a farmer, before you know it you’ll be reaping and sowing at the same time only to improve your yield.
CC
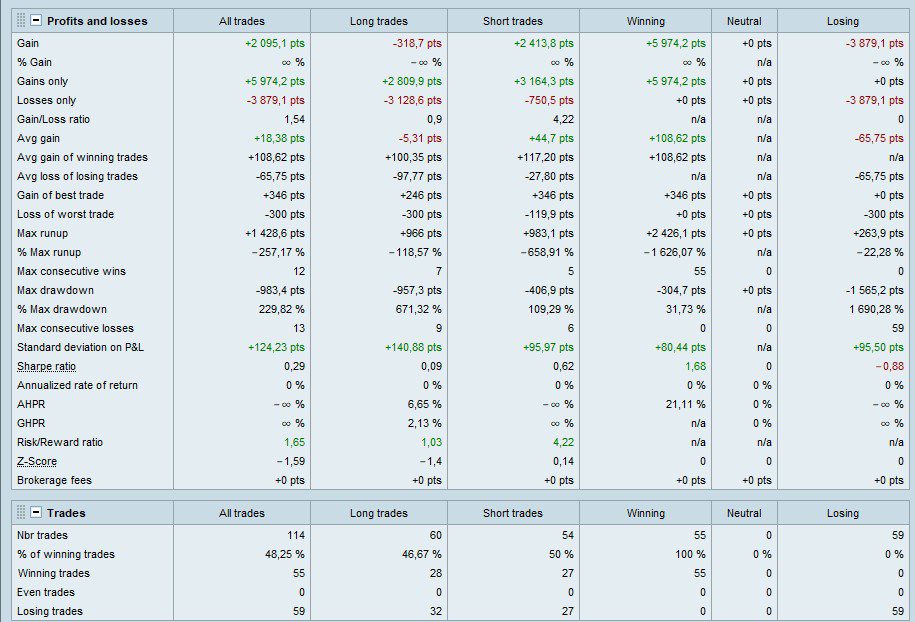
I’d be worried about your Longs showing average Loss.
Maybe you curve fitted to the recent downtrend?
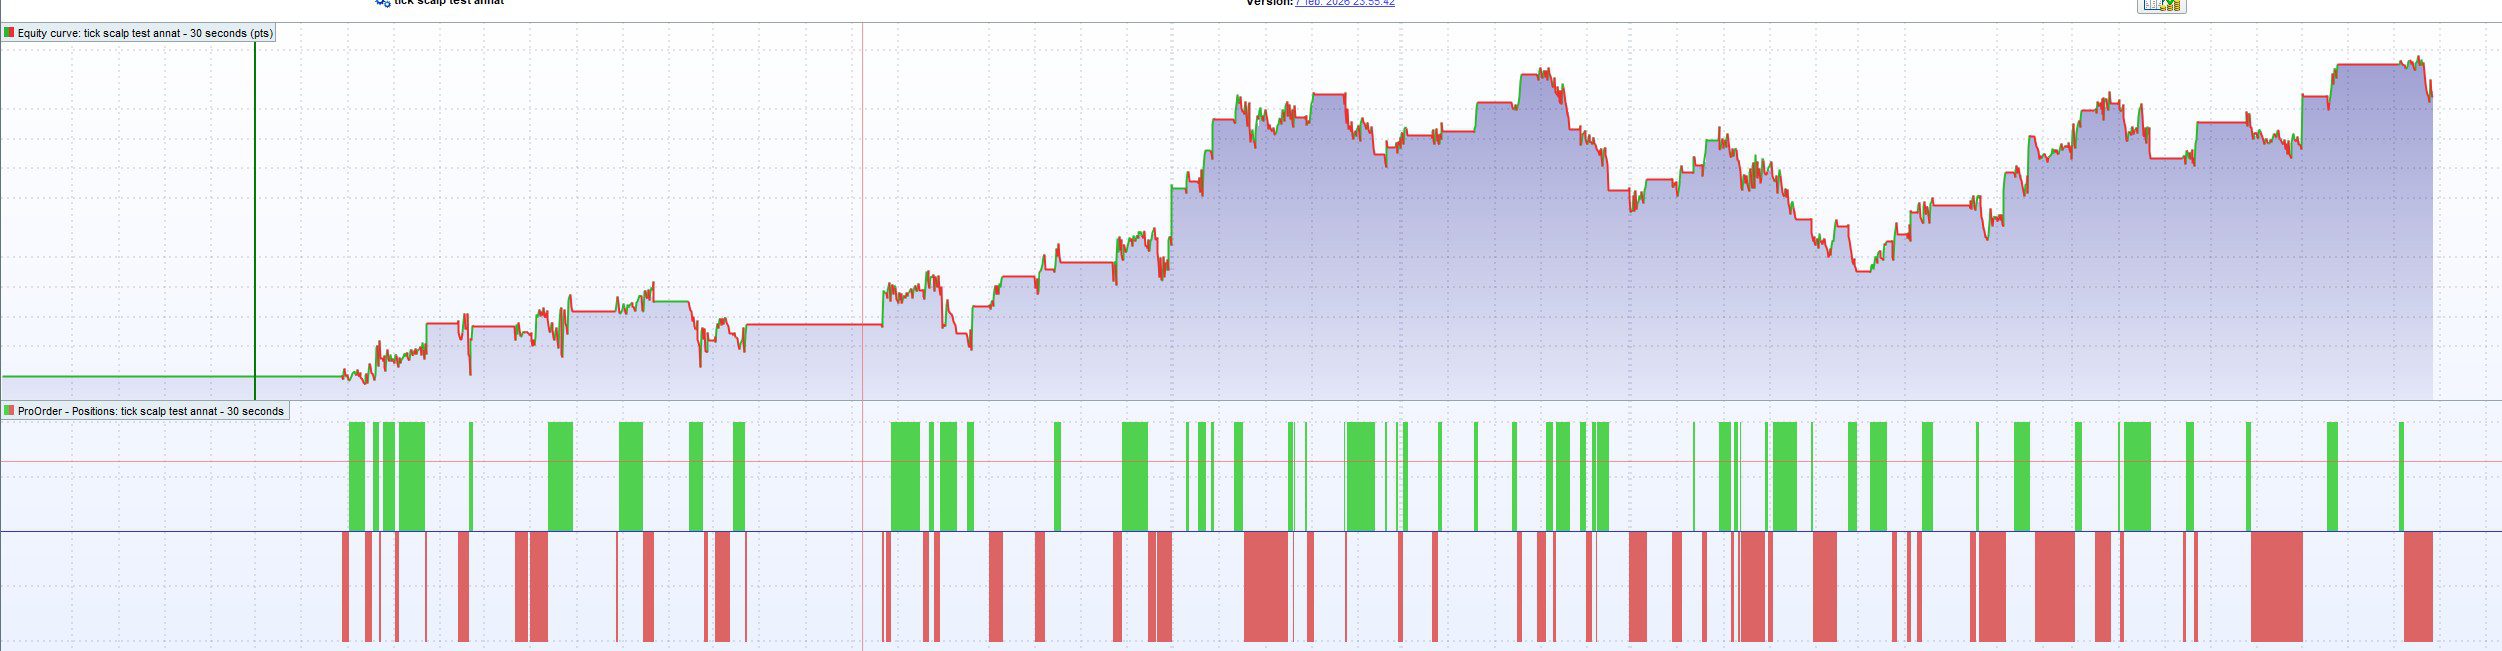
Also the equity curve looks very choppy, but you do show a low max drawdown … what is position size?
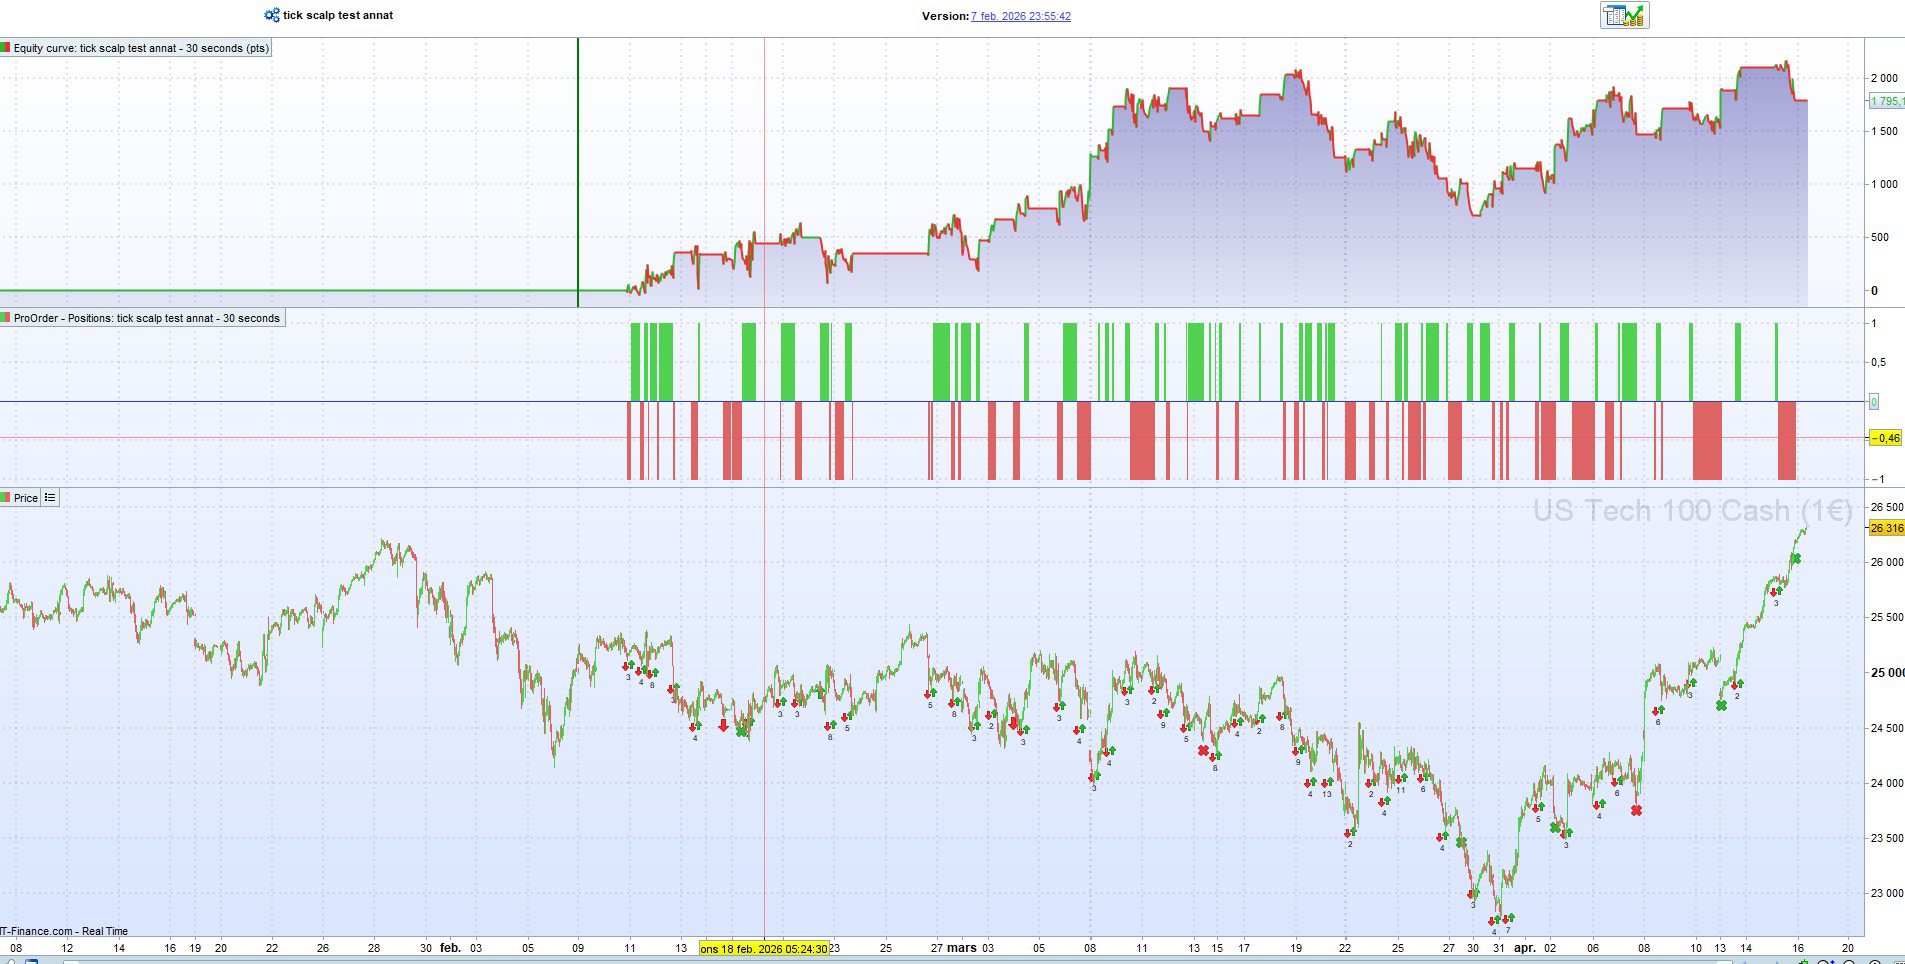
We could make a better judgement if you show price curve under the equity curve and positions, also X and Y scales be useful.
My position size are 1contract.
I developed the strategi from data from oktober/november 2025 to Januari 2026.
(I only got 200K units to test on)
Unfortunately I don’t have my backtest results saved because I have a new computer. But the live results are similare to the backtest. Except from the longs. The longs where in profit and short was break even = gains almost the same as live result.
Where do I find X and Y scales you are asking about @GraHal
You are showing the X and Y scales now on your ss.
I would re-optimise or have tighter stops on those several Longs that sit there losing money during downtrend – see attached.
hi, I don’t know about about any general valid “rule of thumb” in that relation, but I think like CC as well that trade frequency matters a lot, and yet disregarding the frequency “time on the market” matters a lot as well. so my own rule is always to test a strategy for at least 3 months before increaseing position. I never test on “demo”, but live – with very minimum position in the beginning, and then increasing gradually if strategy seems to work according my expectations. new strategy does not have to earn lot of points during those 3 months to prove it works, yet my experience was that quite always those “not working” strategies deteriorate within 3 months systematically/consistently.
testing live, even with minimum position, has some substantial advantages: 1) even there is only little money behind – it’s still money and psychologically matters more than in case if there is no money behind your activities. 2) you see if algo works technically in live environment: some things which “work” in backtest environment don’t work live at all, or work differently that one thought 3) you have real costs (spread, slippage, overnight financing…), and if you trade cfd you have some other obstacles brokers might put on your way, like minimum stop distances which might stop your algo at unexpected time, so you miss trades which you don’t miss in backtest, so this is again kind of cost which you can’t even estimate.
Thanks for all replies!
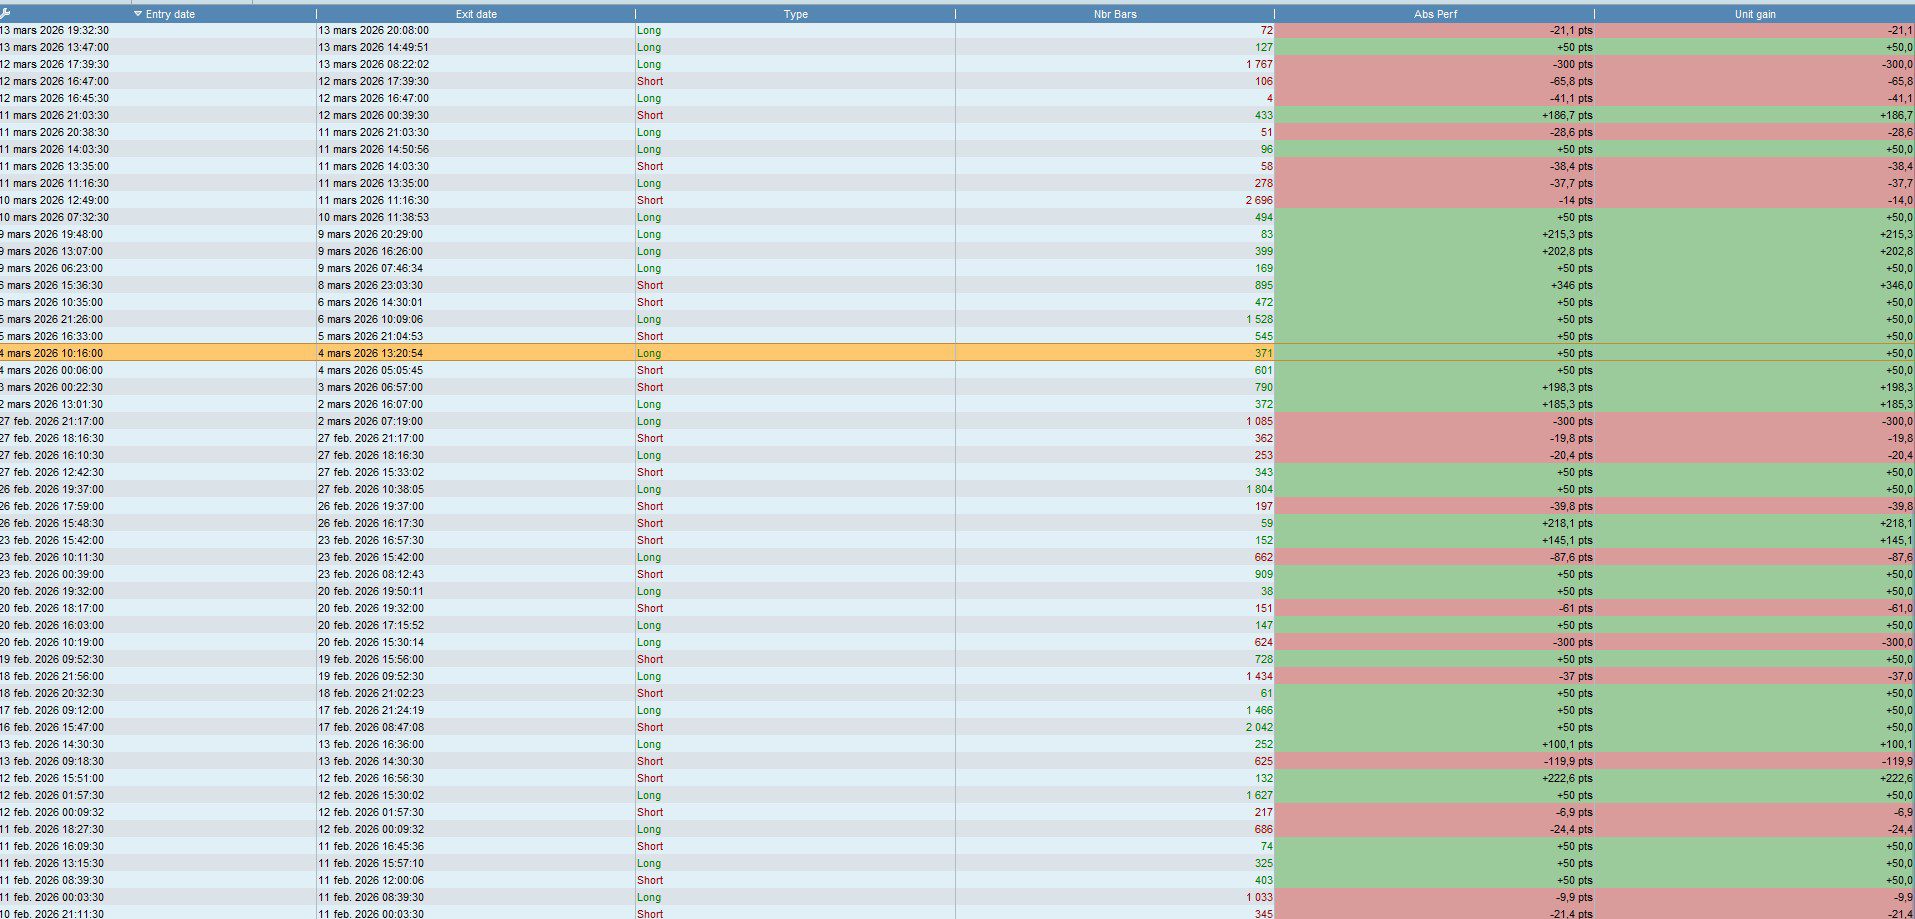
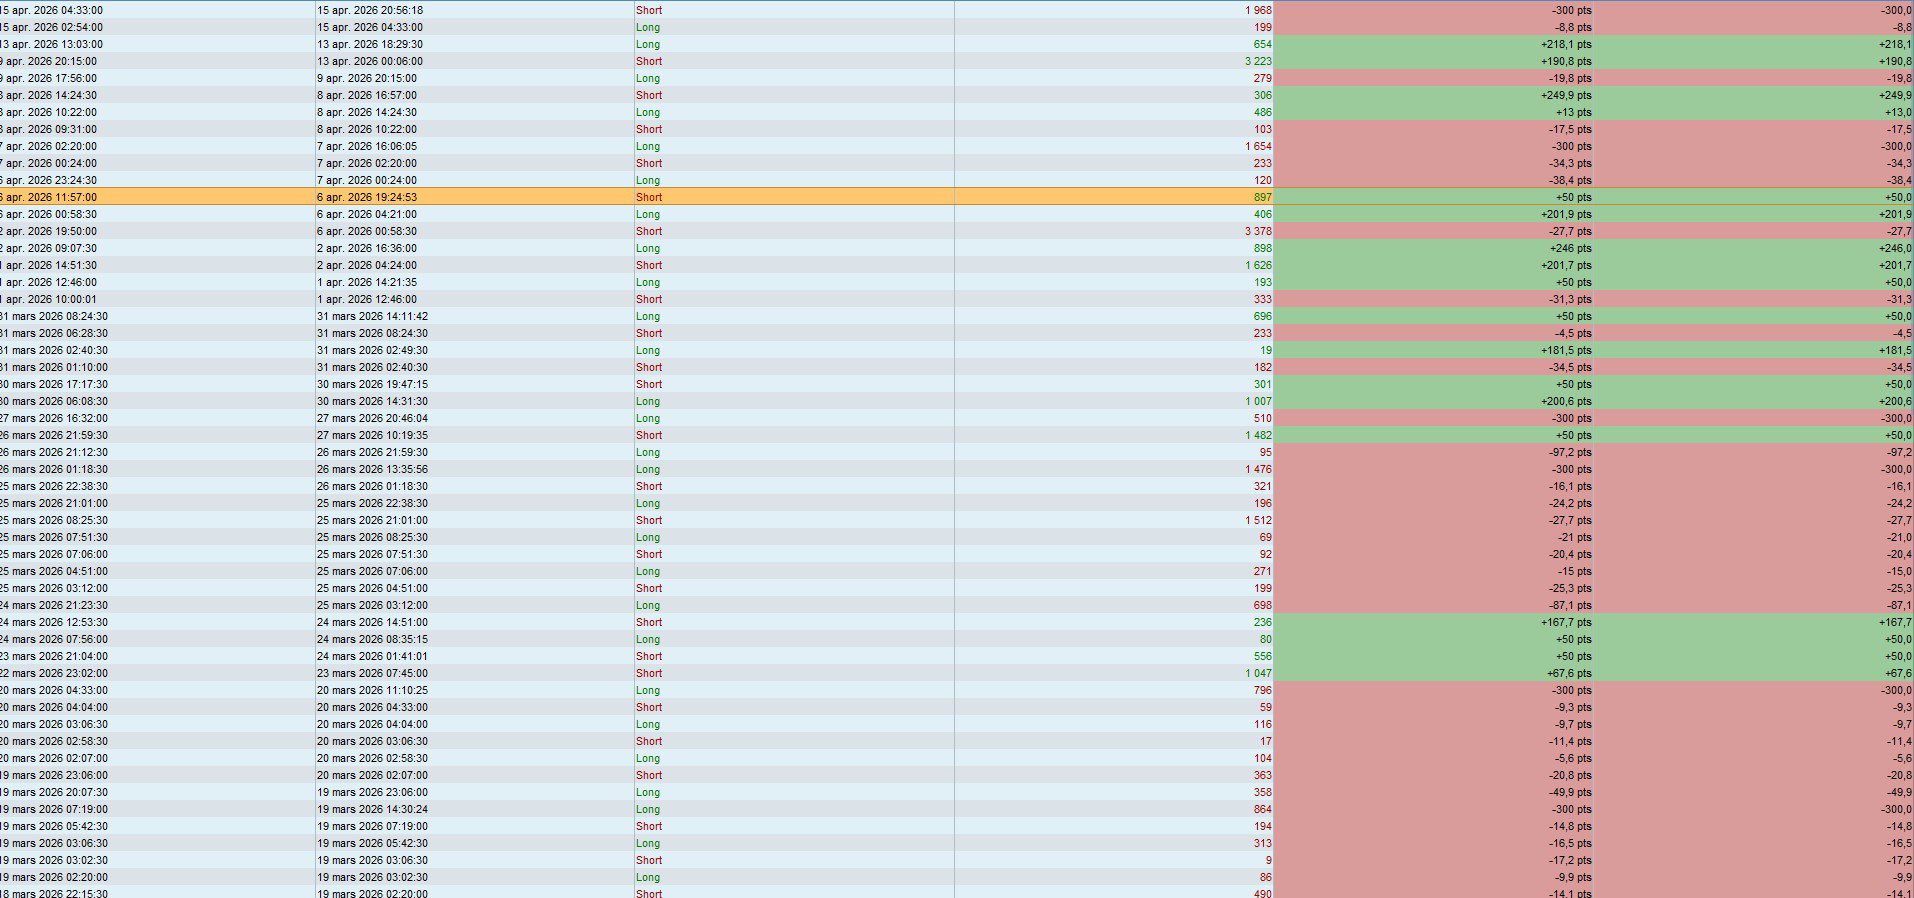
I have a “hard” stop now at 300 points + a breakeven code.
Take profit and shifting from long to short are dynamik.
I attach example for the taken trades in demo.
I backtested the strategi with a tighter stop loss and it where hit to often.
My head are working hard to find improvements for the strategi
Frankly speaking, I’m not very optimistic about this strategy. Although the market over the past two months has indeed been unusual, the performance of your strategy is basically just moving in line with the market itself. A 30 second chart contains a lot of noise, and in that timeframe you are effectively competing with Wall Street’s supercomputers. A profit of 2000 with a drawdown of 980 is too large. Being in the market 45% of the time on a 1-minute timeframe is also quite risky. Under these conditions, a profit factor of 1.5 is difficult to sustain.
The backtest needs to include a sufficiently large sample size and must survive across different market regimes. Paper trading should run for at least three months, and even then overfitting is still possible.
I once spent a year and a half working on a system that looked very strong in backtests over one million bars on a 5-minute timeframe. It survived across different market regimes over 15 years. It performed well in live trading for a few months, but starting last year it completely fell apart because the market structure changed.
Thanks for your opinions and advice.

I understand that I have a lot of work left in the development work on this strategy.

This strategy is basically a trend-following strategy. The trading signal occurs on a 30-second time frame. But with filters on higher time frames.

I haven't managed to solve the filtering properly, I understand. I've tried different MAs but don't think it works very well. With ADX I've managed to filter reasonably well.

Do you have any suggestions on how to filter out when I should go long or short?
You’ve just asked a 100-million-dollar question — probably an even bigger one. Everyone here is trying to figure this out.
What I can share is based on my experience over the past few years:
- Every instrument has its own personality. Some are calm, some are volatile, and some are extremely volatile. You need a deep understanding of the specific behavior of the product you are trading. Who is trading it, and when? For example, in index futures before about 8:30 a.m. (pre-market), activity mostly comes from market-makers algos and retail traders. Large institutional participants typically enter during the first hour after the open and the last hour before the close, when liquidity is highest. During the Wall Street lunch session, major players rarely appear to drive real trends.
- Trend following and mean reversion have fundamentally different structures. Trend following usually has a low win rate with small stop losses and large profits per winning trade. Mean reversion usually has a high win rate with larger stop losses and smaller profits per trade. If you are trading trend following but aiming for 100 points profit with a 300-point stop loss, that contradicts the natural logic of the approach.
- In the end, quantitative trading is statistics. And if it’s statistics, then 100 trades have no real statistical significance. In backtesting, the goal should not be the highest profit setting, but the most stable one. Otherwise, you are likely overfitting. A parameter set that performs well during recent volatile months may completely fail during the next strong rally or sell-off.
- Retail traders operating on very short timeframes mainly provide profits to market makers and brokers. The retail traders I’ve seen who consistently succeed on these timeframes usually rely on order-flow and depth-of-market analysis.
- Both price time-series analysis and structural analysis can be effective. I don’t agree with the claim that technical indicators are useless, nor with the idea that indicators are universal solutions. No single indicator — whether EMA20 or TEMA34 — solves everything. If you are using time-series price analysis in a trend-following framework, the key questions are: how to identify a trend, how much room to give it to develop, how to stay in the trade if the trend continues, and how to exit if it fails. On a 30-second chart, trends often end almost as soon as they appear.
- The essence of things is usually simple, so the explanation should also be simple. A system with 30 different parameters is most likely overfitted or unable to adapt to changing market conditions.
- Markets go up and markets go down. Sometimes they rise in order to fall, and sometimes they fall in order to rise. It sounds trivial, but if a system can only capture one type of market condition, then you need to understand which condition occurs more often in the instrument you trade.
I had some time today to write this, and these are lessons learned through real trading experience with real money. But to truly understand them, you probably still need to go through the process step by step yourself.
Thanks for the advice and your opinions dipont!
Trying to keep my bots simple with a maximum of 2 indicators. Also trying without indicators.
During the time I’ve been doing this, I’ve reflected on one thing regarding backtesting:
The systems that perform best are those without stop loss or fixed take profit on the daily graph. But unfortunately I can’t afford to run such a system because I don’t have a large enough account. (Maybe I’ll have to look for a broker that allows smaller contract sizes) Would never make it through the draw down period.
As soon as I mix in stop losses that would be reasonable for my account, the systems start to perform poorly due to large movements on the daily graph.
Therefore, I look at some smaller time frames where it’s a bit easier to set reasonable stop losses.
I know I have a long way to go, so I appreciate everyone who has the experience and takes the time to give advice and nudges me in the right direction both in my own thread and other people’s threads.
Personally, I never enter a trade without a stop loss. It’s the one thing that ensures your survival in the market. Believe me, a 1000% gain in three months will make you go broke faster than a 10% monthly return over five years. That’s why I emphasized in point three: backtesting shouldn’t be about chasing the highest profit, but the most stable performance. You want a strategy that holds up across almost every market regime.
What you described is very common; 95% of fund managers fail to beat the S&P 500 or Nasdaq on a pure performance basis. However, what they can do is significantly reduce the drawdown. While I obviously care about profit during backtesting, I prioritize the equity curve, Profit Factor (PF), and average win per trade. I’m looking for system stability—perhaps even running a Monte Carlo simulation to stress-test the results.