Bonjour à tous,
Serait-il possible (à priori oui) de différencier la couleur de l’indicateur (une troisième couleur) quand celui – ci est à l’intérieur des bandes de Bollinger.
Ceci afin d’attraper les phases de sur-achat ou sur-vente.
Bons trades à tous.
//PRC_FollowLine indicator 03.04.2020
//Nicolas @ www.prorealcode.com //converted from MT4 code //Sharing ProRealTime knowledge

// --- settings
//BBperiod      = 21
//BBdeviations  = 1
//ATRperiod     = 5
//UseATRfilter  = 0 //0=false ; 1=true  perso = 1
// --- end of settings
defparam calculateonlastbars = 150

BBUpper=average[BBperiod](close)+std[BBperiod]*BBdeviations
BBLower=average[BBperiod](close)-std[BBperiod]*BBdeviations
//-----------------------------------------------------------------------------------

if(close>BBUpper) then
BBSignal=1
endif
if(close<BBLower) then
BBSignal=-1
endif

if(BBSignal>0) then
if(UseATRfilter) then
TrendLine=low-averagetruerange[ATRperiod]
endif
if(not UseATRfilter) then
TrendLine=low
endif
if(TrendLine<TrendLine[1]) then
TrendLine=TrendLine[1]
endif
endif
//---
if(BBSignal<0) then
if(UseATRfilter) then
TrendLine=high+averagetruerange[ATRperiod]
endif
if(not UseATRfilter) then
TrendLine=high
endif
if(TrendLine>TrendLine[1]) then
TrendLine=TrendLine[1]
endif
endif
//---

iTrend=iTrend[1]
if(TrendLine>TrendLine[1]) then
iTrend=1
endif
if(TrendLine<TrendLine[1]) then
iTrend=-1
endif

if itrend>0 then
r=255   //0
g=0     //191
b=255   //255
else
r=72    //220
g=0     //20
b=255   //60
endif
///////////////////////////////////////////////////////////

///////////////////////////////////////////////////////////
return trendline coloured(r,g,b) style(dottedline1 ,5)

//The FollowLine indicator is a trend following indicator. The blue/red lines are activated when the price closes above the upper Bollinger band or below the lower one.

//Once the trigger of the trend direction is made, the FollowLine will be placed at High or Low (depending of the trend).

//An ATR filter can be selected to place the line at a more distance level than the normal mode settled at candles Highs/Lows.
 JS
JSParticipant
Senior
Salut,
Par exemple, vous pouvez faire dépendre les couleurs de :
- Close>BBUpper
- Close>BBLower et Close<BBUpper
- Close<BBLower
(Vous obtenez un autre type d’indicateur à cause de cela…)
// --- settings
BBperiod      = 20
BBdeviations  = 1
ATRperiod     = 5
UseATRfilter  = 0 //0=false ; 1=true  perso = 1
// --- end of settings
BBUpper=average[BBperiod](close)+std[BBperiod]*BBdeviations
BBLower=average[BBperiod](close)-std[BBperiod]*BBdeviations
//-----------------------------------------------------------------------------------
if(close>BBUpper) then
BBSignal=1
endif
If (Close<BBUpper) and (Close>BBLower) then
BBSignal=0
EndIf
if(close<BBLower) then
BBSignal=-1
endif
//---
if(BBSignal>0) then
if(UseATRfilter) then
TrendLine=low-averagetruerange[ATRperiod]
endif
if(not UseATRfilter) then
TrendLine=low
endif
endif
//---
if(BBSignal=0) then
if(UseATRfilter) then
TrendLine=(High+Low)/2-averagetruerange[ATRperiod]
endif
if(not UseATRfilter) then
TrendLine=(High+Low)/2
endif
endif
//---
if(BBSignal<0) then
if(UseATRfilter) then
TrendLine=high+averagetruerange[ATRperiod]
endif
if(not UseATRfilter) then
TrendLine=high
endif
endif
//---
if BBSignal>0 then
iTrend=1
endif
if BBSignal=0 then
iTrend=0
endif
if BBSignal=-1 then
iTrend=-1
endif

if iTrend>0 then
r=0   //0
g=255     //191
b=0   //255
EndIf
If iTrend=0 then
r=0
g=0
b=255
EndIf
If iTrend<0 then
r=255    //220
g=0     //20
b=0   //60
endif

return trendline coloured(r,g,b) style(dottedline1 ,5)//, BBUpper Coloured("Green"),BBLower Coloured("Red")
Merci JS pour ton aide.
Bon week end
JSParticipant
Senior
Salut,
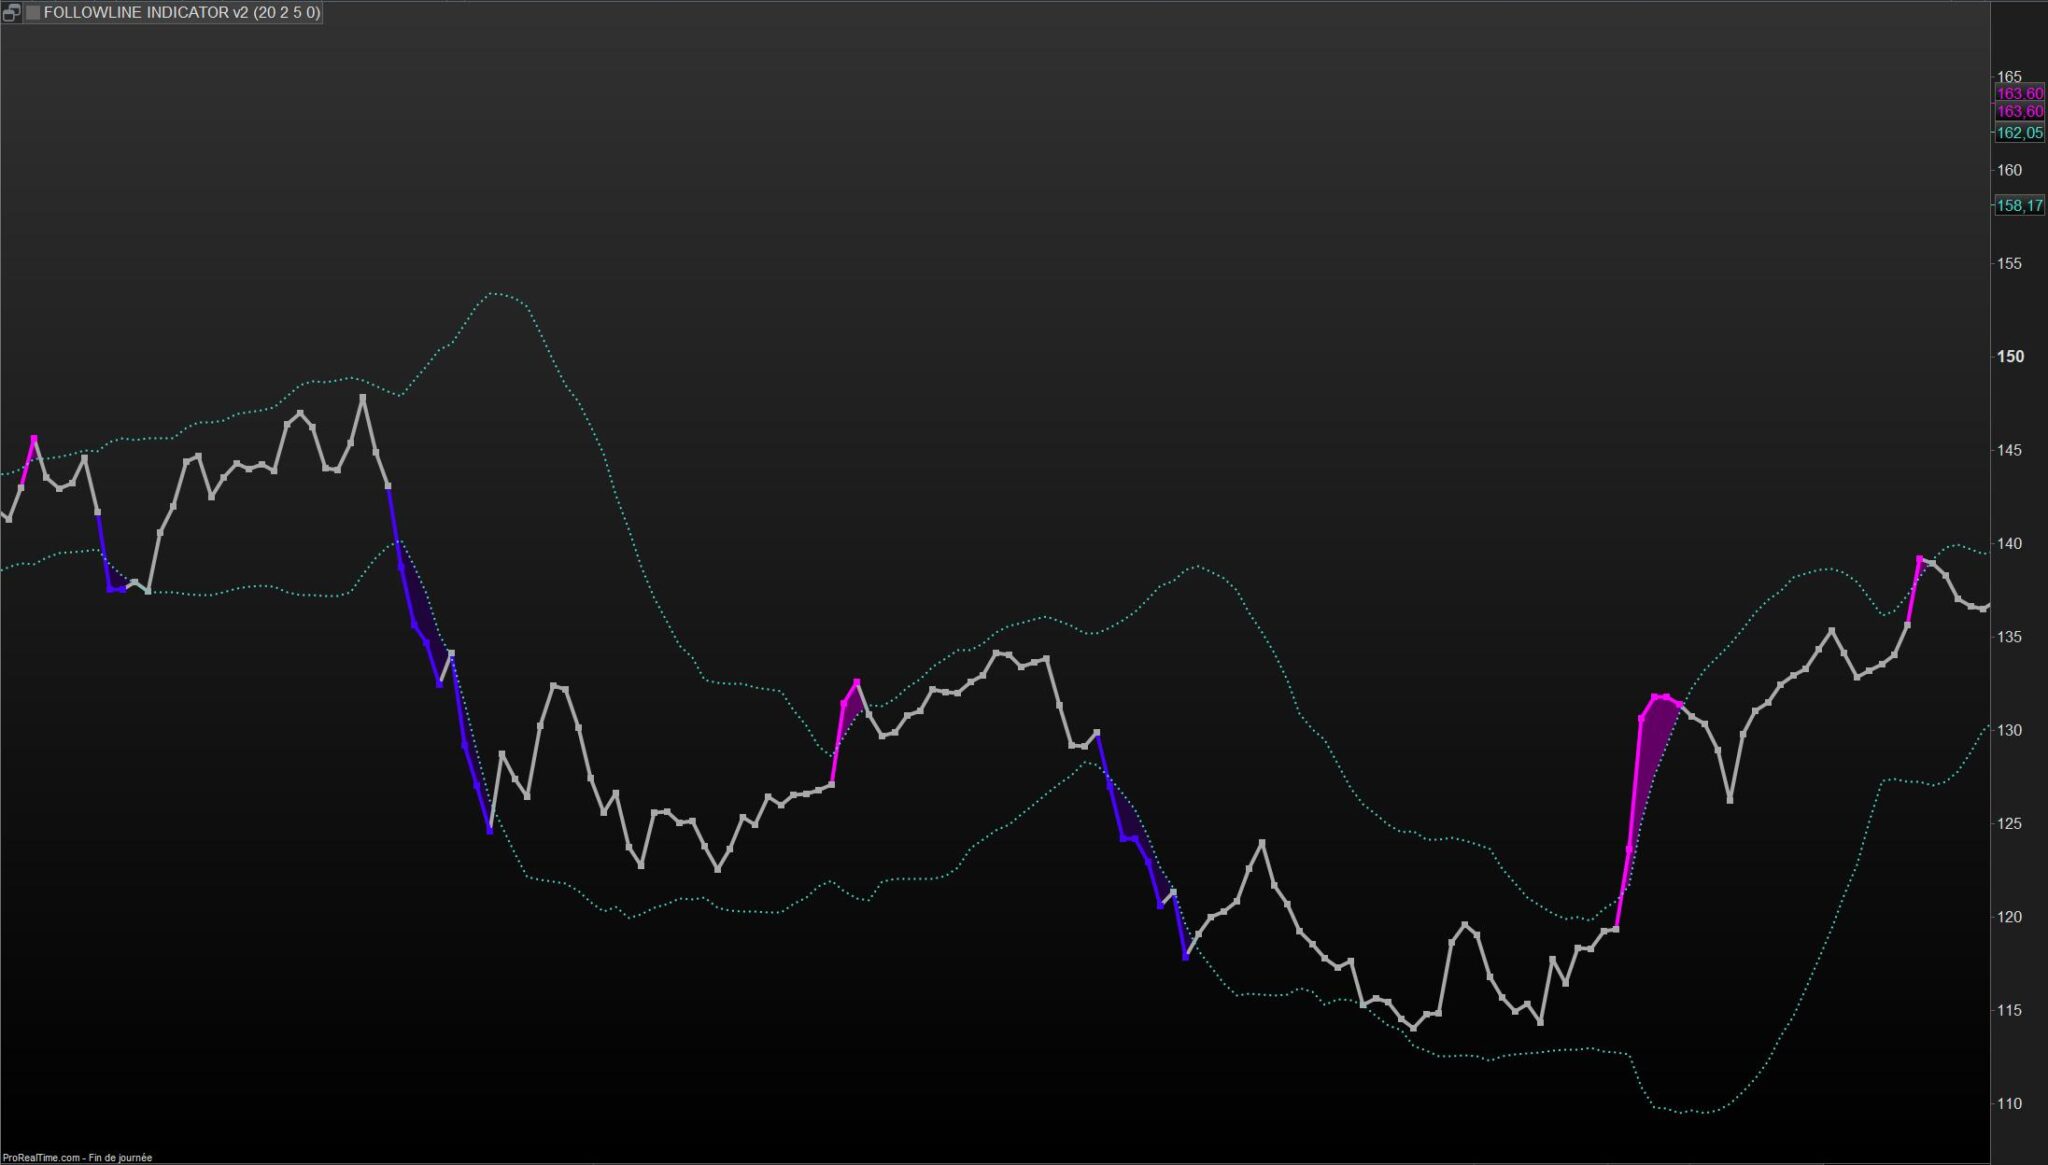
Je pense que ce graphique donne une image plus claire…
J’ai fait quelques ajustements, d’abord le « Low » a été utilisé lorsque le prix est passé au-dessus du BBUpper et maintenant j’utilise le « High » pour une image plus claire…
Il en va de même pour le prix en dessous du BBLower, il fonctionne maintenant avec le « Low » au lieu du « High »…
// --- settings
BBperiod      = 20
BBdeviations  = 1
ATRperiod     = 5
UseATRfilter  = 0 //0=false ; 1=true  perso = 1
// --- end of settings
BBUpper=average[BBperiod](close)+std[BBperiod]*BBdeviations
BBLower=average[BBperiod](close)-std[BBperiod]*BBdeviations
//-----------------------------------------------------------------------------------
if(close>BBUpper) then
BBSignal=1
endif
If (Close<BBUpper) and (Close>BBLower) then
BBSignal=0
EndIf
if(close<BBLower) then
BBSignal=-1
endif
//---
if(BBSignal>0) then
if(UseATRfilter) then
TrendLine=High-averagetruerange[ATRperiod]
endif
if(not UseATRfilter) then
If High<High[1] then
TrendLine=TrendLine[1]
else
TrendLine=High
endif
endif
endif
//---
if(BBSignal=0) then
if(UseATRfilter) then
TrendLine=(High+Low)/2-averagetruerange[ATRperiod]
endif
if(not UseATRfilter) then
TrendLine=(High+Low)/2
endif
endif
//---
if(BBSignal<0) then
if(UseATRfilter) then
TrendLine=Low+averagetruerange[ATRperiod]
endif
if(not UseATRfilter) then
If Low>Low[1] then
TrendLine=TrendLine[1]
else
TrendLine=Low
endif
endif
EndIf
//---
if BBSignal>0 then
iTrend=1
endif
if BBSignal=0 then
iTrend=0
endif
if BBSignal=-1 then
iTrend=-1
endif

if iTrend>0 then
r=0   //0
g=255     //191
b=0   //255
EndIf
If iTrend=0 then
r=0
g=0
b=255
EndIf
If iTrend<0 then
r=255    //220
g=0     //20
b=0   //60
endif

return trendline coloured(r,g,b) style(dottedline1 ,5)//, BBUpper Coloured("Green"),BBLower Coloured("Red")
Merci JS pour cet ajustement, est-ce que Nicolas qui est à l’origine du code pourrait donner son avis, l’indicateur tel quel ayant abandonné ses “plats”
pouvant donner lieu de support ou résistance.
Bon dimanche
Merci à JS !
Voici ma version, ajouter ces lignes juste avant RETURN :
if close<bbupper and close>bblower then
 r=168
 g=168
 b=168
endif
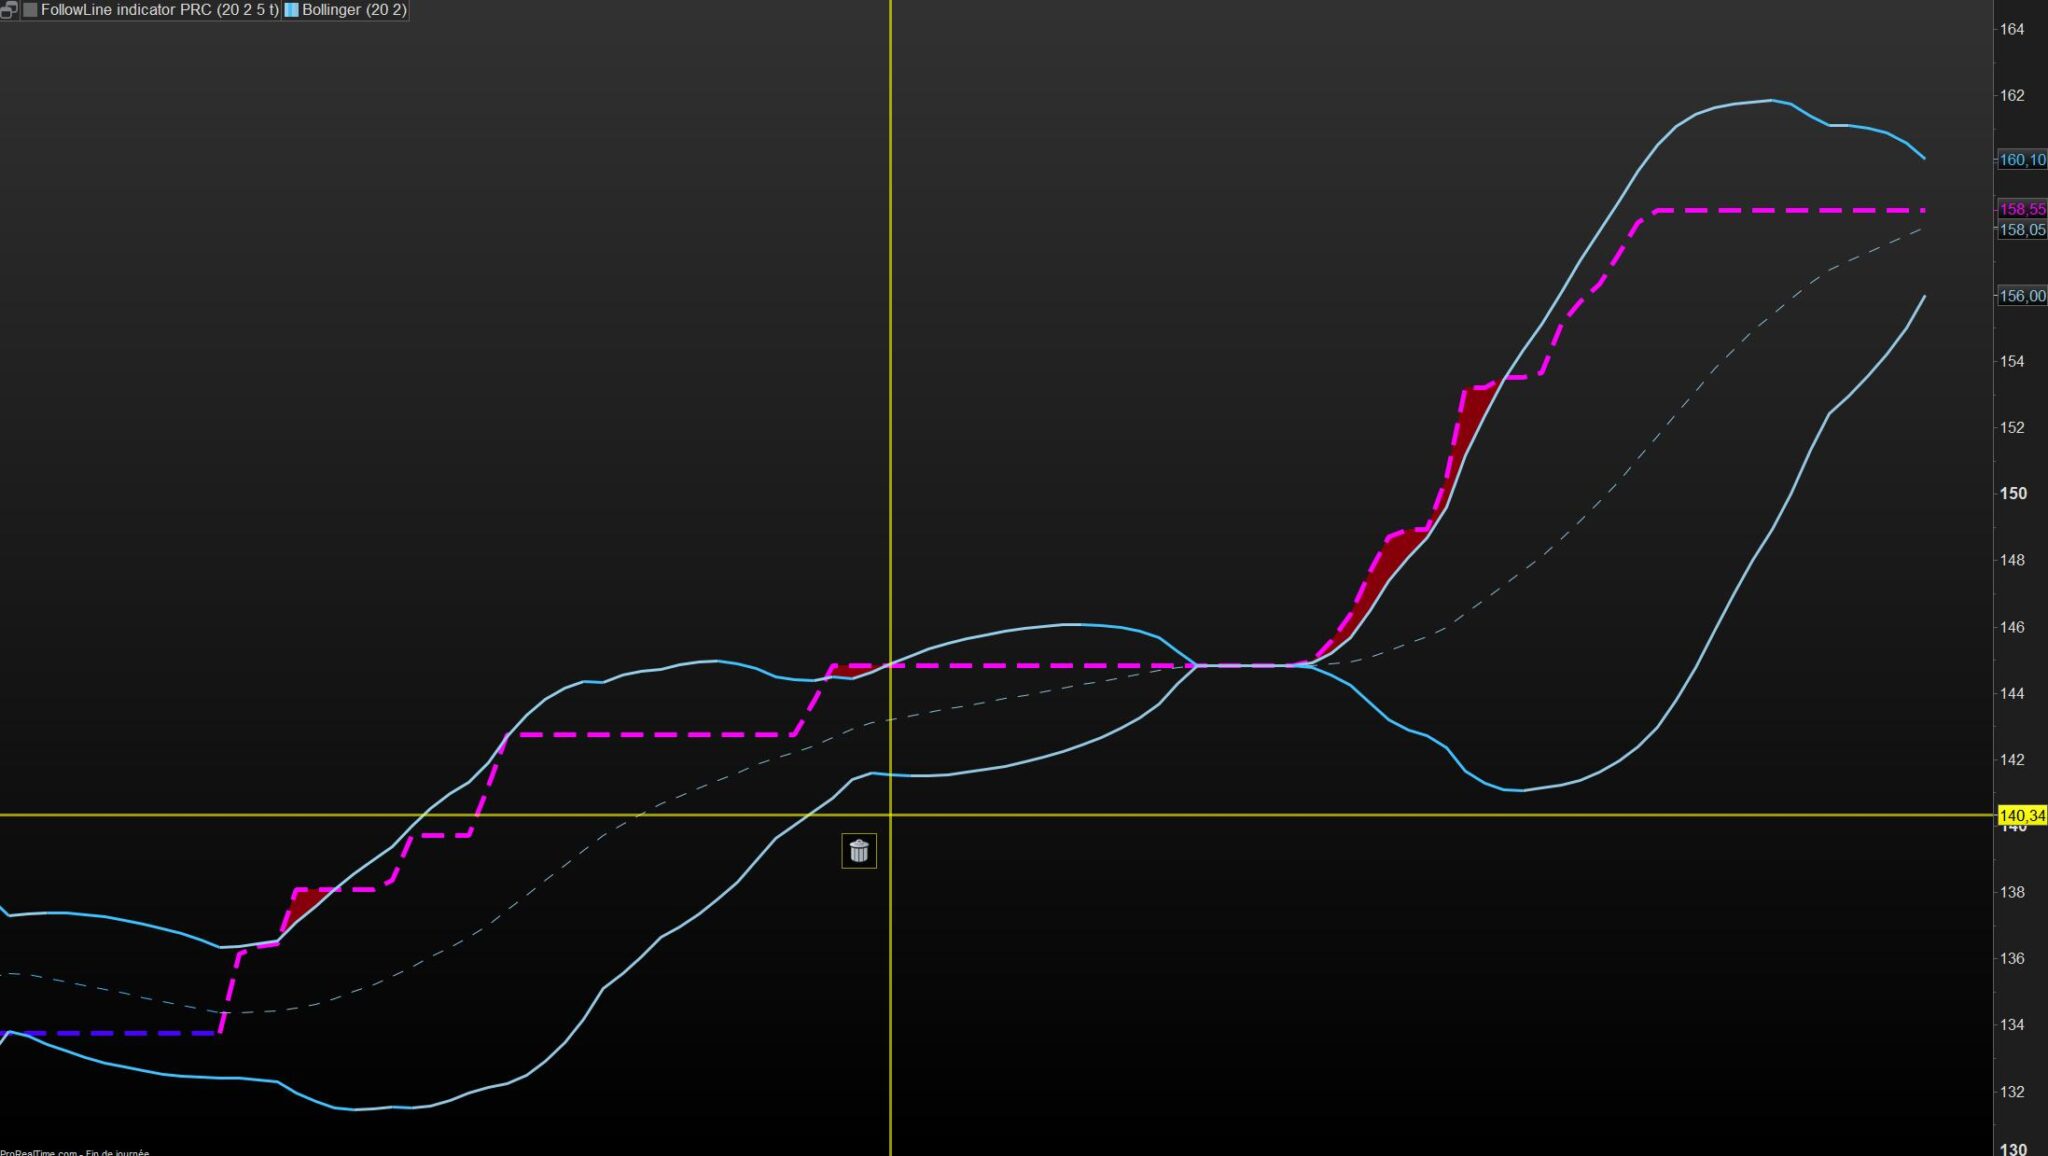
Super ! merci à vous deux, je joins une image du résultat sur Air Liquide comme exemple.
dommage que l’on ai plus les plats comme dans le code original de Nicolas.
Bonne journée et bons trades à tous.
Si tu utilises la version originale de l’indicateur, alors ça ne changera que la couleur et pas la forme de la courbe.
merci pour l’info, j’y vais de ce pas…
bonne journée
Après vérification c’est exactement ce que je souhaitais.
merci beaucoup à vous deux.
Bons trades