Hi Guys,
To continue on our last discussion on overfitting here are the first results on OOS
The idea was to evaluate/confirm that less variable = better OOS correlation
That’s why I test a very simple strategy based on SAR with only 2 variables (Signal if close crosses SAR)
As always strategy = Signal (SAR) + Analyse of the market structure + Money management
Backtest wasn’t famous with only 58,99 % winners on 556 trades ! 100 000 units EUR/USD 1 mn Sharpe Ratio 1.1.
There was the backtest of this week-end
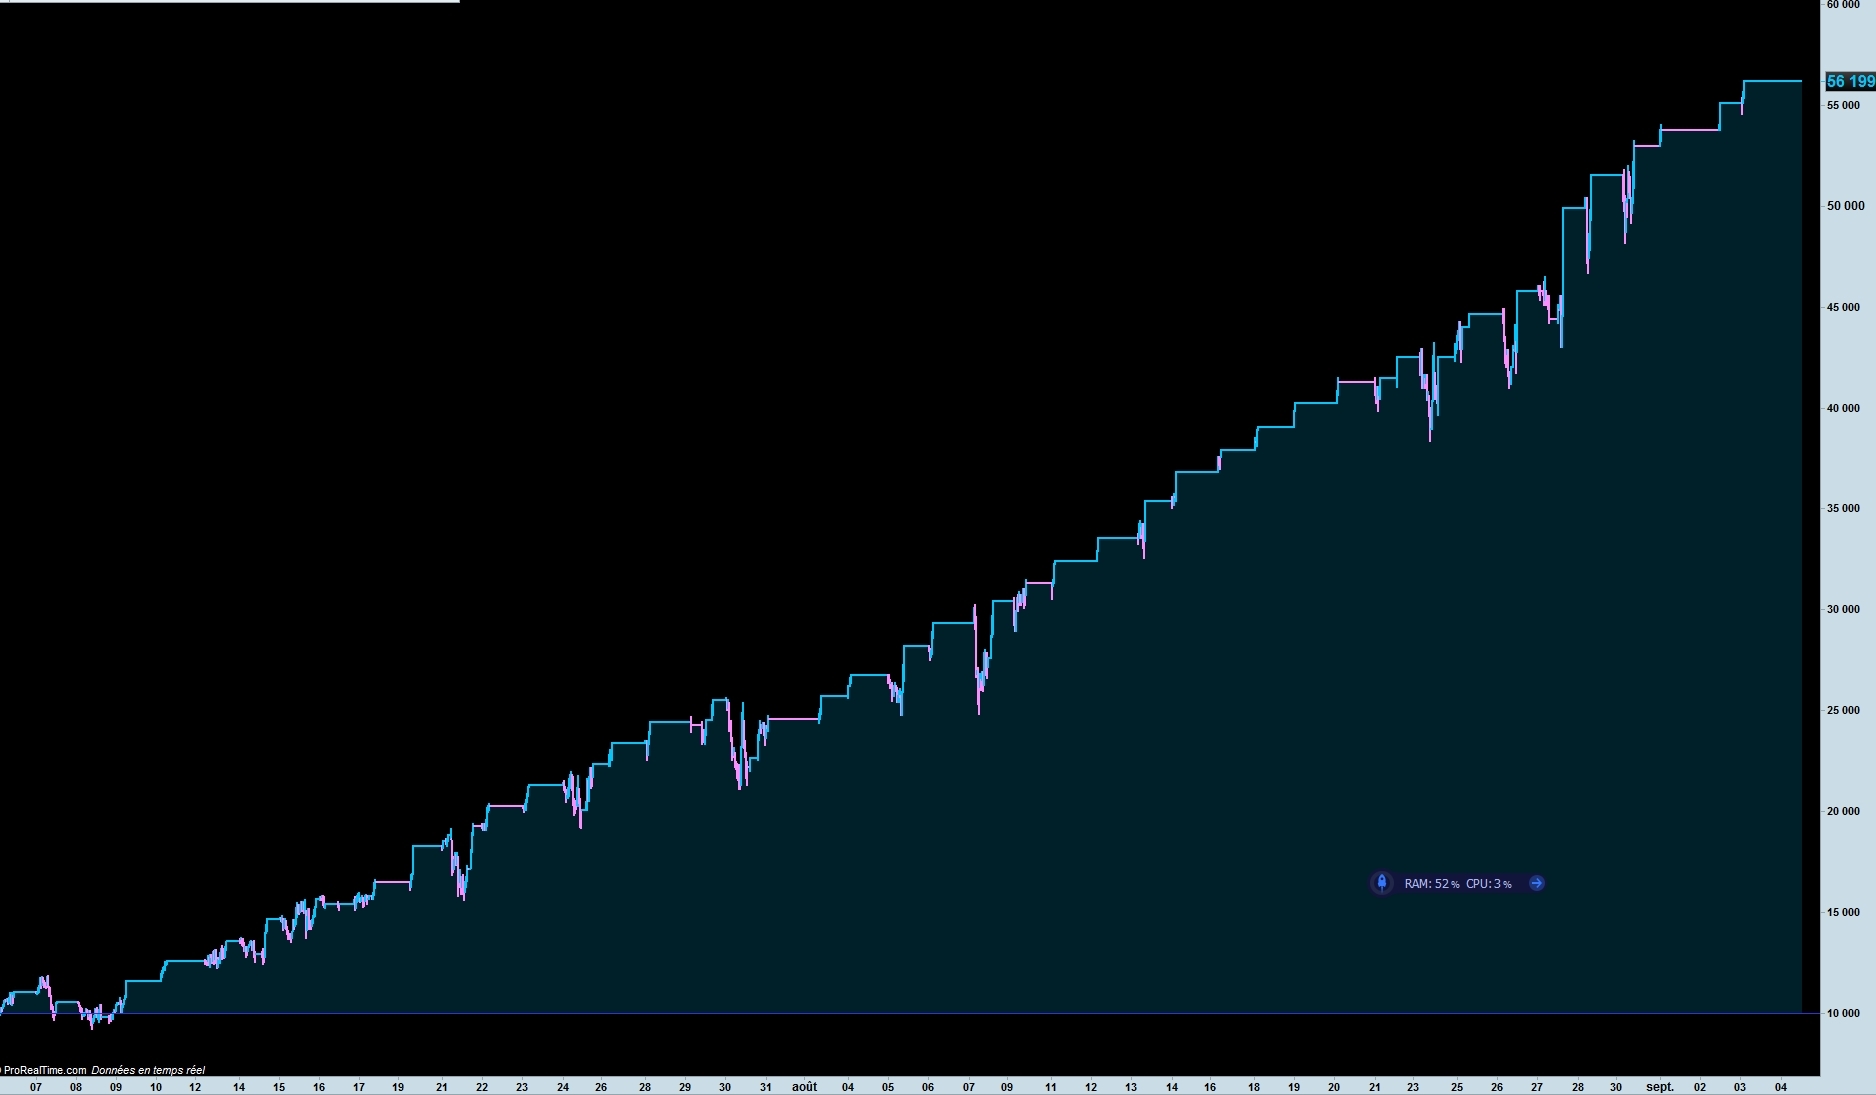
As you see on 100 000 units the equity curve wasn’t really linear (As usual with only few variables)
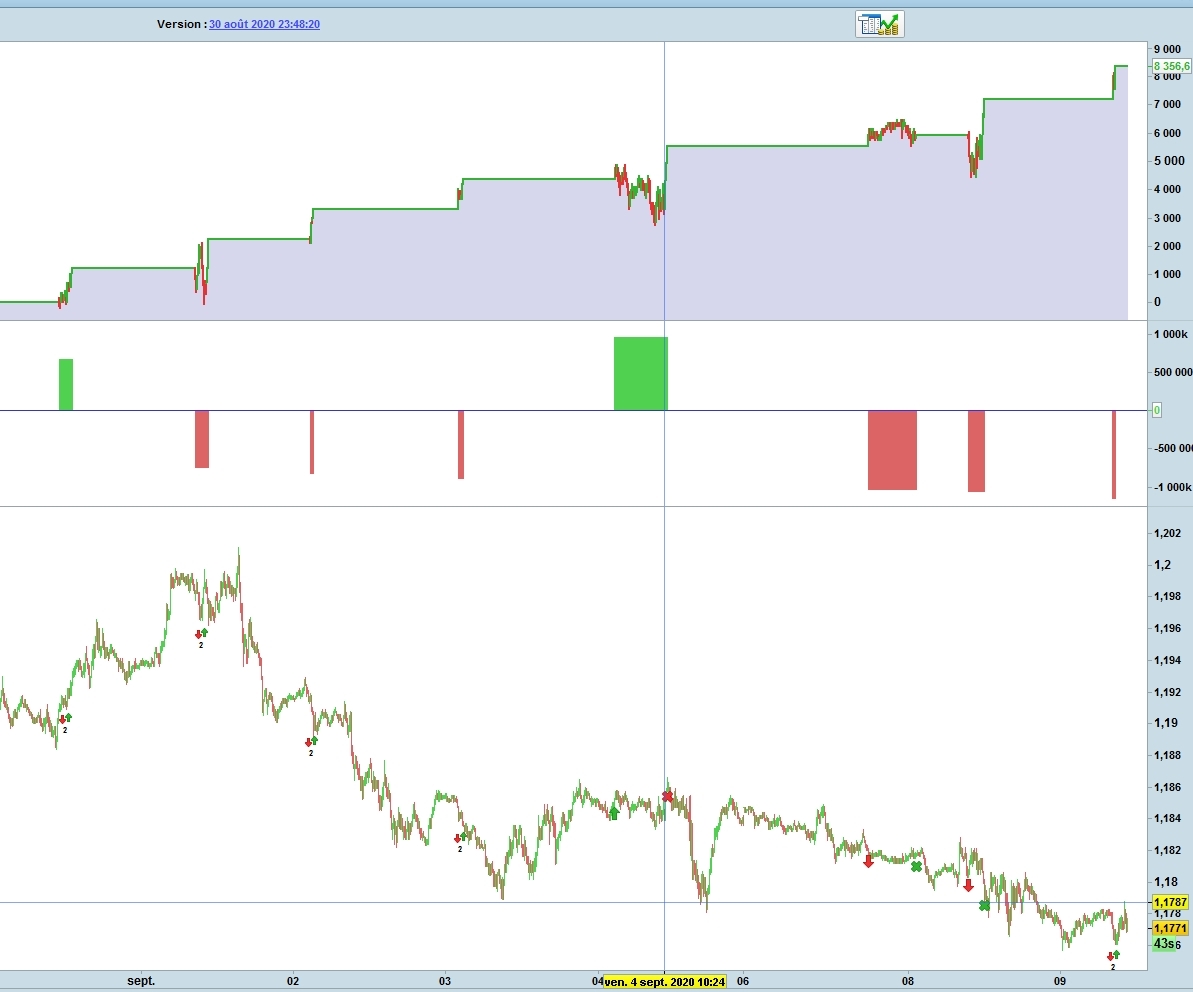
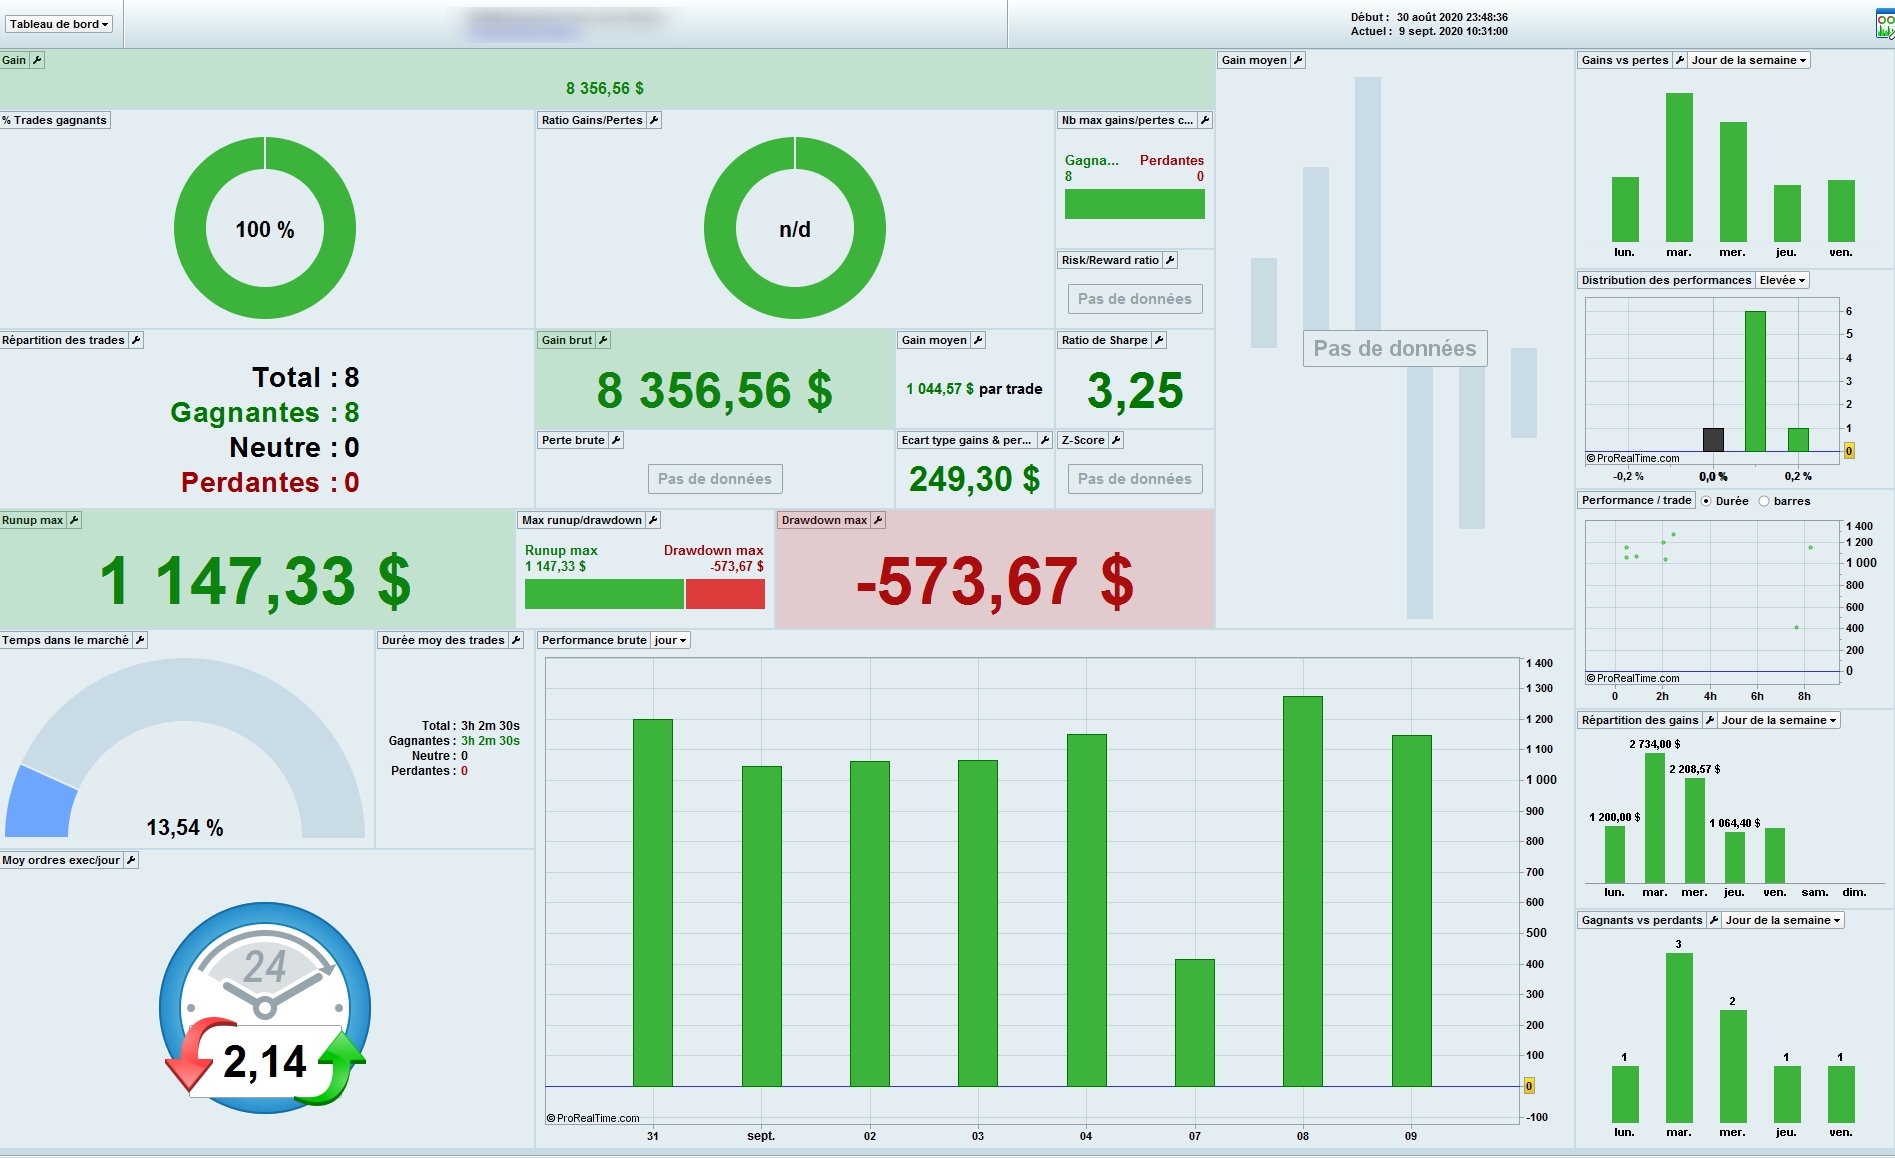
Results on (Demo) OOS :
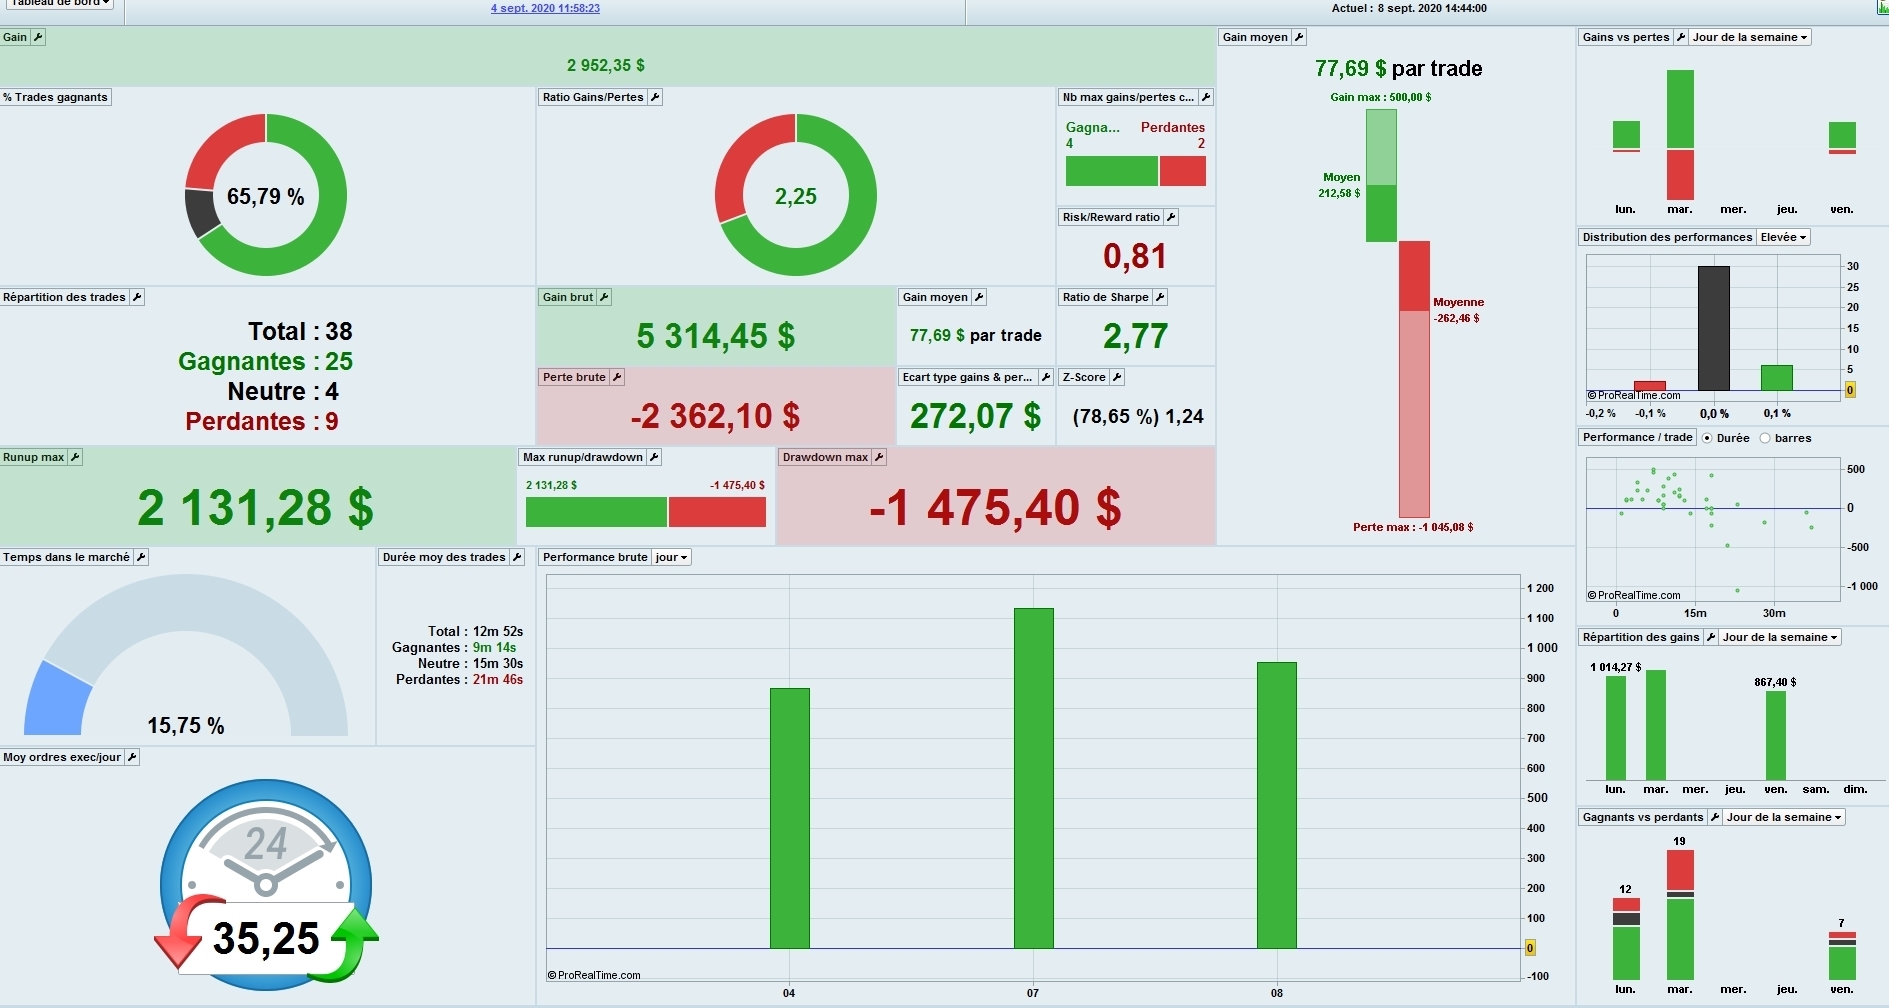
After 3 days and a risk of 10 % on equity we are at + 29.52 % (Some people will stop here now 🙂 )
65 % winners, not bad, but not really good, sharpe ratio 2.77 , very good but doesn’t mean a lot after only 3 days R/R of 2.25 (Necessary with a small % winners), and only 15.75 % time in market (good)
Strategy 1000 USD / Day as usual and after 3 days it’s ok
What we see here is that with a not good/not bad strategy actually it seems to work
We will see at the end of the week the results, but quite 1000 usd/day, who was the goal, is accomplished for now
I’m more and more sure that the strategy mean nothing (perhaps 30 %) but the money management, the 2d/3d optimization, simplify the code, the market structure is more important
If I have time I will use a stupid strategy on another post to give you all steps I use and see if we can transform a donkey into a racehorse 🙂
See U
Thanks for the update about your strategy development. If you don’t mind, please don’t insert the attachment into your post, thanks.
No problem Nicolas, I thought it was better to follow the post …
Stupid strategy like this one based on Stochastic (3 variables, one for signal, one for market structure, one for Money management)
// / Signal ///////
indicator1 = Stochastic[4*a,a](close)

c1 = (indicator1 CROSSES over average[5](indicator1))
c2 = (indicator1 CROSSES over average[5](indicator1))
With this kind of backtest
 Paul
PaulParticipant
Master
If I have time I will use a stupid strategy on another post to give you all steps I use and see if we can transform a donkey into a racehorse 🙂
That’s what i’am interest in. The steps regardless which strategy!
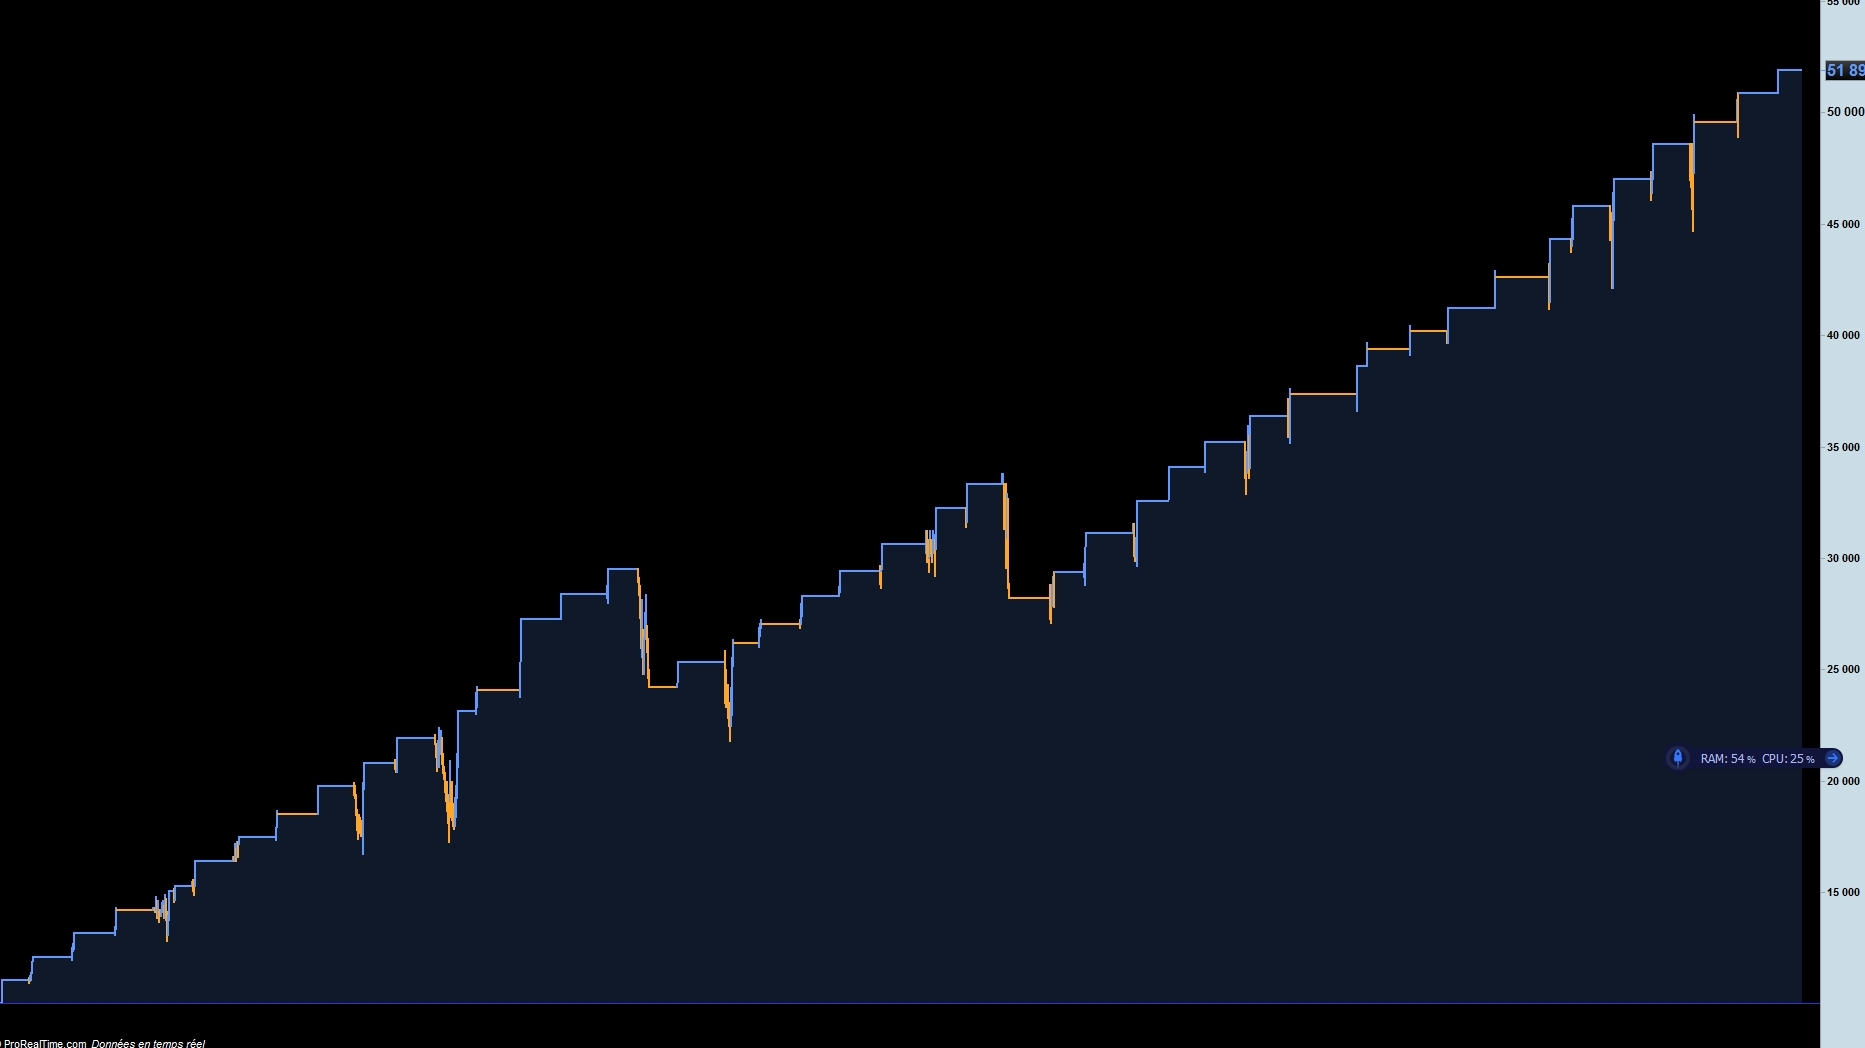
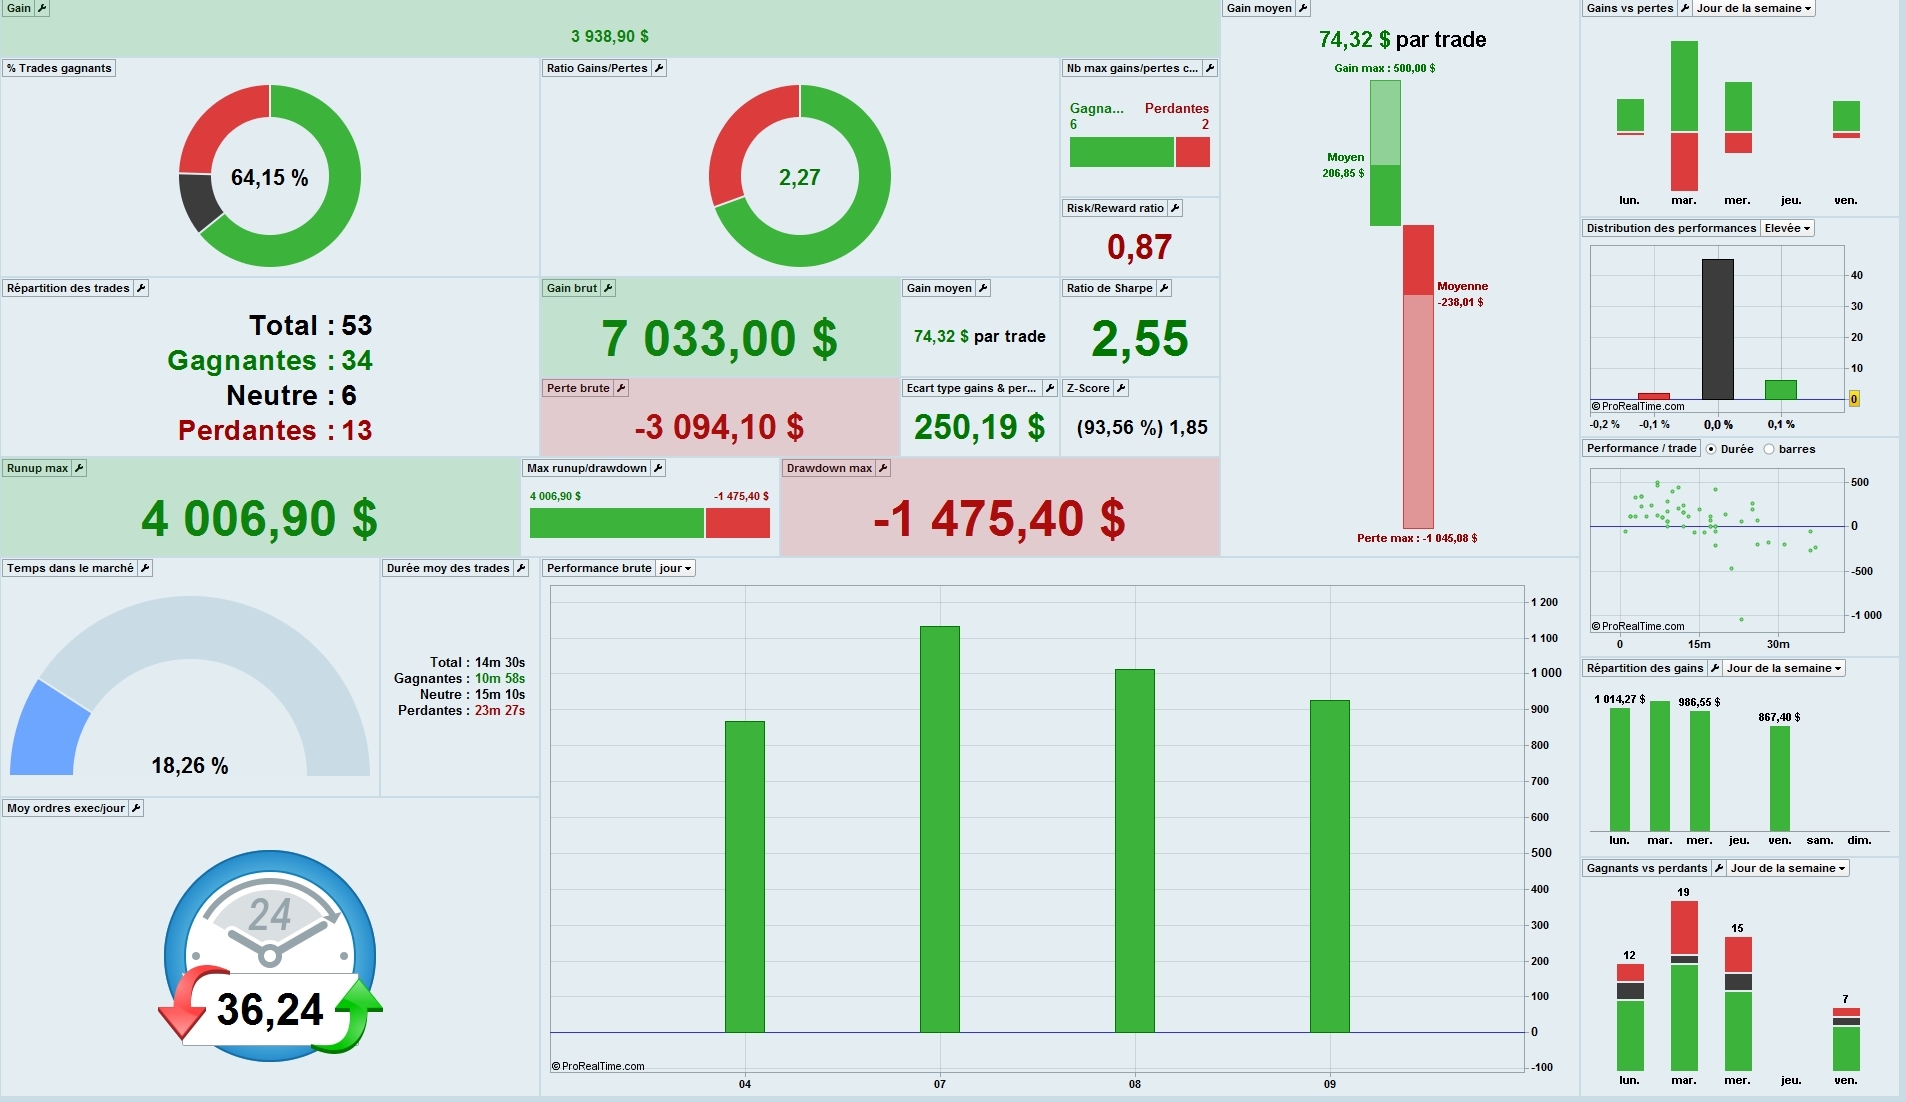
4th day of the Strategy : The system stopped because the goal of the day was reached
+39,38 % RR 0.87 Sharpe ratio of 2.55
We will see tomorrow now
PaulParticipant
Master
how do you define market structure & why you use a variable for money management and in what way?
nice results btw!
In this case market structure is defined by ADX (One variable for limit range/trend) and the variable of the money management is x*ATR
But we can use whatever we want to to define market structure and money management. So many possibilities …
Always the same type of thoughts as you can see on another algo who runs since 30 august = OOS demo results (don’t look at the amount of the winnings, who cares)
I’d like to test:-) Could you attach the .itf file please?
Thank you very much.
PaulParticipant
Master
Thanks Zilliq for the explanation. But still. Why optimising a value for money management? It could give perhaps distorted results while it could be used for something else.
As I previously said @Paul for me the Money management (Position size, Stop, Target and so on …) is THE thing many people forget (Many many people only speak about strategy, always strategy..) and for me probably one or the most important thing for Algo
That’s why I need to do a post with a stupid strategy and show why it is 😉
Is it possible to have the code for testing?:-)
thank you very much.
Sorry @danistuta it isn’t possible because there is different personal snippets and many months/years of work on it as you imagine
It’s a pity, but I can understand 😉