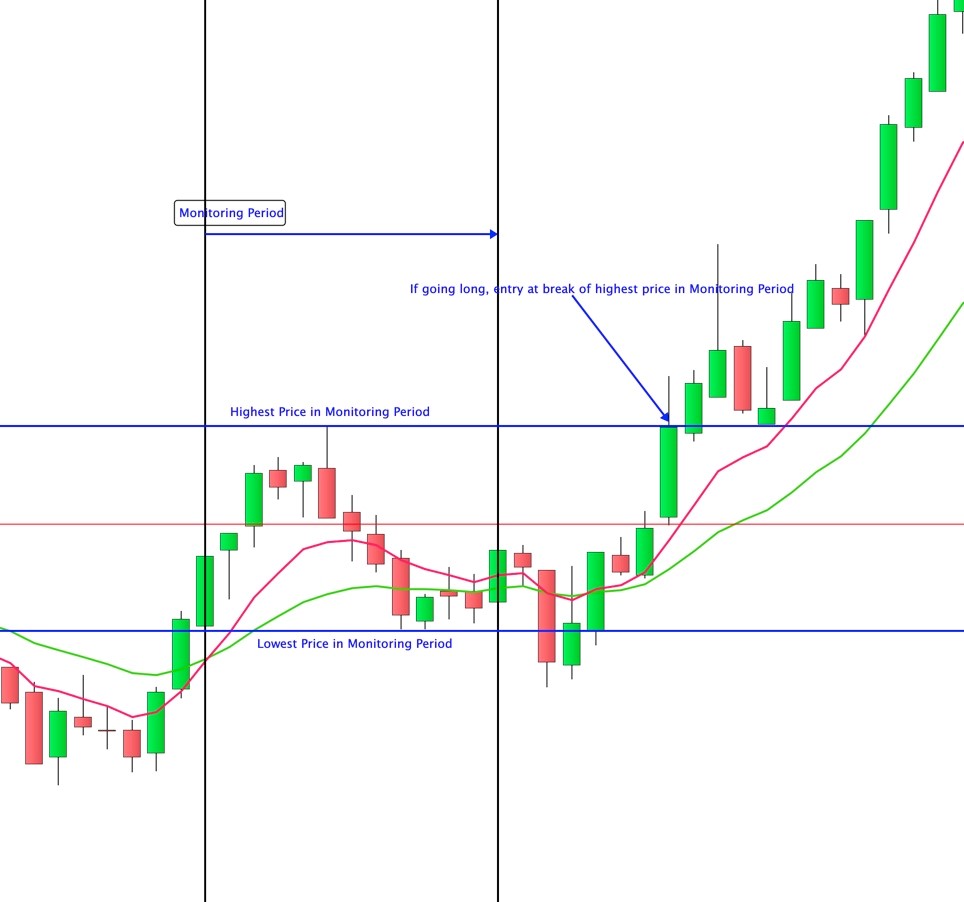
Hi I am wanting to develop a strategy that works manually but requires a specific time period to be monitored, but I amd not sure how to do this. For example:
Period to monitor (GMT) 10.00am to 11.00am
During that period I want to establish the highest point and the lowest point10am – 11am Highest Price
I would then enter the market long (If the trend is up) any time after 11am up until market close at the break of the highest price.
So in summary I need to find the highest and lowest prices between a specified time period and then set the entry points at the low or the high once these levels are broken after the end onf the monitoring period e.g. after 11am (say) and before market close.
Please see the annotated screen shot attached.
I hope this makes sense?
Thanks in anticiapation
Hi,
Unfortunately I cannot test it with realtime data since I don’t have it, but this indicator does just that. You select a start day of the month and a span on how many days it should monitor, once the monitor is over finds the highest and lowest and creates and indicator of those two values. You can probably try changing from Day to Hours and have a look if it works for you.
Once you have the indicator it is pretty easy to backtest it. Hope this helps.
Something like this perhaps.
starttime = 100000
endtime = 110000

if opentime = starttime then
hh = high
ll = low
endif

if time > starttime and time <= endtime then
hh = max(high,hh)
ll = min(low,ll)
endif

if not onmarket and time > endtime and (your long filter is true) then
buy 1 contract at hh stop
endif

if not onmarket and time > endtime and (your short filter is true) then
sellshort 1 contract at ll stop
endif
Thanks Vonasi, I’ll give it a whirl.
Hi Vonassi
This seems to work ok, thanks. However it forgot (apologies my fault!) to say that I only want it to trade once per day after 11am and vilid entry until the FTSE close. it then needs to reset for the following day.
Please see my initial code for a long trade below(Please note I run it on 1 min timeframe to enter):
// Definition of code parameters
DEFPARAM CumulateOrders = False // Cumulating positions deactivated

// Prevents the system from creating new orders to enter the market or increase position size before the specified time
noEntryBeforeTime = 110000
timeEnterBefore = time >= noEntryBeforeTime

// Prevents the system from placing new orders to enter the market or increase position size after the specified time
noEntryAfterTime = 161500
timeEnterAfter = time < noEntryAfterTime

// Prevents the system from placing new orders on specified days of the week
daysForbiddenEntry = OpenDayOfWeek = 6 OR OpenDayOfWeek = 0

//To Determine an Uptrend using fitkers
// Filter 1 - 4 Hour Chart High > 20 EMA
TIMEFRAME(1 Day,updateonclose)
indicator1 = ExponentialAverage[8](close)
indicator2 = ExponentialAverage[20](close)
c1 = (indicator1 > indicator2)
TIMEFRAME(default)
//Define period between 10am & 11am
starttime = 100000
endtime = 110000

if opentime = starttime then
hh = high
ll = low
endif
//determines the highest high & lowest low during the period
if time > starttime and time <= endtime then
hh = max(high,hh)
ll = min(low,ll)
endif

if not onmarket and time > endtime and c1 AND timeEnterBefore AND timeEnterAfter AND not daysForbiddenEntry THEN
buy 1 contract at hh+1 stop
endif

// Stops and targets
sl=ll-(hh-ll)
SET STOP pLOSS sl
SET TARGET pPROFIT 30
Perhaps like this? Not tested and I’ve had a couple of glasses of wine!
// Definition of code parameters
DEFPARAM CumulateOrders = False // Cumulating positions deactivated

// Prevents the system from creating new orders to enter the market or increase position size before the specified time
noEntryBeforeTime = 110000
timeEnterBefore = time >= noEntryBeforeTime

// Prevents the system from placing new orders to enter the market or increase position size after the specified time
noEntryAfterTime = 161500
timeEnterAfter = time < noEntryAfterTime

// Prevents the system from placing new orders on specified days of the week
daysForbiddenEntry = OpenDayOfWeek = 6 OR OpenDayOfWeek = 0

//To Determine an Uptrend using fitkers
// Filter 1 - 4 Hour Chart High > 20 EMA
TIMEFRAME(1 Day,updateonclose)
indicator1 = ExponentialAverage[8](close)
indicator2 = ExponentialAverage[20](close)
c1 = (indicator1 > indicator2)
TIMEFRAME(default)
//Define period between 10am & 11am
starttime = 100000
endtime = 110000

if opentime = starttime then
hh = high
ll = low
endif
//determines the highest high & lowest low during the period
if time > starttime and time <= endtime then
hh = max(high,hh)
ll = min(low,ll)
endif

if not flag and time > endtime and c1 AND timeEnterBefore AND timeEnterAfter AND not daysForbiddenEntry THEN
buy 1 contract at hh+1 stop
endif

if onmarket or strategyprofit<>strategyprofit[1] then
flag = 1
endif

if dayofweek <> dayofweek[1] then
flag = 0
endif

// Stops and targets
sl=ll-(hh-ll)
SET STOP pLOSS sl
SET TARGET pPROFIT 30
Thanks again – giving it a go today – if it works Vonassi, I’m going to try programming with wine!!!
Steve
Thanks Vonassi, this seems to work a treat in back testing.
Steve
No problem but it is Vonasi with one ‘s’ otherwise my name becomes ‘V-oyaging O-n A S-maller and S-maller I-ncome!
Ha -apologies Vonasi, I must have a typing stammer!!
I’ve developed this code further using different conditions for detecting trends, hence confirming entry over different timeframe. However looking at the results it seems that the 1 hour momentum filter I have used seems to take a precedence i.e. several of the trades start exactly on the hour?
You will also note that I have used the “Starttime & Endtime” twice one on the default timeframe and once on the 4 hour timeframe. These conditions define the period when I want to determine the Highest Point or Lowest Point (hh &ll) during that period for my entry levels. I have done this twice as I had an anomaly where the code entered into a trade much later in the day, not at the previously defined price entry level (ll) but when the 8 ema crossed under the 20ema? This seemed to be a fix, although I didn’t understand why it would do that in the first place.
So my question to you good people is:
- Is there a preferential order in which conditions for entry observe
- Is there a better way for my trend detection filters to determine downtrend i.e.
- Check 4 Hour period for 8EMA < 20 EMA
- Check 20 hour OBV > 20 EMA
- 3 Check 1 Hour Momentum >horizontal zero line
- THEN enter at previously determined entry level at ll ONCE per day only
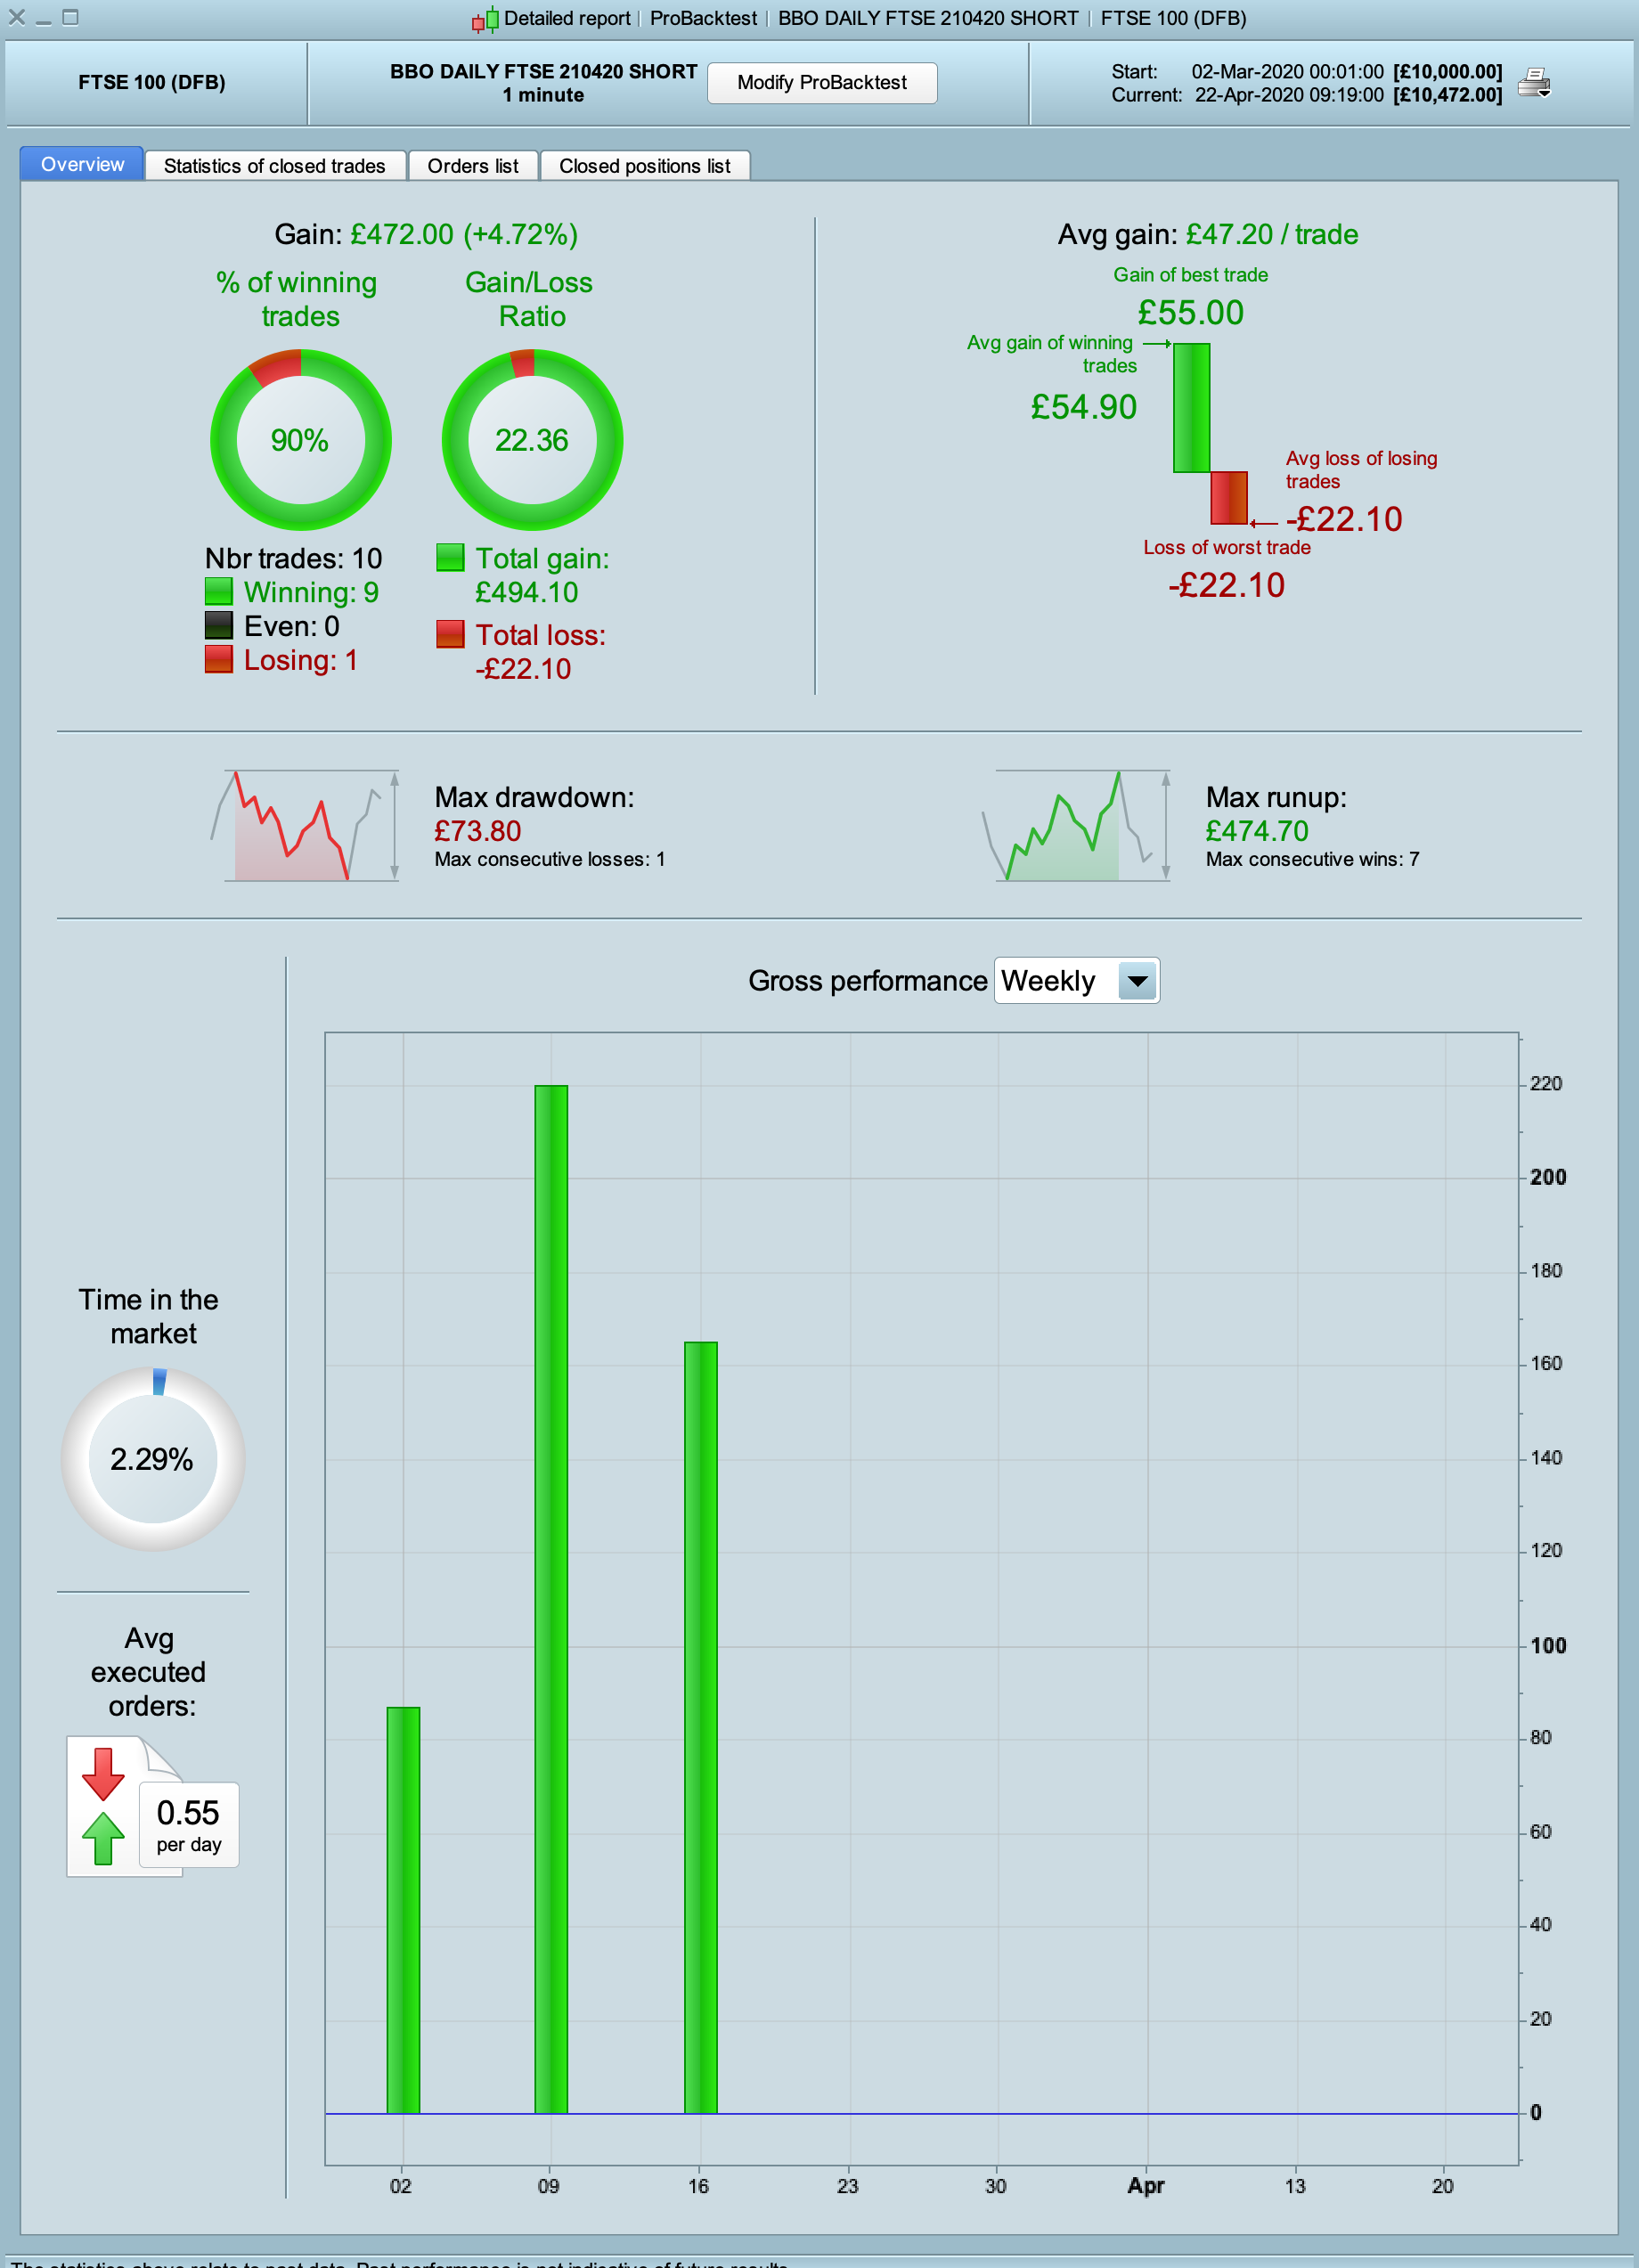
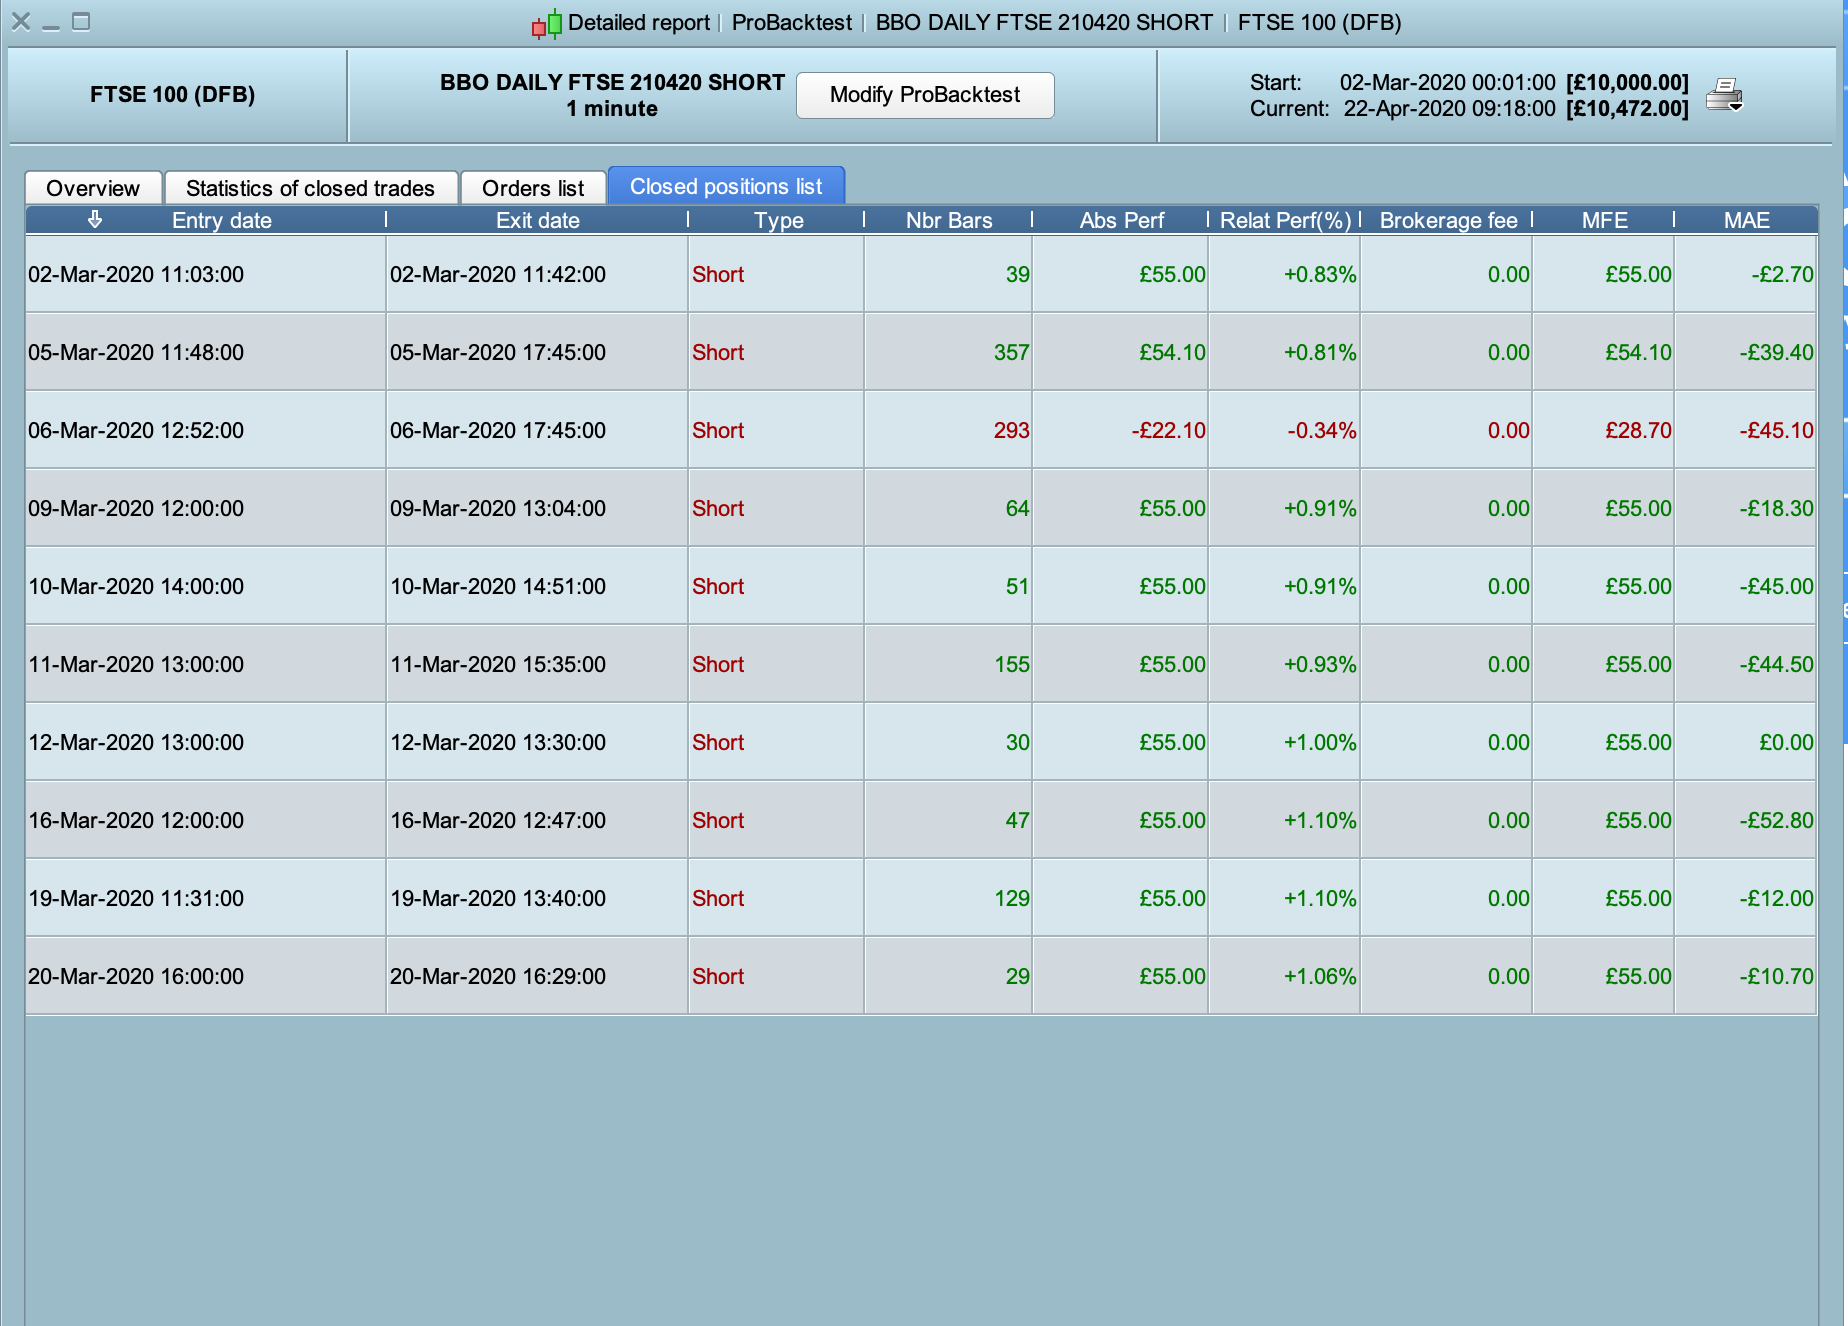
Hope this makes sense and I have loaded up my current FTSE code (running on 1 min chart) and the screenshot of the results
Steve
//-------------------------------------------------------------------------
// Main code : BBO  FTSE Short 200420 - Trend filters and entry on Lowest Point within 10am to 11am Period
//-------------------------------------------------------------------------
// Definition of code parameters
DEFPARAM CumulateOrders = False // Cumulating positions deactivated
DEFPARAM FLATBEFORE = 110000
// Cancel all pending orders and close all positions at the "FLATAFTER" time
DEFPARAM FLATAFTER = 174500
// Prevents the system from creating new orders to enter the market or increase position size before the specified time
noEntryBeforeTime = 110000
timeEnterBefore = time >= noEntryBeforeTime

// Prevents the system from placing new orders to enter the market or increase position size after the specified time
noEntryAfterTime = 161500
timeEnterAfter = time < noEntryAfterTime

// Prevents the system from placing new orders on specified days of the week
daysForbiddenEntry = OpenDayOfWeek = 6 OR OpenDayOfWeek = 0

 //Period during which the hh & ll are determined
starttime = 100000
endtime = 110000

//Filters to determin downtrend
timeframe (4 hour ,updateonclose)
starttime1 = 100000
endtime1 = 110000
if opentime = starttime1 then
endif
if time > starttime1 and time <= endtime1 then
endif
indicator1 = ExponentialAverage[8](close)
indicator2 = ExponentialAverage[20](close)
c1 = (indicator1 < indicator2+50)
timeframe(20 hour,updateonclose)
indicator9 = OBV(close)
indicator10 = ExponentialAverage[16](OBV(close))
c10 = (indicator9 < indicator10 -250 )
timeframe (1 hour, updateonclose)
indicator11 = Momentum[12](close)
c11 = (indicator11 <= 0)
indicator12 = Momentum[12](close)
c12 = (indicator12 <= indicator12[1])

timeframe (default, updateonclose)

if opentime = starttime then
hh = high
ll = low
endif
//determines the highest high & lowest low during the period
if time > starttime and time <= endtime then
hh = max(high,hh)
ll = min(low,ll)
endif
//Long Entry
if not flag and time > endtime and endtime1 AND timeEnterBefore AND timeEnterAfter AND not daysForbiddenEntry and c1 and c10 and c11 and c12 THEN
sellshort 1 contract at ll-1 stop
endif
if onmarket or strategyprofit<>strategyprofit[1] then
flag = 1
endif

if dayofweek <> dayofweek[1] then
flag = 0
endif
// Stops and targets
//sl=ll-(hh-ll)
sl = 55//62//x1
tp = 55//70//y1
SET STOP pLOSS sl
SET TARGET pPROFIT tp
I’ve only glanced at it but this does not look right:
timeframe (4 hour ,updateonclose)
starttime1 = 100000
endtime1 = 110000
The four hour chart will have candles at 000000 040000 080000 120000 and so there is no 100000 candle.