Hi
I was wondering if it was possible to convert such indicator for PRT: this is a useful tool to build a portfolio by ranking stocks by strength based on Andreas Clenow’s book “Stocks on the Move” .
Here’s the strategy:
1. Determine the 90 day annualized exponential regression slope for each stock
2. Determine the 90 day R-squared value for each of the stock
3. Multiply #1 * #2 and then sort from highest to lowest —> screener PRT
4. Buy the top stocks based on the formula ((AccountValue * 0.001)/ATR(20))
Thanks.
//@version=4
// This source code is subject to the terms of the Mozilla Public License 2.0 at https://mozilla.org/MPL/2.0/

// Exponential Regression Slope Annualized with R-squared Histogram
// by SparkyFlary

study(title="Exponential Regression Slope Annualized with R-squared Histogram", shorttitle="Exponential Regression Slope Annualized with R-squared", format=format.percent, overlay=false)

length = input(90, title="Slope length")
rSquaredThreshold = input(0.0, title="R-squared threshold", minval=0, maxval=1)
withRsquared = input(true, title="Multiply by R-squared?")
withAnnualize = input(true, title="Annualize slope?")
daysInYear = input(252, title="Number of bars in a year(if slope is annualized)")
src = input(close, title="Source")

//natural log of price
nlPrice = log(src)

//alexgrover's regression slope code
x = bar_index
y = nlPrice
x_ = sma(x,length)
y_ = sma(y,length)
mx = stdev(x,length)
my = stdev(y,length)
c = correlation(x,y,length)
slope = c * (my/mx)
//inter = y_ - slope*x_
//reg = x*slope + inter

exp_slope = slope
annualized_slope = (pow(exp(slope),daysInYear) - 1) * 100
rSquared = pow(correlation(cum(1), nlPrice, length), 2)
slopeAnnualized_with_Rsquared = withAnnualize ? annualized_slope * (withRsquared ? rSquared : 1) : exp_slope * (withRsquared ? rSquared : 1)

trend = rSquared>rSquaredThreshold
rising = slopeAnnualized_with_Rsquared>slopeAnnualized_with_Rsquared[1]
falling = slopeAnnualized_with_Rsquared<slopeAnnualized_with_Rsquared[1]
up = slopeAnnualized_with_Rsquared>0
down = slopeAnnualized_with_Rsquared<0

up_rising_color = color.new(color.green, 0)
up_falling_color = color.new(color.green, 50)
down_falling_color = color.new(color.red, 0)
down_rising_color = color.new(color.red, 50)

col = trend and up and rising?up_rising_color:trend and up and falling?up_falling_color:trend and down and falling?down_falling_color:trend and down and rising?down_rising_color : color.gray

plot(slopeAnnualized_with_Rsquared, title="Annualized slope x R-squared", style=plot.style_histogram, color = col, linewidth=3)
Vinks_o_7 – Please use the ‘Insert PRT Code’ button even when inserting non PRT code as it differentiates it from the other text and makes your post far more readable. Your post has been edited.
Please post a picture of the indicator.
Hi Nicolas,
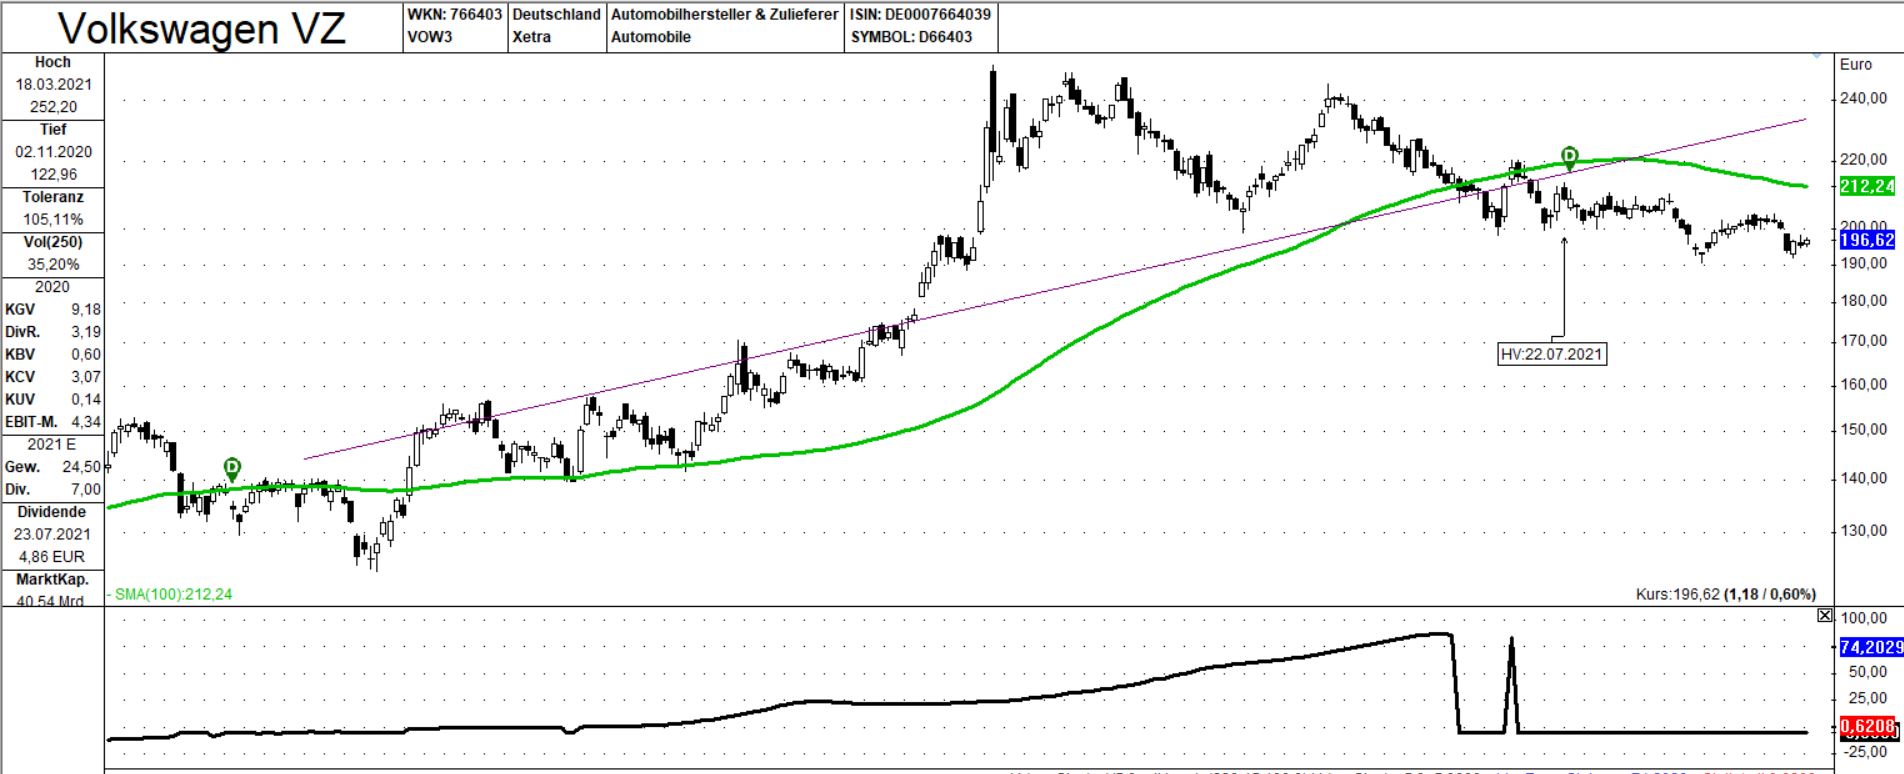
Here’s a picture and a direct link to the page
The idea is to use it as a screener to make a stock selection.
Thanks again.
I can help you well, but help me in return by posting the picture yourself in this topic please. I have a lot of things to answer again this morning. Thank you.
Hi Nicolas
Thanks for your feedback.
I did it two times but for whatever reason, the pic did not show up.
I uploaded a screen capture (PNG file, 75ko)…same problem.
If you click the link, you can see the picture/detail: https://fr.tradingview.com/script/QWHjwm4B-Exponential-Regression-Slope-Annualized-with-R-squared-Histogram/
too bad that nobody’s interested in this winning strategy…
Hello Nicholas
It would be really really nice if you could implement this screener. Actually you don’t need the indicator itself in the chart, but as a criterion to screen a list with it.
The annualized exponential regression multiplied by the R² value is then simply the sorting criterion, similar to how you can sort lists by RSL. However, if the stock price intersects the 100 day average, the indicator gets the value 0 and you get out of a stock.
Advantage of the method of Clenow is that one finds little volatile values, which run like clockwork upward.
Many thanks in advance.
Greetings Ronny
Translated with http://www.DeepL.com/Translator (free version)
Hi,
Here is the code for the screener (might be incorrect so please check). Note that only the 50 first results are returned in the screener. It makes it difficult to verify that the stocks you own are still in the 20% of the stock universe. There are workarounds though (such as creating multiple screeners with a condition on the momentum value).
Cheers
Jerome
val = (EXP(250*LOG(EXP(LinearRegressionSlope[90](log(close)))))-1)*R2[90](log(close))
capi = Average[90](Volume)*Average[90](Close) > 50000
bullish = close > Average[100](Close)
testVol = abs(close/close[1]-1) > 0.15
volatile = summation[90](testVol)
penny = Close < 5
SCREENER[bullish and capi and  not volatile and not penny](val as "Momentum")
Would it still be possible to sort the results in descending order by the value ExpRegression*R2? (I think this should be the variable “val”)
The largest value above
Sorry now i see val = Momentum
but I actually forgot one point.
Can you still exclude stocks that have made a gap of more than 15% in the last few days?
Thank you very much for your work
As you can see from line 7, VAL is the sorting criterion in use.
As to descending order, you can choose the preferred order clicking the title of the column in ProScreener.