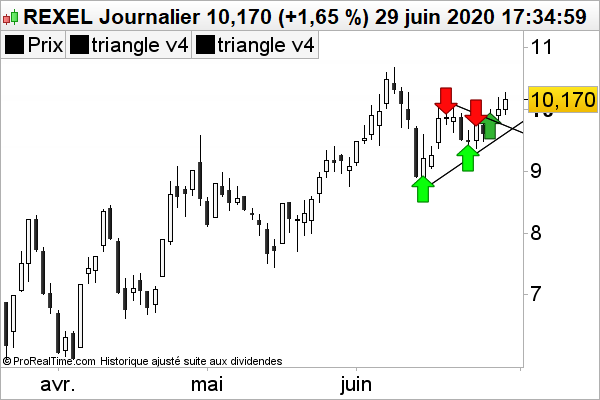
[attachment file=”137759″]
cela marche nickel pour:
DRAWsegment(barindex, close, barindex[10],close[5],barindex+10)
pour votre derniere reponse
Il suffit de créer une fonctionne affine et de tester le nouveau niveau calculé sur chaque barre. Le coefficient directeur étant celui-ci : (distance du prix parcourus) / (quantité de chandeliers)
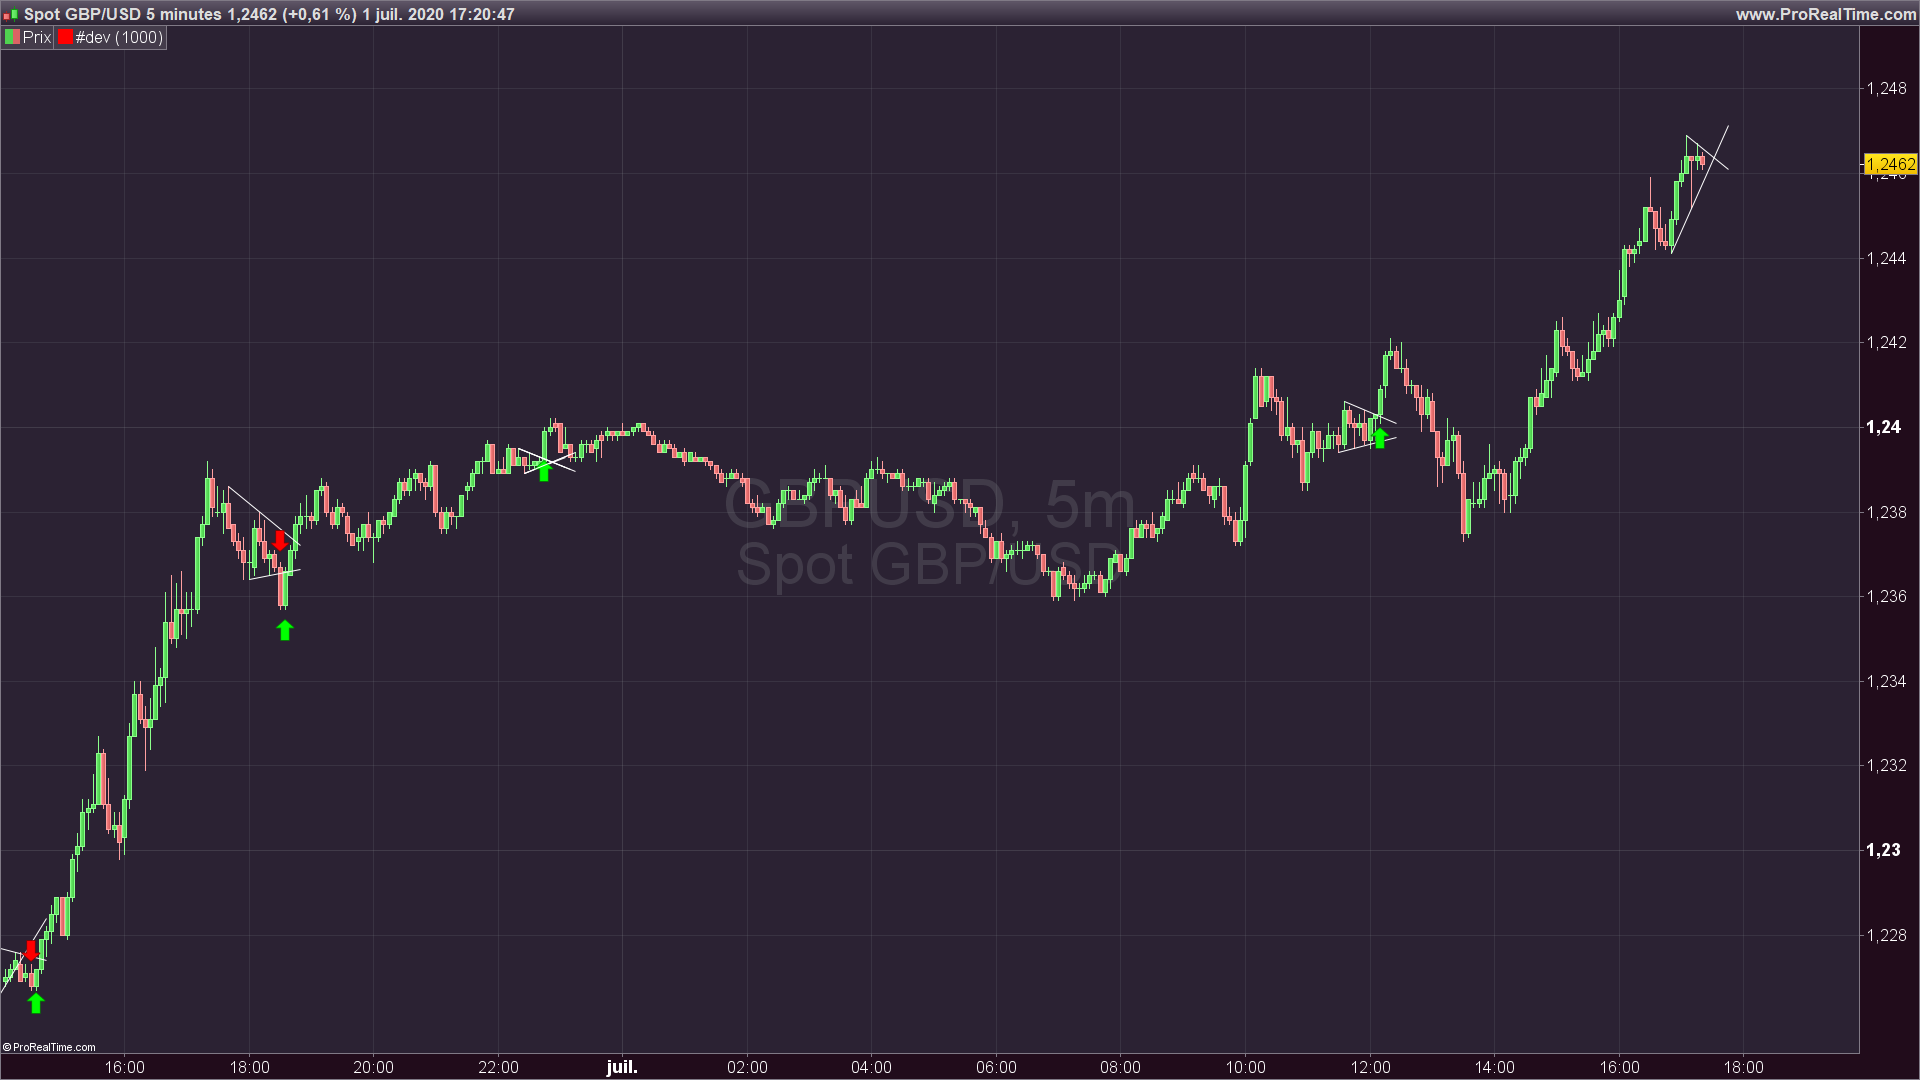
dans votre code “PRC_triangle Wedge pattern” je ne vois pas les buystop et sellstop
//PRC_triangle Wedge pattern | screener
//12.09.2016
//Nicolas @ www.prorealcode.com
//Sharing ProRealTime knowledge
// modified by Yannick v4 31.10.2017 avec affichage des buystop et sellstop level
defparam drawonlastbaronly = true
//fractals
cp = 1//4 //lookback
//volatilty
//HistVolatily=HistoricVolatility[20](close)
//Detection High
if high[cp] >= highest[(cp)*2+1](high) then
LLH = 1
else
LLH = 0
endif
//Value of last High
if LLH = 1 then
High1 = High2[1]
High1bar = High2bar[1]
High2 = high[cp]
High2bar = barindex[cp]
endif
//Detection Low
if low[cp] <= lowest[(cp)*2+1](low) then
LLL = -1
else
LLL = 0
endif
//Value of last Low
if LLL = -1 then
Low1 = Low2[1]
Low1bar = Low2bar[1]
Low2 = low[cp]
Low2bar = barindex[cp]
endif
// condition of screening Triangle
//condition 1 triangle compression contraction Lows are increasings and High are decreasing High1>High2 and Low1<Low2
//condition 2 compression of volatilty Initial swing High1Low1> Last Swing High2Low2 : abs(High1-Low1)> abs(High2-Low2)
//condition 3 triangle oscillation inside the triangle e.g. correct order of bars L/H/L/H or H/L/H/L
//condition 4 triangle amplitude ratio control H1L1< 2 H2L2
triangle = High1>High2 and Low1<Low2 and abs(High1-Low1)> abs(High2-Low2) //triangle conditions 1+2 contraction Low increasing and High decreasing
oscillationH1L1H2L2= High1bar< Low1bar and Low1bar< High2bar and High2bar<Low2bar //triangle condition 3 oscillation
oscillationL1H1L2H2= Low1bar<High1bar and High1bar<Low2bar and Low2bar< High2bar //triangle condition 3 oscillation
triangleamplitude=abs(High1-Low1)< 2* abs(High2-Low2)
//triangleamplitude =1
//Triangle display and H1L1H2L2
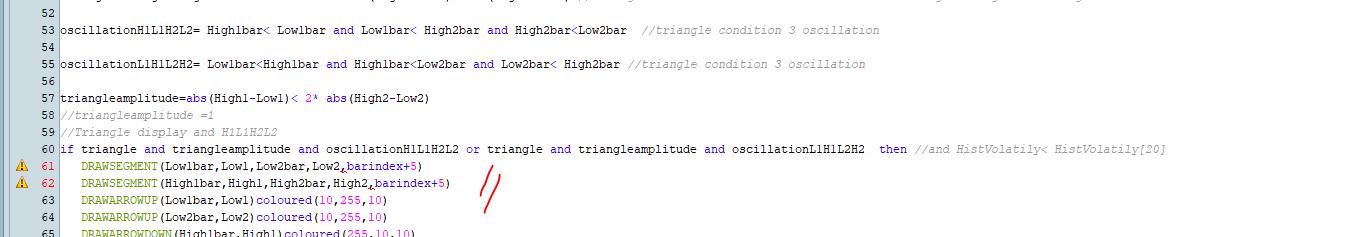
if triangle and triangleamplitude and oscillationH1L1H2L2 or triangle and triangleamplitude and oscillationL1H1L2H2 then //and HistVolatily< HistVolatily[20]
DRAWSEGMENT(Low1bar,Low1,Low2bar,Low2,barindex+5)
DRAWSEGMENT(High1bar,High1,High2bar,High2,barindex+5)
DRAWARROWUP(Low1bar,Low1)coloured(10,255,10)
DRAWARROWUP(Low2bar,Low2)coloured(10,255,10)
DRAWARROWDOWN(High1bar,High1)coloured(255,10,10)
DRAWARROWDOWN(High2bar,High2)coloured(255,10,10)
//DRAWCANDLE(High1,high2,low2,low1) //when triangle is detected
endif
// possible buystop or sellstop orders level
///Equation of line y=ax+b
// slope a= (yB-yA)/(xB-xA)= deltay/deltax
// intercept b= yA-xA(YB-YA)/(xB-xA)
//calculation of upperline equation and position yHigh for buystop
aH=(High2-High1)/(High2bar-High1bar)
bH=High1-High1bar*(High2-High1)/(High2bar-High1bar)
//calculation of lowerline equation
aL=(Low2-Low1)/(Low2bar-Low1bar)
bL=Low1-Low1bar*(Low2-Low1)/(Low2bar-Low1bar)
if triangle and triangleamplitude and oscillationH1L1H2L2 or triangle and triangleamplitude and oscillationL1H1L2H2 then //and HistVolatily< HistVolatily[20]
//upper line
//for i=0 to High1bar do
i=1
yHigh= aH*(i-High1bar)+bH
DRAWARROWUP(i,yHigh)coloured(10,255,10)
//next
//lowerline
//for j=0 to Low1bar do
j=1
yLow= aL*(j-Low1bar)+bL
DRAWARROWDOWN(j,yLow)coloured(255,10,10)
//next
Endif
//end of triangle
// intercept between yH and yL yH=yL= aH(x-H1bar)+bH=aL(x-L1bar)+bL => x= (bL-bH+aH*H1bar-aL*L1bar)/(aH-aL)
//conditions of screening wedge
//risingwedge = High1<High2 and Low1<Low2 and abs(High1bar-High2bar)>abs(Low1bar-Low2bar) and abs(High1-High2)<abs(Low1-Low2) //Rising wedge?
//fallingwedge = High1>High2 and Low1>Low2 and abs(High1bar-High2bar)<abs(Low1bar-Low2bar) and abs(High1-High2)>abs(Low1-Low2) //Falling weg ?
//condition 3 wedge oscillation inside the wedge e.g. correct order of bars L/H/L/H or H/L/H/L similar condition than triangle
//condition 4 wedge amplitude ratio control H1L1< ??? H2L2 to check?
//if risingwedge or fallingwedge and oscillationH1L1H2L2 or oscillationL1H1L2H2 then
//DRAWsegment(Low1bar,Low1,Low2bar,Low2)
//DRAWsegment(High1bar,High1,High2bar,High2)
//DRAWARROWUP(Low1bar,Low1)coloured(10,255,10)
//DRAWARROWUP(Low2bar,Low2)coloured(10,255,10)
//DRAWARROWDOWN(High1bar,High1)coloured(255,10,10)
//DRAWARROWDOWN(High2bar,High2)coloured(255,10,10)
//endif
//Volatility decrease in triangle lowest 300 period volatily
//AverageVolatity
//Volatilty
//Previous trend detection : triangle should be continuation pattern
//Previous trend detection : trend continuation wedge should a short term reversalpattern and long term continuation
//close > average[X]
Return
//Indicator End
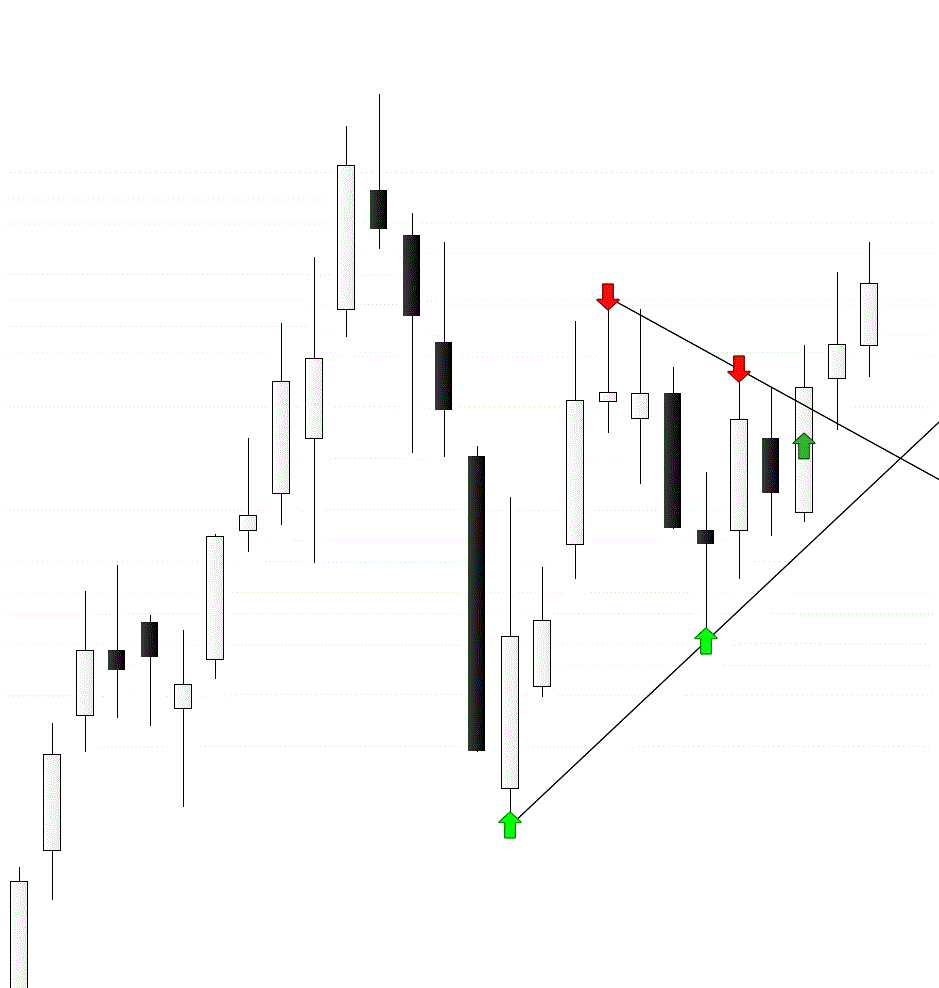
est il possible de l’afficher comme dans l’exemple ci dessous
exemple fleche verte quand le triangle est cassé par le haut à la cloture de l’extension du segment