Bard
BardParticipant
Master
Hi
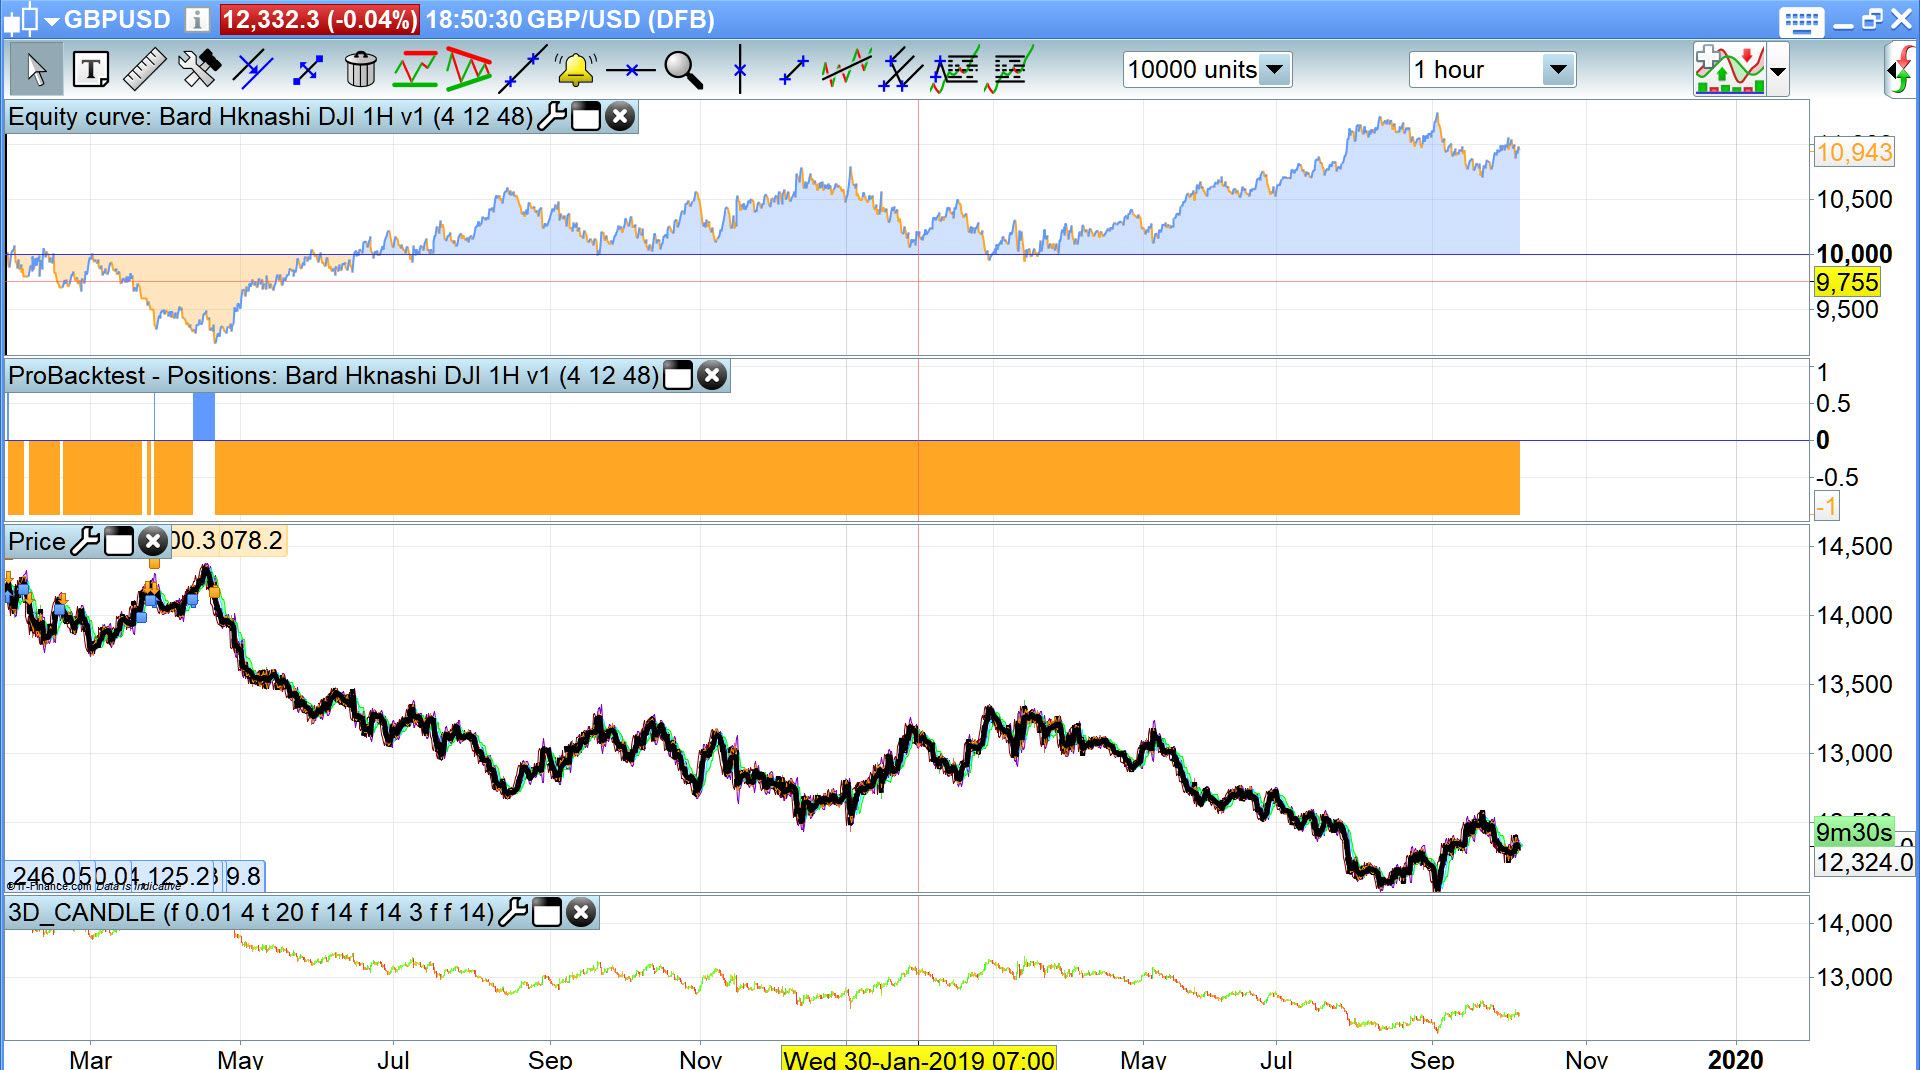
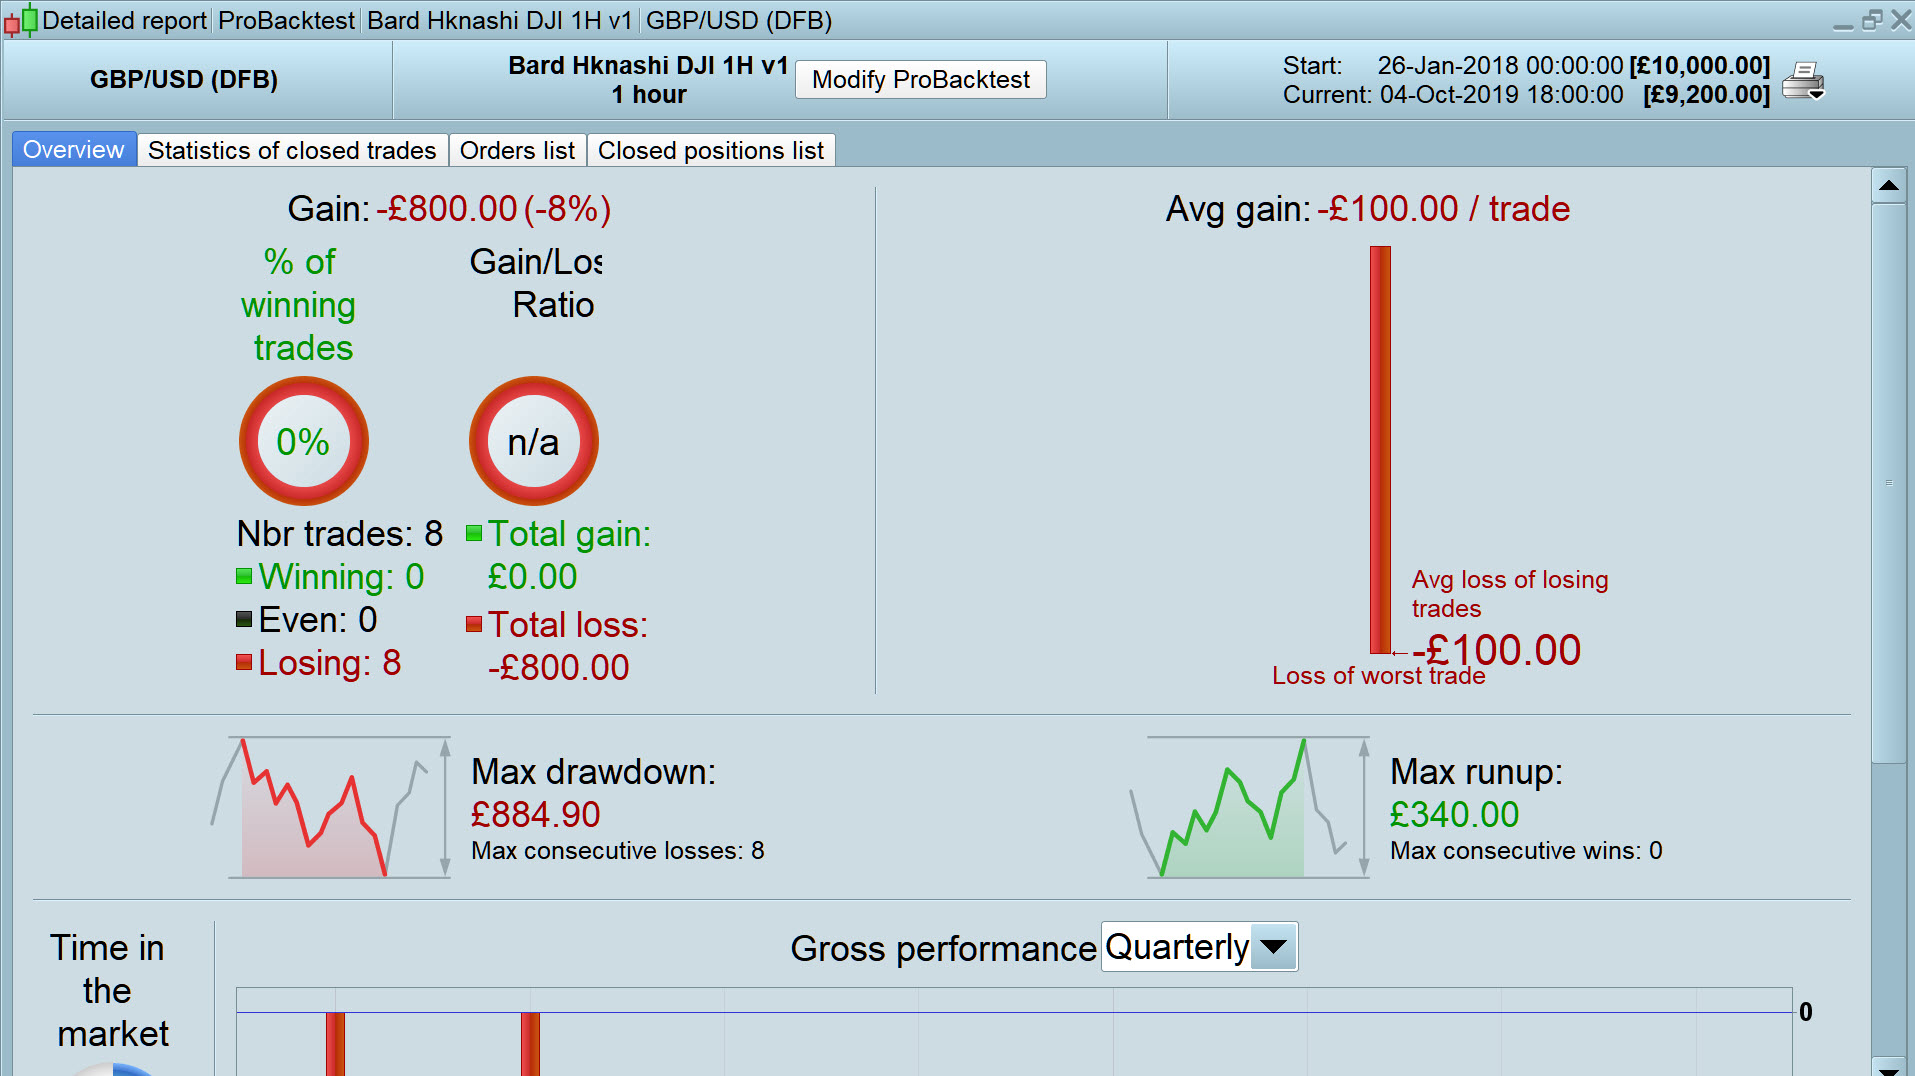
I get an Equity Curve that shows a Profit but the Detailed Report shows a Loss with this Ichimoku strategy below: Pls see image.
I was testing on the hourly £/$ between the 25th Jan 2018 and the 4th Oct 2019 with a 3.8 pip spread.
Any reason why?
Cheers
Bard
Defparam CumulateOrders = false // Cumulating positions deactivated
//Defparam flatafter = 164500
//VARIABLES
once StartE = 070000  //start time for opening positions
once StartL = 230000  //ending time for opening positions (only trading in the  morning)
once N = 1  // initieel aantal contracten
OTD = Barindex - TradeIndex(5) > IntradayBarIndex  // limits the (opening) trades till  1 per day
//once Spread = 6  //total spread buy and sell, the actual price is always in between !
once SL = round(close * 75/10000) //Setting Stop loss //Dynamic for indices // 100/10000 = 1%

S = 8  //4
M = 24 //12
L = 48 //48

// Ichimoku  settings
TenkanSen = (highest[S](high)+lowest[S](low))/2  // default setting S = 9
KijunSen  = (highest[M](high)+lowest[M](low))/2  // default setting M = 26
SenkouSpanA  = (Tenkansen[M]+Kijunsen[M])/2  // default setting M  = 26
SenkouSpanB  = (highest[L](High[M])+lowest[L](Low[M]))/2  //default setting L = 52

KumoBorderLong = Max(SenkouSpanA, SenkouSpanB) //
KumoBorderShort = Min(SenkouSpanA, SenkouSpanB) //
//graph KumoBorderShort
If TenkanSen crosses over KijunSen then  // base for counting bars when crossing takes place
CondLong = 1
else
CondLong = 0
endif
If TenkanSen crosses under KijunSen then
CondShort = 1
else
CondShort = 0
endif
//graph cond1L
if time >= StartE And time <= StartL and OTD and not onmarket then
IF  summation[2](CondLong) = 1 and summation[2](CondShort) = 0 and Close > KumoBorderLong then // Default summation[4]
BUY N shares AT MARKET
SET STOP ploss SL
endif
IF summation[2](CondLong) = 0 and summation[2](CondShort) = 1 and Close < KumoBorderShort THEN //
SELLSHORT N shares AT MARKET  //short sell conditie
SET STOP pLOSS SL
endif
endif
No image attached.
Is there a trade open and is it in Profit?
Detailed Report does not take account of Open Trades.
Yeah that Short is giving the profit, all other trades are losers??
BardParticipant
Master
Hi @GraHal sorry for the delay getting back to you and thanks for taking a look at this. I can’t now seem to replicate it today. No idea what actually happened as normally the equity curve and detailed reports always match up!
I stripped out the time of day trades could take place and number of trades restrictions and optimised the s, m, and l values, leaving the Stop at 2.5% and still couldn’t get any great returns on 1 and 4 hourly but 9, 13, and 44 on a daily time frame at £10/tick produced 43% returns. with a 28% drawdown.
However I tried just optimising the stop loss only and leaving the default settings of 9, 26 and 52 and it worked okay: Optimised stop of 0.5% stop loss (Daily £/$, 25th Jan 2018 to 3rd Oct 2019). I think there are better Ichimoku strategies on this forum.
Defparam CumulateOrders = false // Cumulating positions deactivated

Capital = 10000 + strategyprofit //Current profit made by the closed trades of the running strategy.
N = 5*Capital / Close

once SL = round(close * Stoploss/10000) //Setting Stop loss //Dynamic for indices // 100/10000 = 1%

S = 9  //4
M = 26 //12
L = 52 //48

// Ichimoku  settings
TenkanSen = (highest[S](high)+lowest[S](low))/2  // default setting S = 9
KijunSen  = (highest[M](high)+lowest[M](low))/2  // default setting M = 26
SenkouSpanA  = (Tenkansen[M]+Kijunsen[M])/2  // default setting M  = 26
SenkouSpanB  = (highest[L](High[M])+lowest[L](Low[M]))/2  //default setting L = 52

KumoBorderLong = Max(SenkouSpanA, SenkouSpanB) //
KumoBorderShort = Min(SenkouSpanA, SenkouSpanB) //
//graph KumoBorderShort
If TenkanSen crosses over KijunSen then  // base for counting bars when crossing takes place
CondLong = 1
else
CondLong = 0
endif
If TenkanSen crosses under KijunSen then
CondShort = 1
else
CondShort = 0
endif

if not onmarket then
IF  CondLong = 1 and CondShort = 0 and Close > KumoBorderLong then // Default summation[4]
BUY N shares AT MARKET
SET STOP ploss SL
endif
IF CondLong= 0 and CondShort = 1 and Close < KumoBorderShort THEN //
SELLSHORT N shares AT MARKET  //short sell conditie
SET STOP pLOSS SL
endif
endif
No idea what actually happened
Was it not what I offered in the post below … it seemed to fit exactly to what you were saying where the symptoms??
Yeah that Short is giving the profit, all other trades are losers??
as normally the equity curve and detailed reports always match up!
Only if there is no open trade.
The Detailed Report shows figures for closed trades only.
Equity Curve shows figures for closed trades AND any Open Trades.