Hi @Moderators and all,
I am struggling getting the right signal of a new trade on the Equity Curve of a backtest.
I am using this kind of trick
EquityData <> EquityData[1] (meaning the Equity was flat for a while)
But sometimes when the equity curve does not have the time to turn flat, I am unable to get the signal;
>> Is there a function I am missing or is there no solution to get this information in the backtest window?
Thanks a lot ^^
That line should work whenever
EquityData <> EquityData[1], not just when it was flat and currently it is not. I donìt know how and when you used it, but there should be no need to wait for it to be flat before a change is detected.
 JS
JSParticipant
Veteran
Maybe the same story as with the “StrategyProfit”…
I have noticed that when you go from long to short or from short to long in one go, the “StrategyProfit” is not updated (or a bar too late)
The solution is to do an intermediate step and close the positions in the “right way”:
So instead of all at once: Long => Short
Long => Sell => Short => ExitShort
This kind of instruction only works when the positions are closed in the “right way”…?
thanks for your quick answer;
to be clearer,
- this is the code I wrote in order to identify the number of trades as the ProOrder functions are not allowed in indicators for Equity Curve
It should but it cannot identify this
if EquityData <> EquityData[1] and TradeFlag = 0 then

OpenTrade = 1
TradeFlag = 1
TradeCounter = Max(1,TradeCounter + 1)

elsif EquityData = EquityData[1]  and TradeFlag = 1 then //and EquityData[1] = EquityData[2] and EquityData[2] = EquityData[3]

OpenTrade = 0
TradeFlag = 0

else

OpenTrade = 0

endif
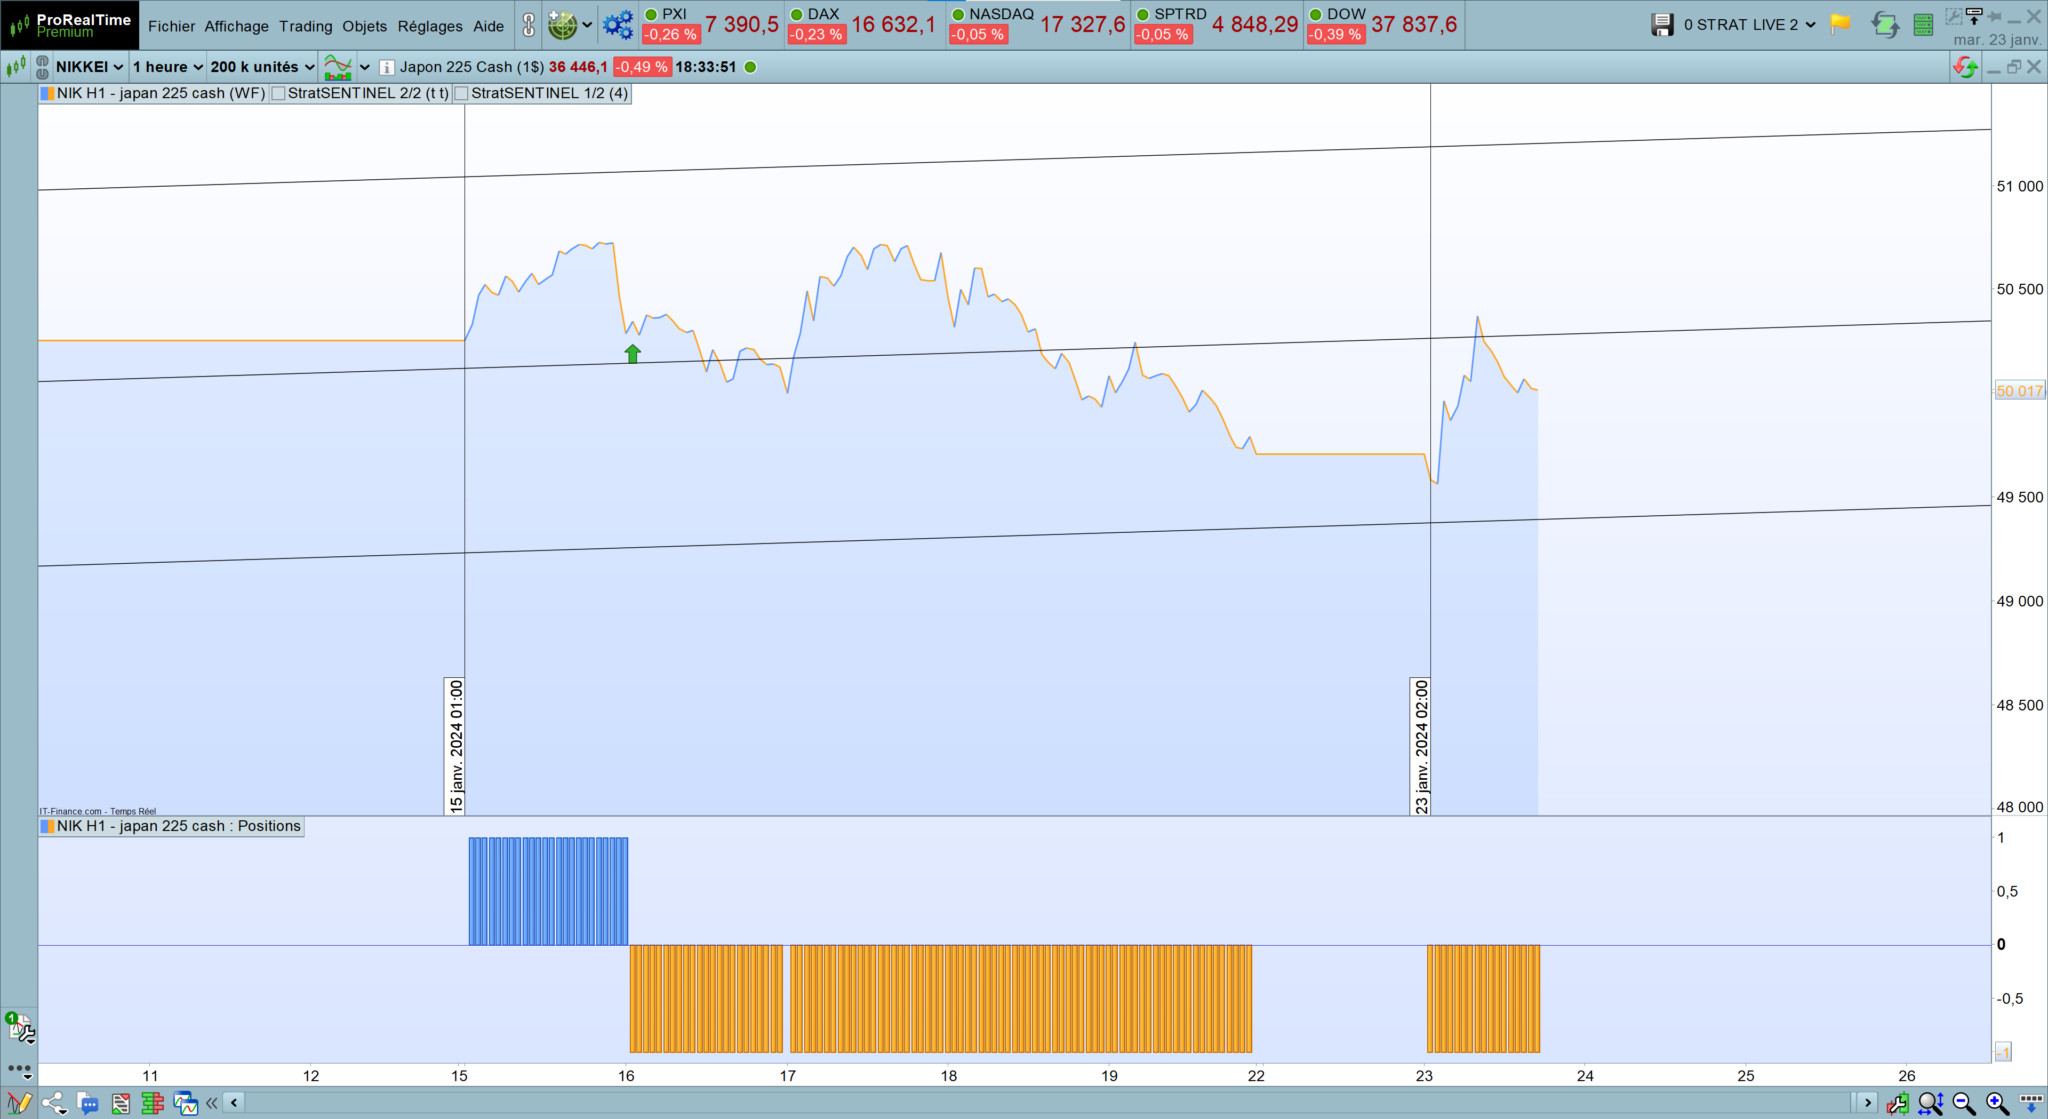
- and enclosed is the problem I face, in case the equity curve does not turn flat ; the vertical lines indicate the identified new trades (and some are missing as you can see)
thanks ^^
Maybe the same story as with the “StrategyProfit”…
I have noticed that when you go from long to short or from short to long in one go, the “StrategyProfit” is not updated (or a bar too late)
The solution is to do an intermediate step and close the positions in the “right way”:
So instead of all at once: Long => Short
Long => Sell => Short => ExitShort
This kind of instruction only works when the positions are closed in the “right way”…?
thanks JS but in fact you cannot even use these ProOrder functions in indicators PRT world 😉
Check that you are executing the line (and the following lines):
if EquityData <> EquityData[1] and TradeFlag = 0 then
in the DEFAULT timeframe.
If you are using a 1-minute TF, but those lines are in the 4-hour TF, they will be updated ONCE every 4 hours, if UpdateOnClose is used. That might be an issue.
Check that you are executing the line (and the following lines):
|
|
if EquityData <> EquityData[1] and TradeFlag = 0 then
|
in the DEFAULT timeframe.
If you are using a 1-minute TF, but those lines are in the 4-hour TF, they will be updated ONCE every 4 hours, if UpdateOnClose is used. That might be an issue.
Ok thanks, but do you see another way to identify consecutive trades in the context of an Equity Curve Indicator?
Try this one:
TradeClosed = strategyprofit <> strategyprofit[1]
Conescutive = OnMarket AND TradeClosed
Try this one:
|
|
TradeClosed = strategyprofit <> strategyprofit[1]
Conescutive = OnMarket AND TradeClosed
|
Thanks Roberto but these are all functions working solely in the context of algos and not indicators
You will need to simulate trading, like any backtesting software:
ONCE TradeIsOpen = 0
TradeClosed = EquityData  <> EquityData [1]
// set  TradeIsOpen whenever the conditions to enter a position are met,
// then clear it as soon as the trade needs to be closed (like backtest
// does).
// ProBackTest is actually an indicator (well... quite difficult and time
// consuming to code!)
IF MyConditions THEN
   TradeIsOpen = 1
ENDIF
Conescutive = TradeIsOpen AND TradeClosed
You will need to simulate trading, like any backtesting software:
|
|
ONCE TradeIsOpen = 0
TradeClosed = EquityData <> EquityData [1]
// set TradeIsOpen whenever the conditions to enter a position are met,
// then clear it as soon as the trade needs to be closed (like backtest
// does).
// ProBackTest is actually an indicator (well… quite difficult and time
// consuming to code!)
IF MyConditions THEN
TradeIsOpen= 1
ENDIF
Conescutive = TradeIsOpen AND TradeClosed
|
Hi Roberto,
Are you telling me indirectly that I cannot indentify every trade through an indicator that I apply on the Equity Curve?
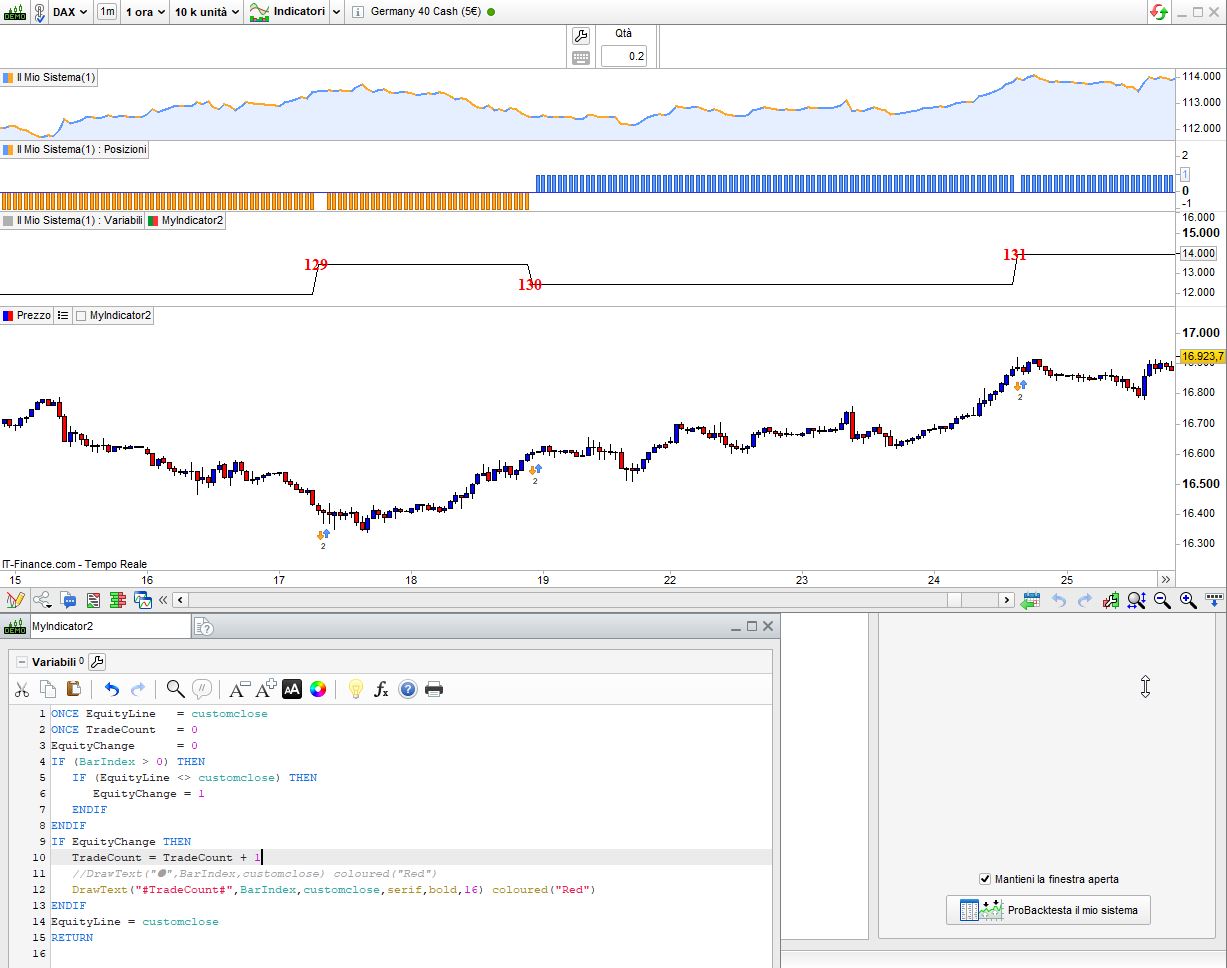
It’s not possible, try this code (apply it to the equity line):
ONCE EquityLine   = customclose
ONCE TradeCount   = 0
EquityChange      = 0
IF (BarIndex > 0) THEN
   IF (EquityLine <> customclose) THEN
      EquityChange = 1
   ENDIF
ENDIF
IF (not EquityChange AND EquityChange[1]) AND (close <> close[1]) THEN
   DrawText("*●",BarIndex,customclose) coloured("Red")
ENDIF
EquityLine = customclose
RETURN
it will plot a large red dot whenever the equity line changes, but it requires at least two bars NOT ONMARKET to detect trades properly.
The EquityLine changes every bar, as it combines StrategyProfit + PositionPerf.
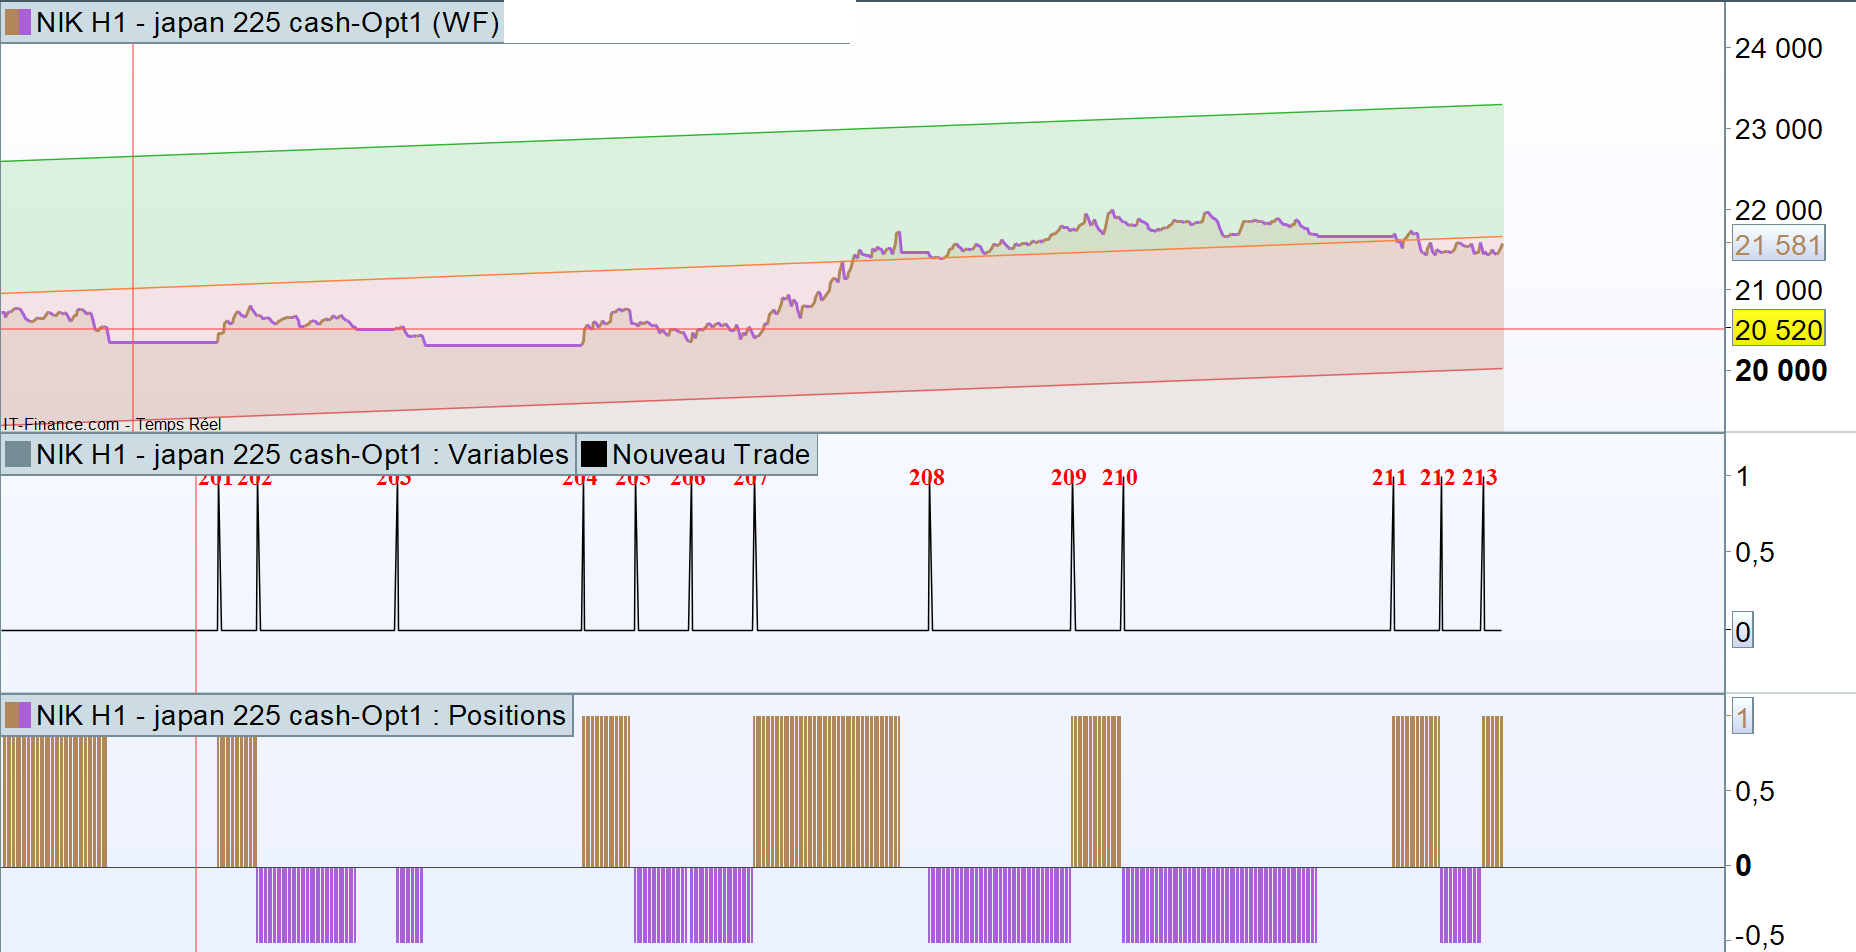
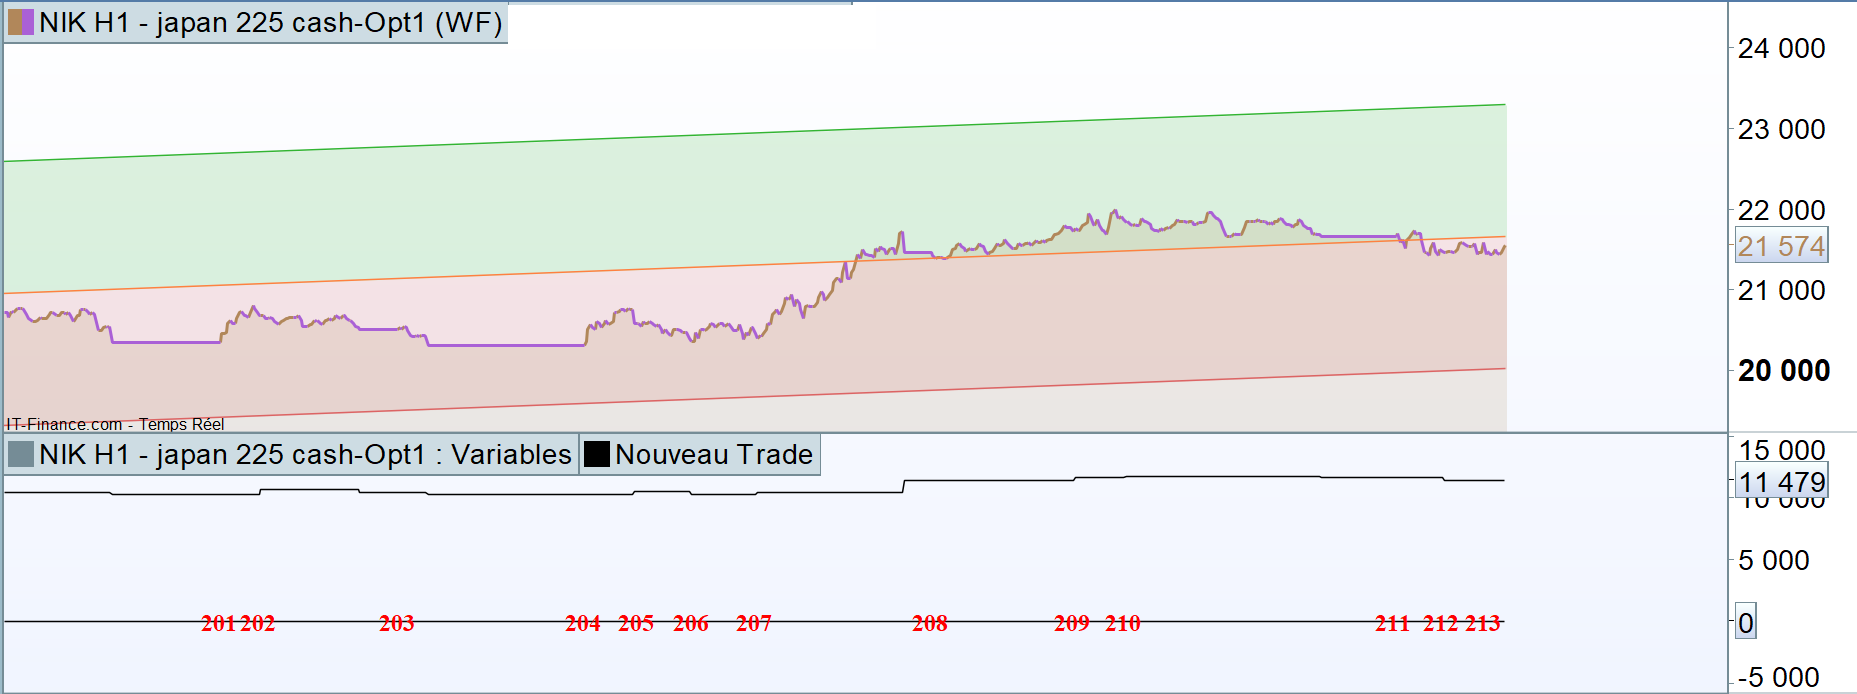
To use STRATEGYPROFIT only, you have to append this line to your backtest:
GRAPH StrategyProfit
Then add this indicator to the variable window where STRATEGYPROFIT is plotted:
ONCE EquityLine   = customclose
ONCE TradeCount   = 0
EquityChange      = 0
IF (BarIndex > 0) THEN
   IF (EquityLine <> customclose) THEN
      EquityChange = 1
   ENDIF
ENDIF
IF EquityChange THEN
   TradeCount = TradeCount + 1
   DrawText("#TradeCount#",BarIndex,customclose,serif,bold,16) coloured("Red")
ENDIF
EquityLine = customclose
RETURN
my attached pic shows the results.
The EquityLine changes every bar, as it combines StrategyProfit + PositionPerf.
To use STRATEGYPROFIT only, you have to append this line to your backtest:
Then add this indicator to the variable window where STRATEGYPROFIT is plotted:
1
2
3
4
5
6
7
8
9
10
11
12
13
14
|
ONCE EquityLine = customclose
ONCE TradeCount = 0
EquityChange = 0
IF (BarIndex > 0) THEN
IF (EquityLine <> customclose) THEN
EquityChange= 1
ENDIF
ENDIF
IF EquityChange THEN
TradeCount= TradeCount + 1
DrawText(“#TradeCount#”,BarIndex,customclose,serif,bold,16) coloured(“Red”)
ENDIF
EquityLine = customclose
RETURN
|
my attached pic shows the results.
Thanks for your help Roberto
We are getting closer but the indicator does not apply on the equity curve of course; moreover strategyprofit as I understand it, will only update at the end of the last trade right?
So I wonder how our little hack could solve the problem I am facing on the Equity curve; am I missing something?
My goal is to add on the Equity Curve an indicator that detects every new beginning trade.
Thanks
It’s not possible to add indicators to the equity curve in ProBackTest to detect new trades.
You can only achieve your goal simulating trading, or using GRAPH for the variable window as stated above.