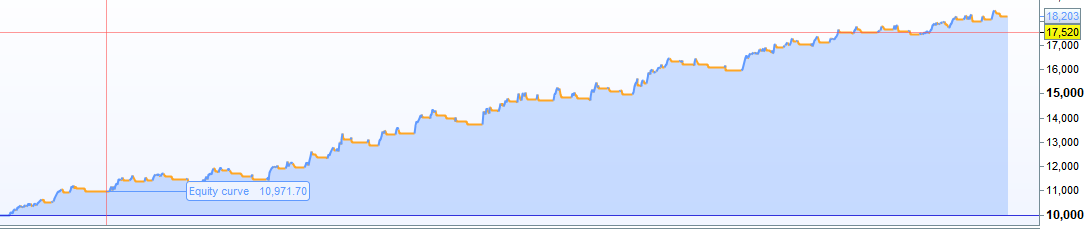
I visited the idea of using equity curve average as a filter on strategies a while back but put the idea to one side for reasons that I cannot recall. I just revisited the idea and added it to a strategy that I was working on and it appeared to give a very big improvement and produced a very nice equity chart.
[attachment file=60633]
I’m interested in knowing if anyone else is actually using an equity curve average as a filter in live strategies?
I’m also interested in any thoughts, ideas or experience of this subject.
Hi Vonasi, I actually use the equity curve average to manage my active strategies manually. So basically whenever they dip below the average I stop then until they recover.
I am interested to see how you implemented it into the actual code of the strategy? Do you also just suspend taking position or just reduce risk/exposure?
I tried just using it to reduce risk by reducing position size if the equity curve was below the average but found it gave better results to stay out completely until the average came back to meet the equity curve.
I had a strategy that went through some largish slow drawdown periods and was looking for a filter to keep me out of the market as much as possible during these times which is what bought me back to the idea of equity curve averaging as a filter.
At the moment I am just experimenting with an adaptation of the code found here within my strategy:
https://www.prorealcode.com/blog/trading-strategy-profit-curve/
My code is:
CurvePeriod = 100
Type = 0

Capital = 10000
Equity = Capital + StrategyProfit
EquityCurve = Average[CurvePeriod,Type](Equity)

IF Not OnMarket AND BarIndex < CurvePeriod THEN
IF conditions THEN
BUY 1 Contract At Market
ENDIF
ENDIF

IF Not OnMarket AND BarIndex > CurvePeriod THEN
IF conditions AND Equity >= EquityCurve THEN
BUY 1 Contract At Market
ENDIF
ENDIF
Obviously CurvePeriod and the average Type are the optimized variables.
Obviously the code in my last post is not a true equity curve average as to achieve that it would be necessary to have an equity curve based on a simulation of all possible trades whereas the above code just stops trading and so the equity curve will just flat line until the average line comes back to meet it. I guess an indicator could be created that simulates all trades and then provides a simulated equity curve as if all trades had been taken and also an average line based on this. This will be my next step when I have some time(!) – although at the moment the flat-lining equity curve average filter appears to be quite effective.
Using a indicator to simulate trades seems like an plausible.
I basically just track the Moving Average of my live strategies equity curve on the back test window.
Using a indicator to simulate trades seems like an plausible.
Yes it is, should definitely take time to code a framework to explore it all together 🙂
Take the average of the equitycurve is an option, but just like with any data serie, you can apply any indicator: Bollinger bands to test the deviation of your profit from its average, RSI to know your win/loss ratio is declining or ascending, possibilities are enormous.
Using a indicator to simulate trades seems like an plausible.
Yes it is, should definitely take time to code a framework to explore it all together Take the average of the equitycurve is an option, but just like with any data serie, you can apply any indicator: Bollinger bands to test the deviation of your profit from its average, RSI to know your win/loss ratio is declining or ascending, possibilities are enormous.
You will have to stop coming up with these ideas and suggestions Nicolas as there is only so much time in everyday to explore new possibilities! I’ll add it to my list…. 🙂
 AVI
AVIParticipant
New
Hello, I’m new to the forum, I’m interested in the codes to suspend a system when it is below its average, the problem is that the system stops altogether. I noticed that you talk about an indicator that takes into account the “fake” trades to build the equity curve, are there any updates? thank you so much!
are there any updates?
Not really. I did write one strategy which was an end of day strategy that built up a fake equity value for all possible trades alongside the real strategy profit and changed the value of position size from 1 to zero depending on the fake equity curves level compared to an average of it but I have not had much time to go much further with it.
 Link
LinkParticipant
Senior
My question is this:
You could do the same, but instead of with the equity curve, with strategy profit?
That is, for example:
If we have a strategy profit of + € 10,000 and we lose 10%, we will only return to trading when it exceeds + € 10,000 again.
when it exceeds + € 10,000 again.
How does strategyprofit go from below £10k to above £10k if we stop trading?
Apart from trading simulation, to calculate a fake profit, how do you think the gain will rise again if you have stop trading?
This blog post is talking about that: How to improve a strategy with simulated trades
LinkParticipant
Senior
OK.
I would like that when strategy profit is higher than € 10,000 the equity curve starts again from 0.
Thanks!
STRATEGYPROFIT cannot be modified, so you will have to manage it your own, keeping a copy of STRATEGYPROFIT at the moment ir reaches 10000 (I named it Difference), then start with a new one.
There you go (not tested):
ONCE MyStrategy = 0
ONCE Difference = 0
IF MyStrategy >= 10000 THEN
   MyStrategy = 0
   Difference = STRATEGYPROFIT
ELSE
   MyStrategy = STRATEGYPROFIT - Difference
ENDIF
MyStrategy = MyStrategy + (PositionPerf * PositionPrice / PipSize * PipValue)
Graph MyStrategy
Graph STRATEGYPROFIT
MyStrategy will retain the profit up to 10000, while STRATEGYPROFIT will retain the total profit/loss.
LinkParticipant
Senior
Isnt possible.
And if other equitycurve when strategy profit is + of 10000€?