Hi every one,
I start this topic to discuss this strategy and understand it and why not improve it and at the same time learn to program, here is the code of the strategy :
// END OF DAY  -  YEN
// www.doctrading.fr

Defparam cumulateorders = false

// TAILLE DES POSITIONS
n = 1

// PARAMETRES
// high ratio = few positions
// AUD/JPY : ratio = 0.5 / SL = 0.8 / TP = 1.2 / Period = 12
// EUR/JPY : ratio = 0.6 / SL = 1 / TP = 0.8 / Period = 8
// GBP/JPY : ratio = 0.5 / SL = 0.6 / TP = 1 / Period = 8
// USD/JPY : ratio = 0.5 / SL = 1 / TP = 0.8 / Period = 12

ratio = 0.5

// HORAIRES
startTime = 210000
endTime = 231500
exitLongTime = 210000
exitShortTime = 80000

// STOP LOSS & TAKE PROFIT (%)
SL = 1
TP = 0.8

Period = 12

// BOUGIE REFERENCE à StartTime
if time = startTime THEN
amplitude = highest[Period](high) - lowest[Period](low)
ouverture = close
endif

// LONGS & SHORTS : every day except Fridays
// entre StartTime et EndTime
if time >= startTime and time <= endTime and dayOfWeek <> 5 then
buy n shares at ouverture - amplitude*ratio limit
sellshort n shares at ouverture + amplitude*ratio limit
endif

// Stop Loss & Take Profit
set stop %loss SL
set target %profit TP

// Exit Time
if time = exitLongTime then
sell at market
endif
if time = exitShortTime then
exitshort at market
endif
This is a classic Asian session breakout strategy. You’ll find many literature on the web about.
tks you @Nicolas
if there are people willing to work with me on this strategy on understanding and why not improve it,
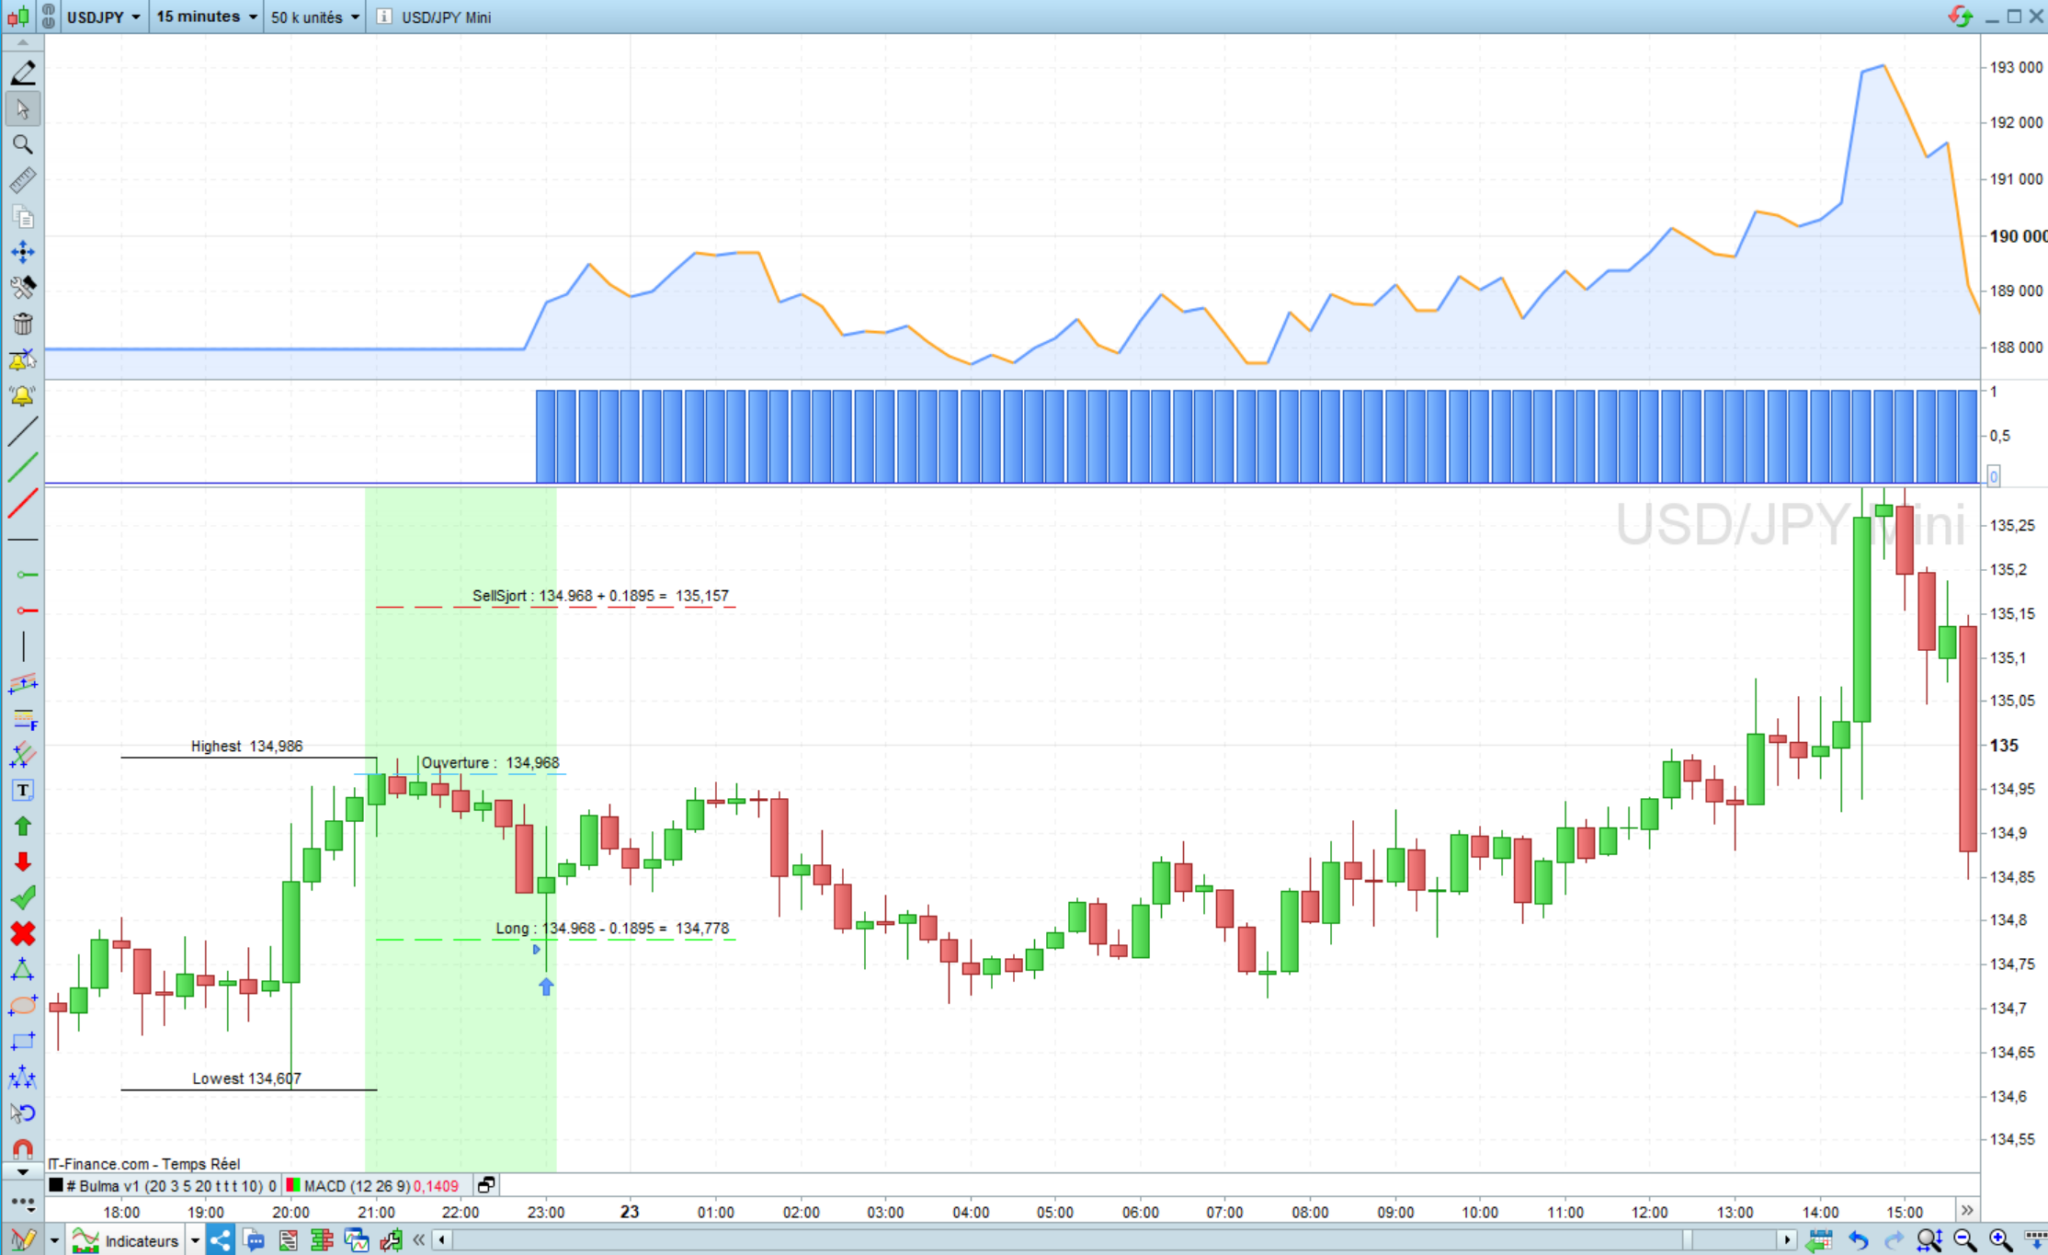
First of all I don’t know why my calculations are not good I don’t get the same entry price in Long :
Highest : 134.986
Lowest : 134.607
amplitude = Highest – Lowest = 134.986 – 134.607 = 0.379
Ouverture : 134.968
in this situation, there is the price of Buy and SellShort :
if time >= startTime and time <= endTime and dayOfWeek <> 5 then
buy n shares at ouverture - amplitude*ratio limit // 134.968 - 0.1895 = 134.778
sellshort n shares at ouverture + amplitude*ratio limit // 134.986 + 0.01895 = 135.157
endif
1) question one, why the entry limit price it’s not the same of my math, maybe I did wrong ? it’s a limit price not market
2) according to the documentation it is not possible to be long and short at the same time, so normally the SellShort order should close the Long buy order
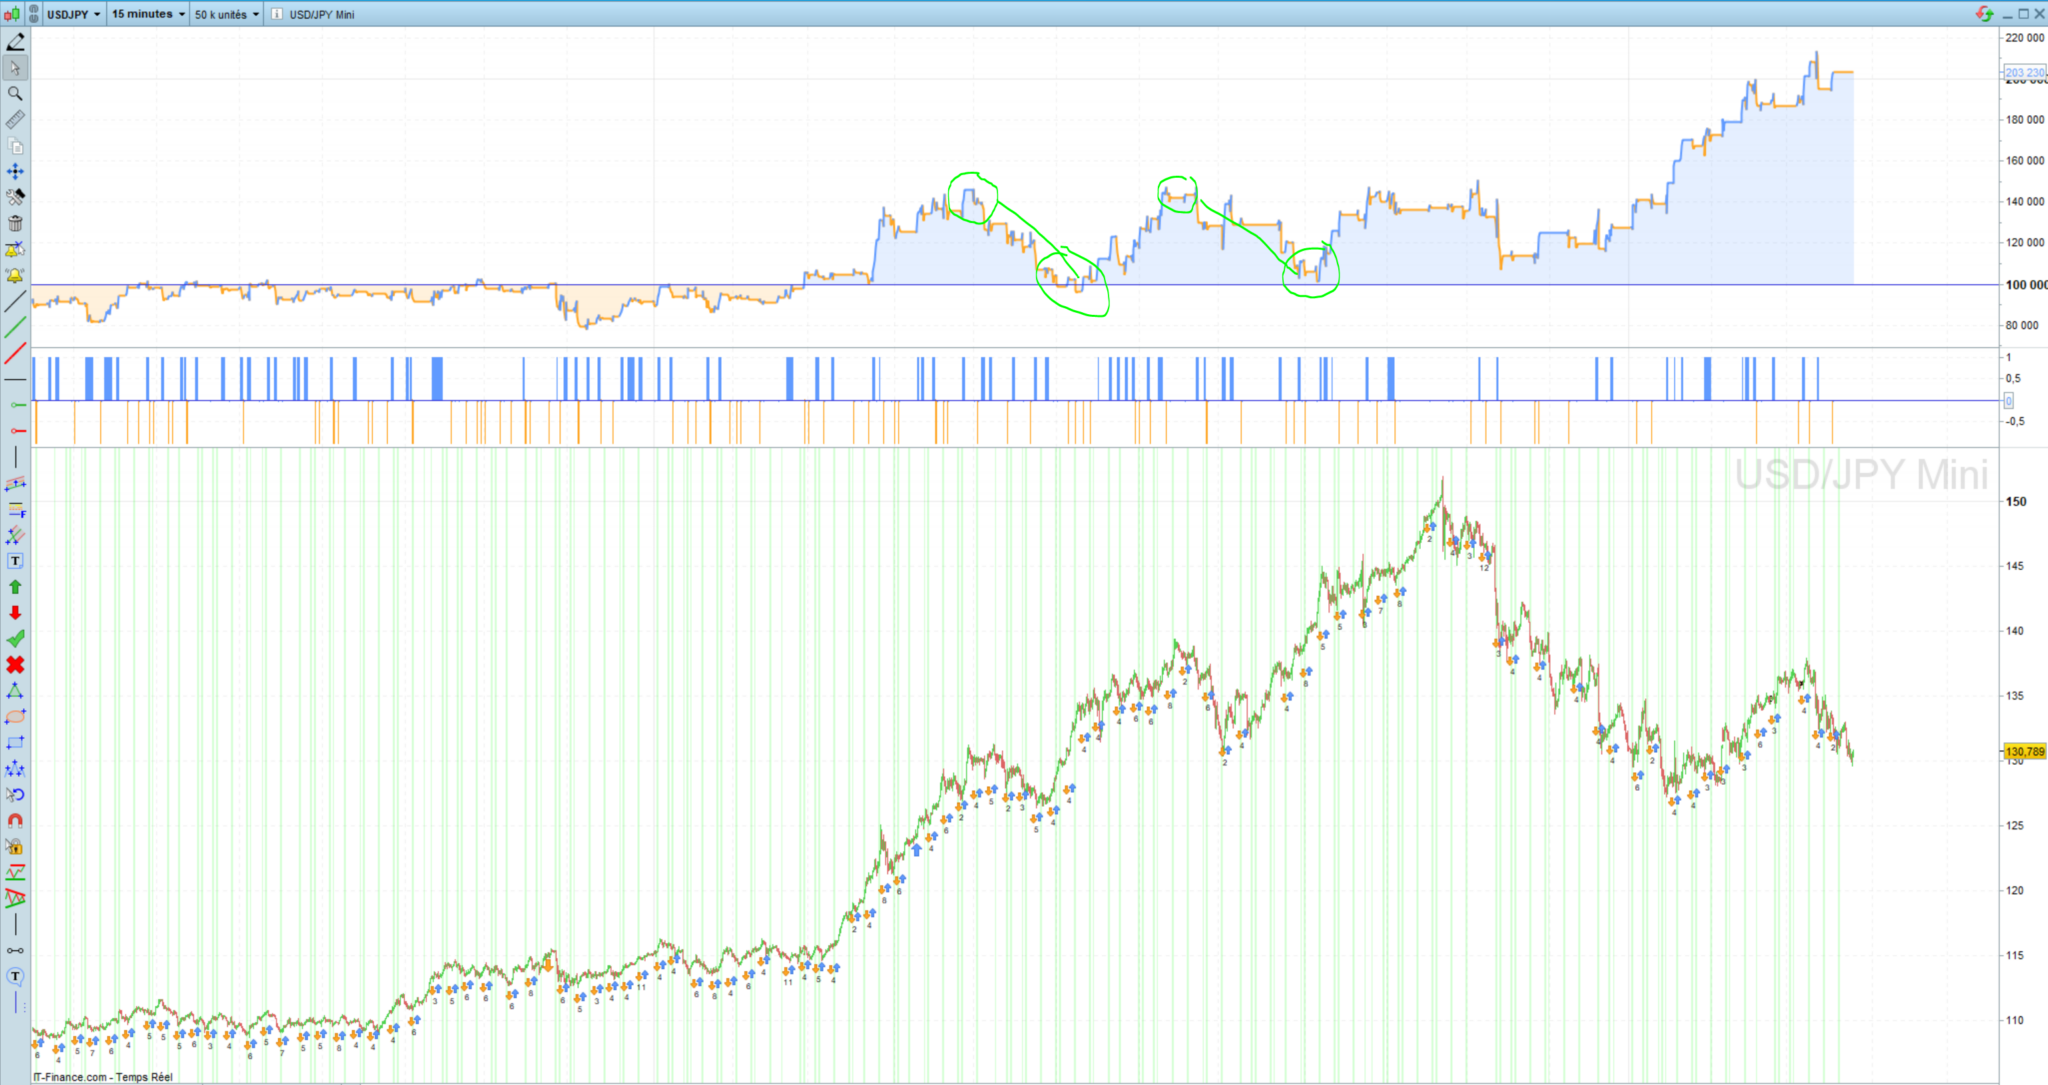
3) Also we can notice that we doubled our capital which makes us a gain of 100%, but also we had drawdown of more than 30%, Perhaps a better management with multiple timeframe or a good follow-up of the winning positions would have brought us a little more gain
4) If you have video or other links that summarize / explain this strategy for understanding I am a taker
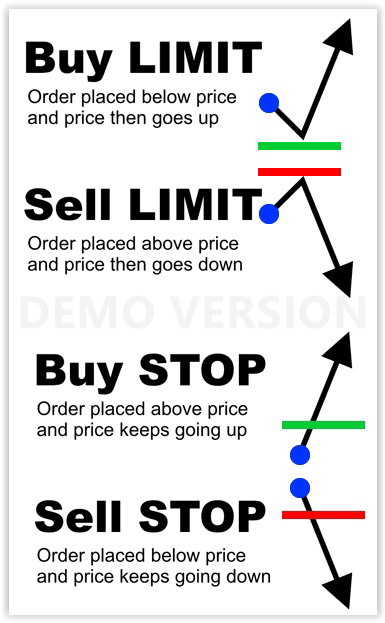
You are assuming LIMIT pending orders, while it could be that STOP pending are required. When placing pending orders, using the incorrect type may result in trades opened AT MARKET.
LIMIT pending orders are to be used when the entry price is most favourable than the entry price, i.e. you BUY at a lower price or SELLSHORT at a higher price, while STOP pending orders are to be used when you BUY at a higher price or SELLSHORT at a lower price (see attached pic).
ok, I understand you and your explaination is clear, but for me it’s still not clear why if they already have an limite long order it’s executed at a better price like a stop order, Also we speak about forex, so normaly no probleme of execution, but I don’t forget also I’m on a CFD with IG,
I will come back after some days about this execution problem, tks again robertogozzi
Let’s try to improve our code a little bit, some one can help me on line 50 to 54 ? I want to add an condition if our equity go down with X% (Drawdown) we have to stop the strategy :
// USD/JPY preferred
// H1

Defparam CumulateOrders = False

//Once Capital    = 100000 // Initial Capital of 100 000 JPY
//Once Equity     = Capital

// Lever (max recommended: 1.5)
Leverage = 1

// Choice of reinvesting earnings or not
REINV = 0
IF REINV = 0 THEN
n = 1 * Leverage
ENDIF

IF REINV = 1 THEN
Capital = 100000 + StrategyProfit
n = (Capital / 100000) * Leverage
IF n <1 THEN
n = 1  // Minimum Size : 1
ENDIF
ENDIF

// Reference candle 18 to 22H
If Time = 220000 THEN
Amplitude = Highest[4](High) - Lowest[4](Low)
Amplitude = Amplitude * 0.4
Opening = Close
ENDIF

// BUY & SELL between 22H et 23H & We have to check GTM Time
IF time >= 220000 and time <= 230000 THEN
Buy n Shares AT Opening - Amplitude Limit
Sellshort n Shares AT Opening + Amplitude Limit
ENDIF

// STOP & TARGET
SET STOP %LOSS 0.4
SET TARGET %PROFIT 1.2

// EXIT
IF time = 100000 THEN
SELL AT MARKET
EXITSHORT AT MARKET
ENDIF

// STOP STRATEGIE IF DRAWDOWN OF 10%
DrawDownwMax = 10

IF Capital <= (Capital[1] - (Capital[1] / DrawDownwMax)) Then
QUIT
ENDIF

//IF STRATEGYPROFIT < -100 THEN
//QUIT
//ENDIF
or this solution for max drawdown but sill not working :
// STOP STRATEGIE IF DRAWDOWN OF 30%
MaxDrawDownPercentage = 30
Equity = 100000 + StrategyProfit
MaxDrawdown = Equity * (MaxDrawDownPercentage/100)

IF OnMarket and ((PositionPrice - low)*CountOfPosition) > MaxDrawDown THEN
Quit
ENDIF
I found this solution for the maximum Drawdown, I save at every candle the highest equity I get in HighestEquity variable and compare with the current candle equity for quit if we got more then MaxDrawDownPercentage % :
// STOP STRATEGIE IF DRAWDOWN OF 30%
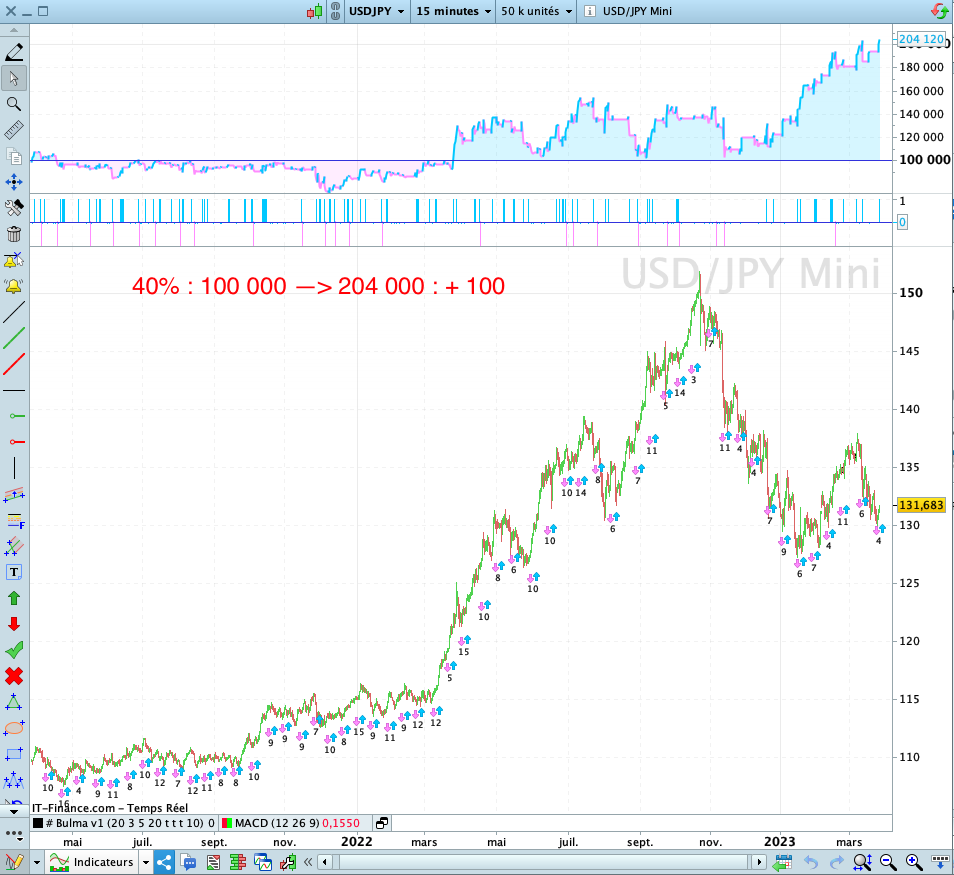
MaxDrawDownPercentage = 40
Equity = 100000 + StrategyProfit
HighestEquity = Max (HighestEquity,Equity) // Save the Maximum Equity we got
MaxDrawdown = HighestEquity * (MaxDrawDownPercentage/100)
ExitFromMarket = Equity <= HighestEquity - MaxDrawdown
IF ExitFromMarket Then
Quit
ENDIF
But this is woking good only after the position is closed, if some one can give me a help with the case if we are in the market for calculate the real PROFIT before closing a position in real time, because even we use a Stop Loss I think because we use only one time frame we can get some surprise, or maybe some good link for the equity management
@Moderator
I did a small mistake so maybe you can delete for me my message number: #212170 (or give me the possibility to edit it)
Hi every one,
So as you can see I did a mistake in the message number #212170, So now there is agan the original code or the first strategie “End Of Day – YEN M15” we are talking about (Knowing that I don’t really believe in this strategy or understand it well, but it is necessary to start from a base to work and improve the code and therefore my programming on ProBuilder)
// Strategy Name :    END OF DAY  -  YEN
// Version       :    2.0
// Information : I don't know what is this Strategie means ;-)


// PARAMETRES // this is from the original code, I don't if it's working good
// High Ratio = Few Positions
// AUD/JPY   : Ratio = 0.5 / SL = 0.8 / TP = 1.2 / Period = 12
// EUR/JPY   : Ratio = 0.6 / SL = 1   / TP = 0.8 / Period = 8
// GBP/JPY   : Ratio = 0.5 / SL = 0.6 / TP = 1   / Period = 8
// USD/JPY   : Ratio = 0.5 / SL = 1   / TP = 0.8 / Period = 12
// ============================================================

Defparam cumulateorders = false
// Initial Capital of 100 000 JPY & Spread : 2
Once Capital    = 100000

// SIZE OF THE POSITIONS
N = 1

Ratio = 0.5

// TIMETABLE
StartTime     = 210000
EndTime       = 231500
ExitLongTime  = 210000
ExitShortTime = 80000

// STOP LOSS & TAKE PROFIT (%)
SL = 1
TP = 0.8

Period = 12

// CANDLE REFERENCE to StartTime
IF Time = StartTime THEN
Amplitude = Highest[Period](High) - Lowest[Period](Low)
Opening = Close
ENDIF

// LONGS & SHORTS : every day except Fridays
// between StartTime and EndTime
IF Time >= StartTime AND Time <= EndTime AND DayOfWeek <> 5 THEN
Buy N Shares AT (Opening - Amplitude * Ratio) Limit
SellShort N Shares AT (Opening + Amplitude * Ratio) Limit
ENDIF

// Stop Loss & Take Profit
Set Stop   %Loss   SL
Set Target %Profit TP

// Exit Time
IF Time = ExitLongTime THEN
Sell AT Market
ENDIF

IF Time = ExitShortTime THEN
ExitShort AT Market
ENDIF
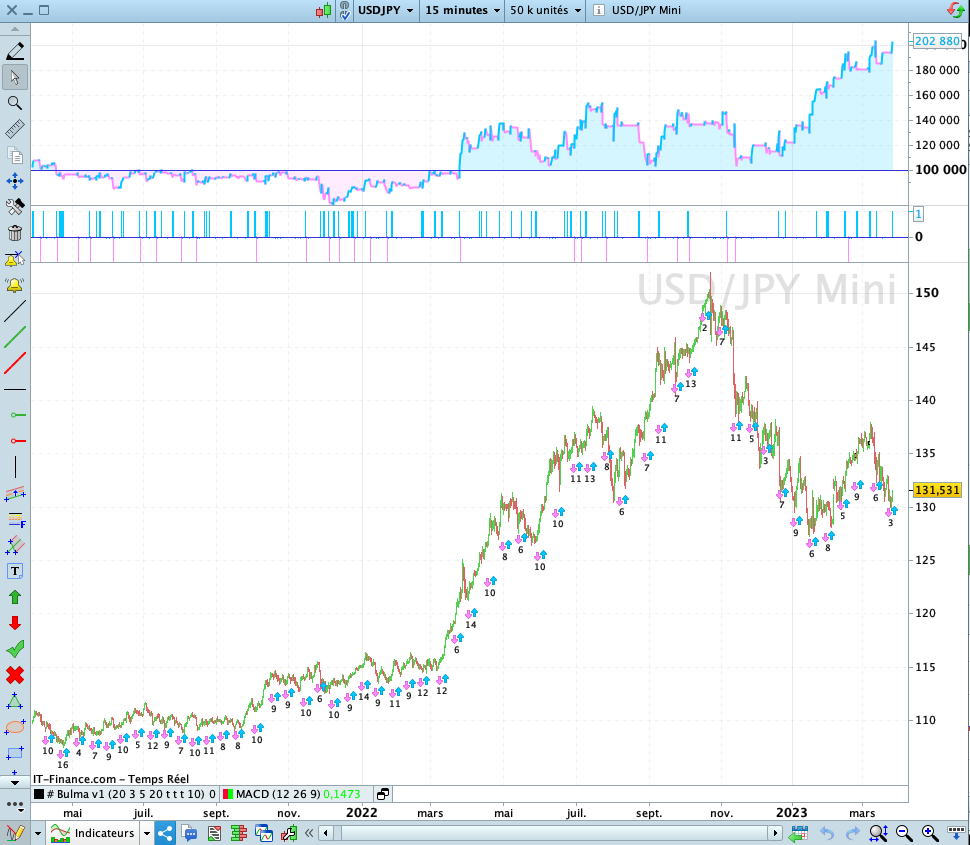
and there is the result with :
USD/JPY Mini
Initial Capital : 100000 JPY
Test on a candle history of : 50K
Spread : 2
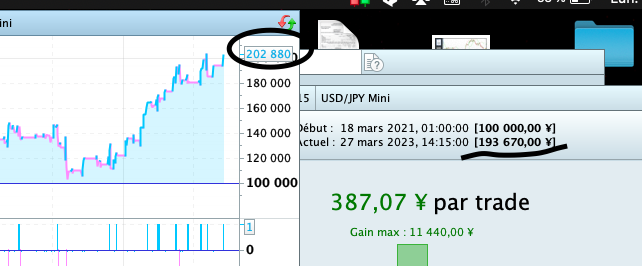
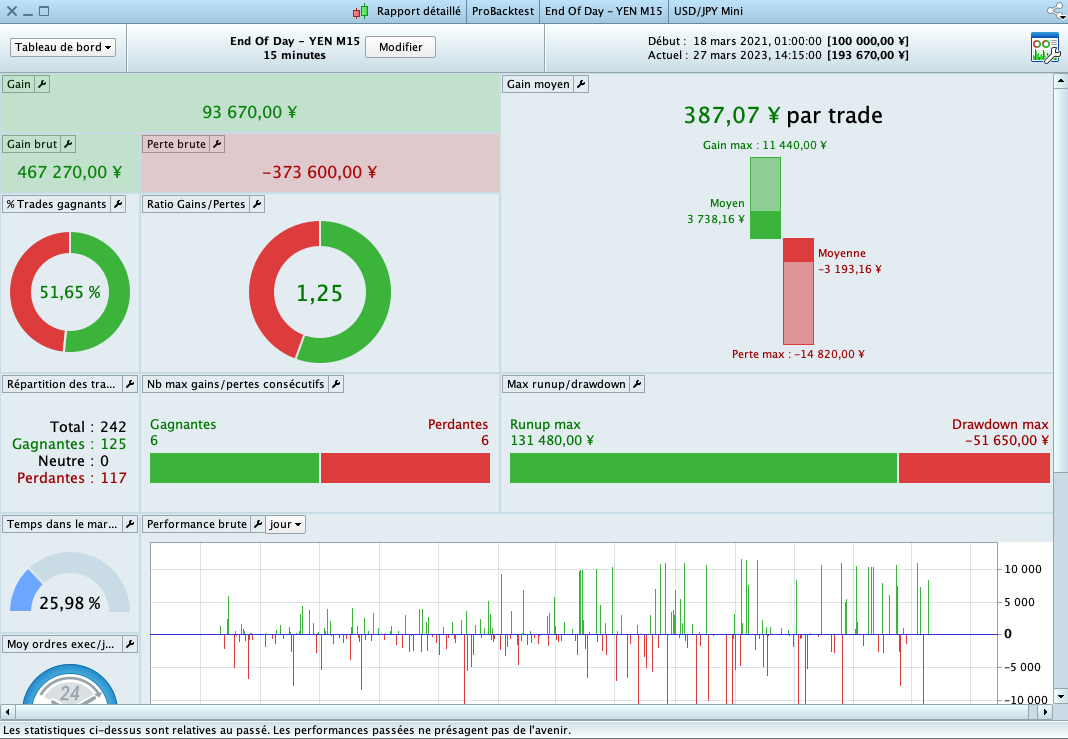
Here are the results of the original strategy without any modifications (see photo)
Someone can tell me why there is a difference between the result of equity of : 202 880 JPY and 193 670 JPY, maybe the spread fees is calculated only in the detailed report ?
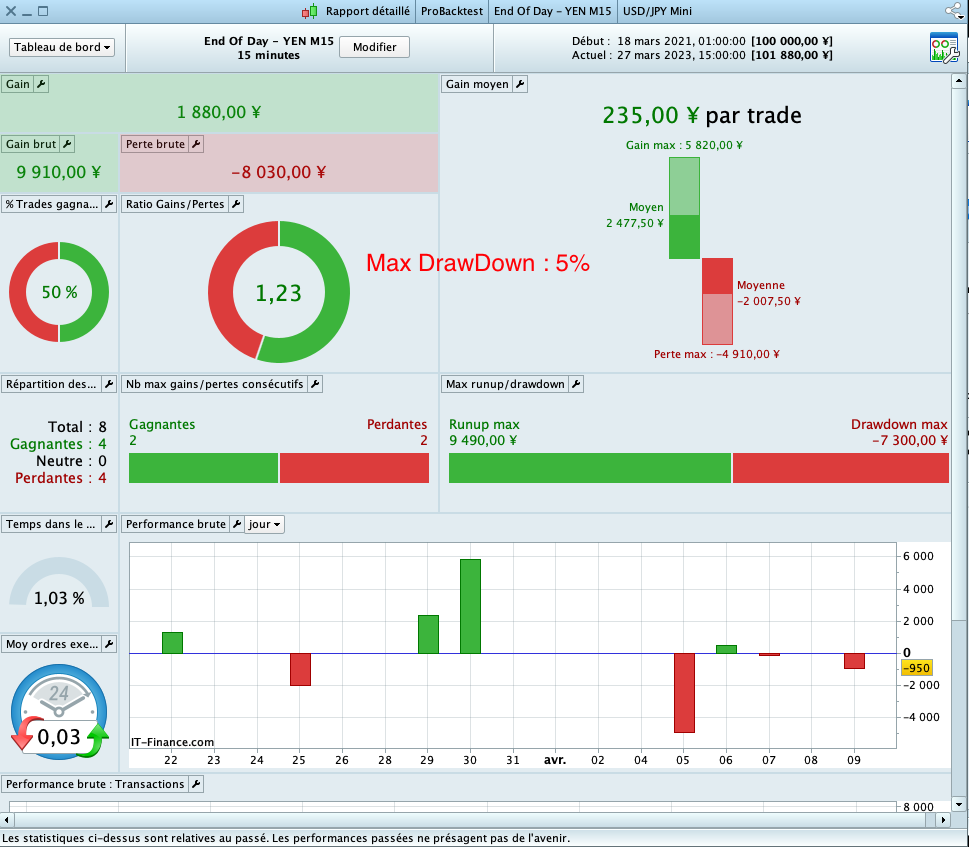
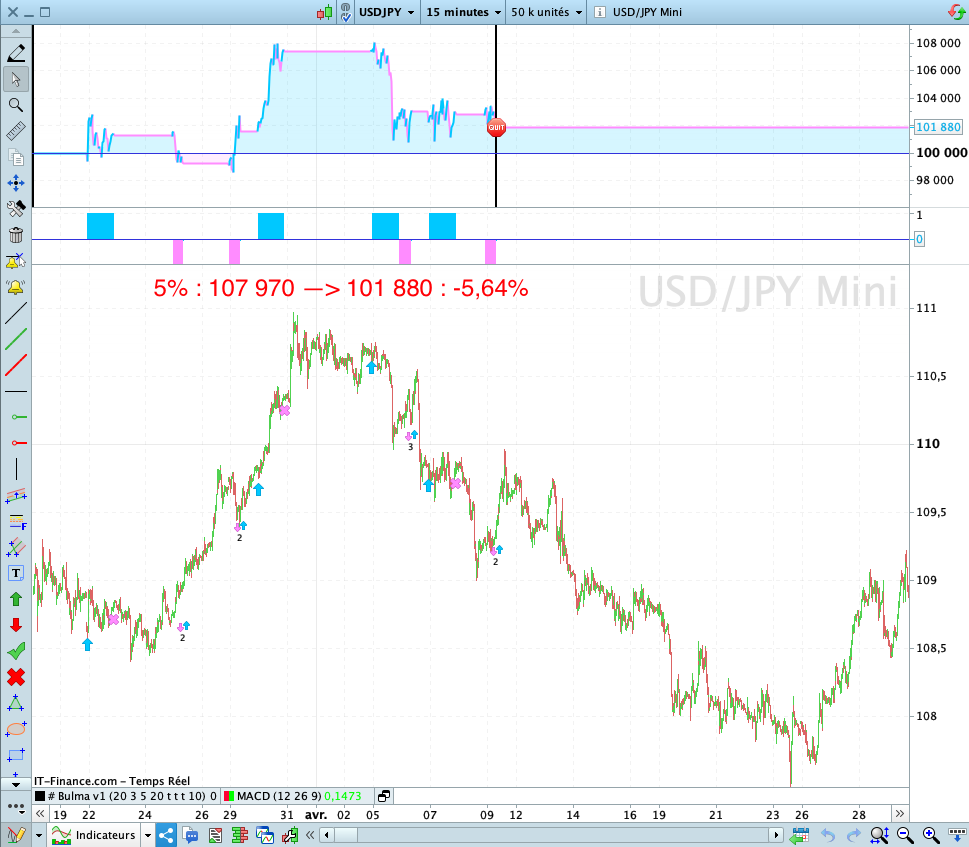
lets start with some backtest with a max DrowDawn of 5%, the result is -5,64% from the equity, you can see the screen short
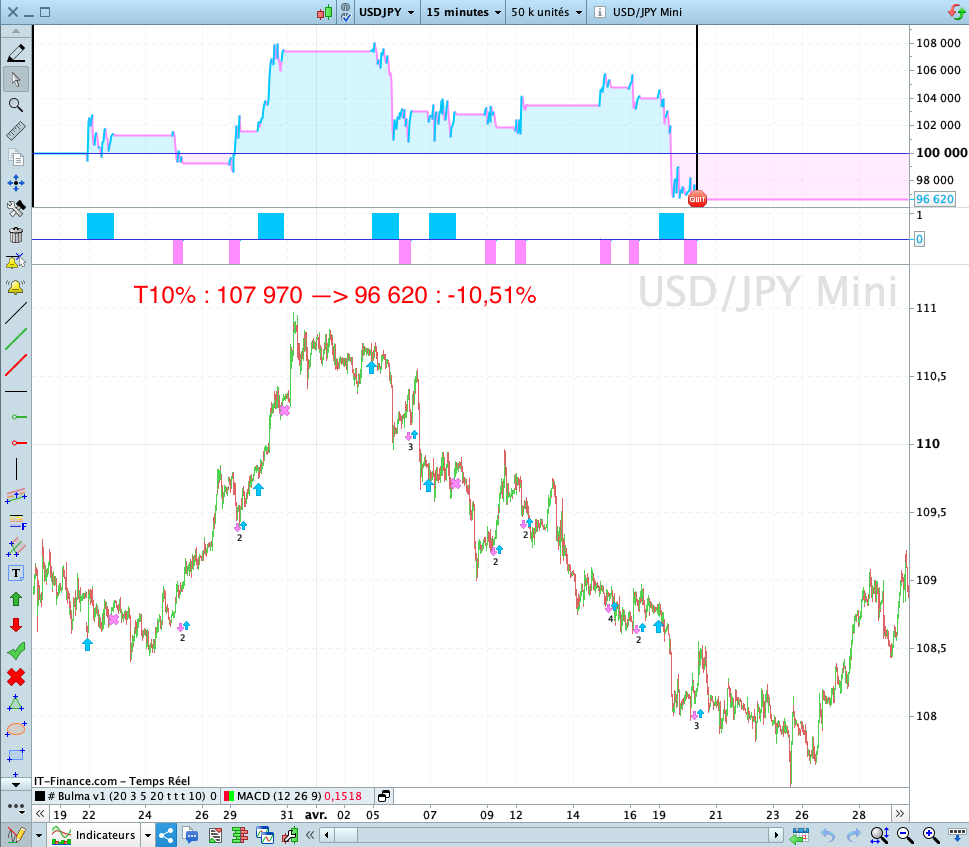
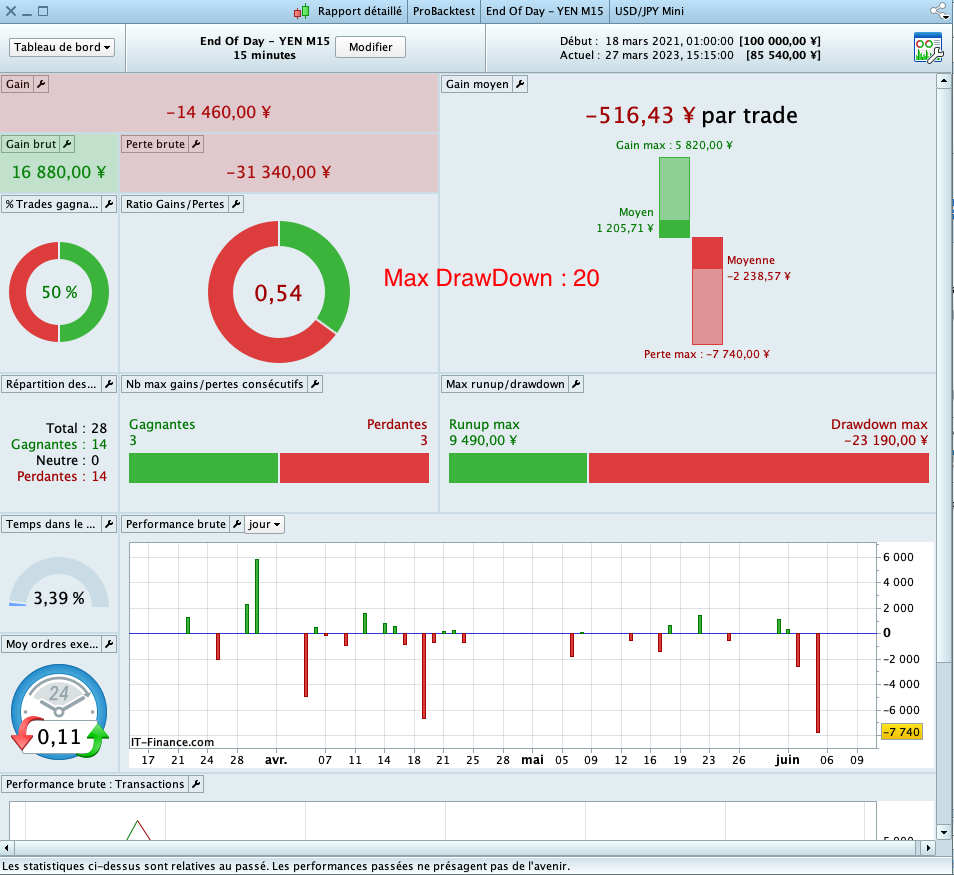
with a max DrowDawn of 10%, the result is -10,51% from the equity, you can see the screen short
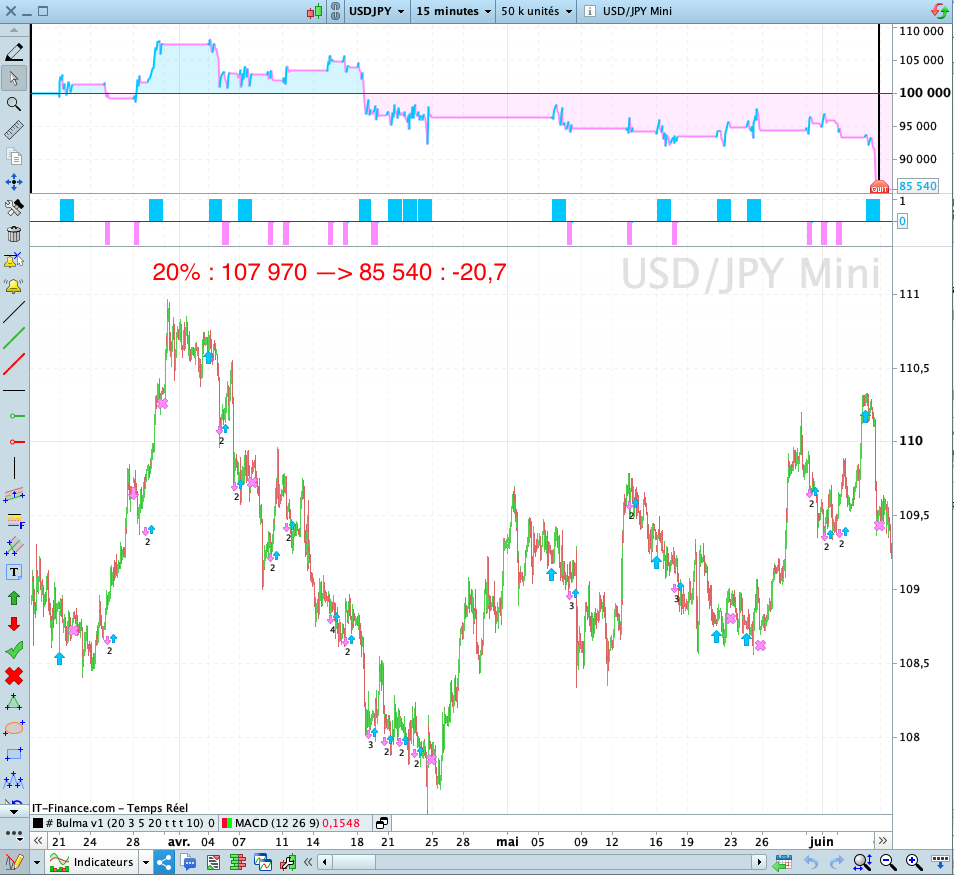
with a max DrowDawn of 20%, the result is -20,77% from the equity, you can see the screen short
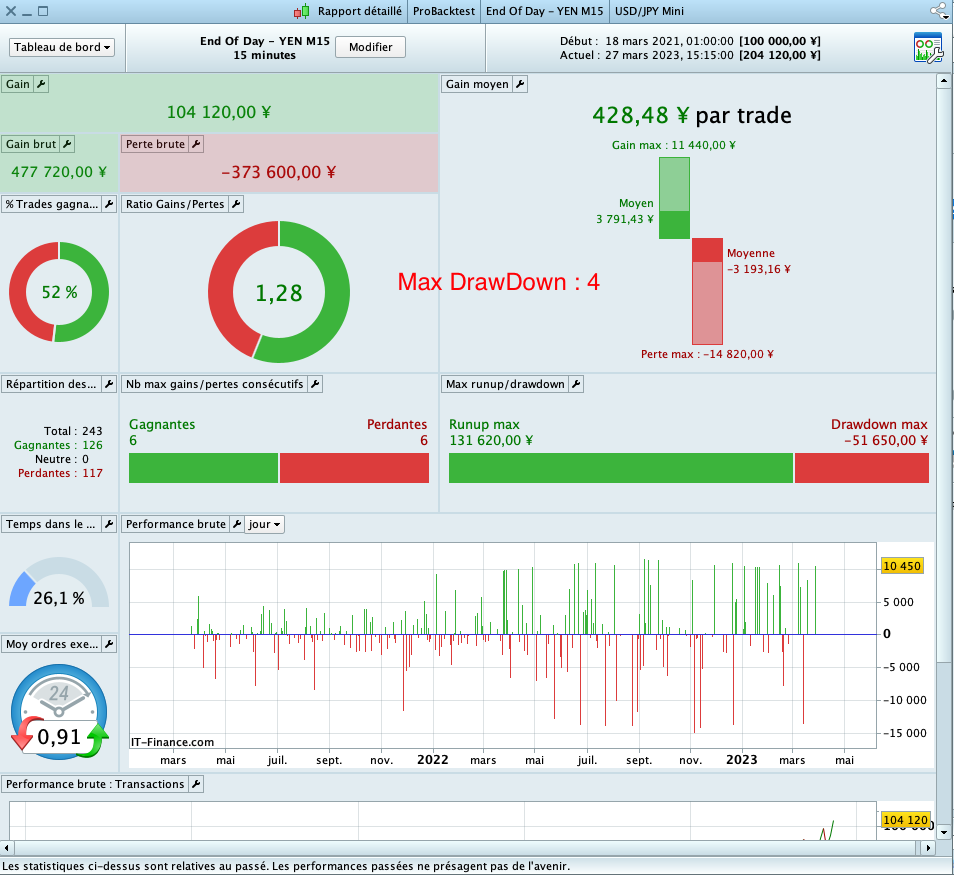
with a max DrowDawn of 40%, the result is +100% from the equity, you can see the screen short