EMA Proximity Filter Issue in Stock Screener — Help Needed
I’m encountering inconsistent results with my EMA proximity filter in a stock screener. The filter should only show stocks within a specified distance (in nATR units) from the 200EMA, but some stocks pass while others don’t—even when they meet the criteria.
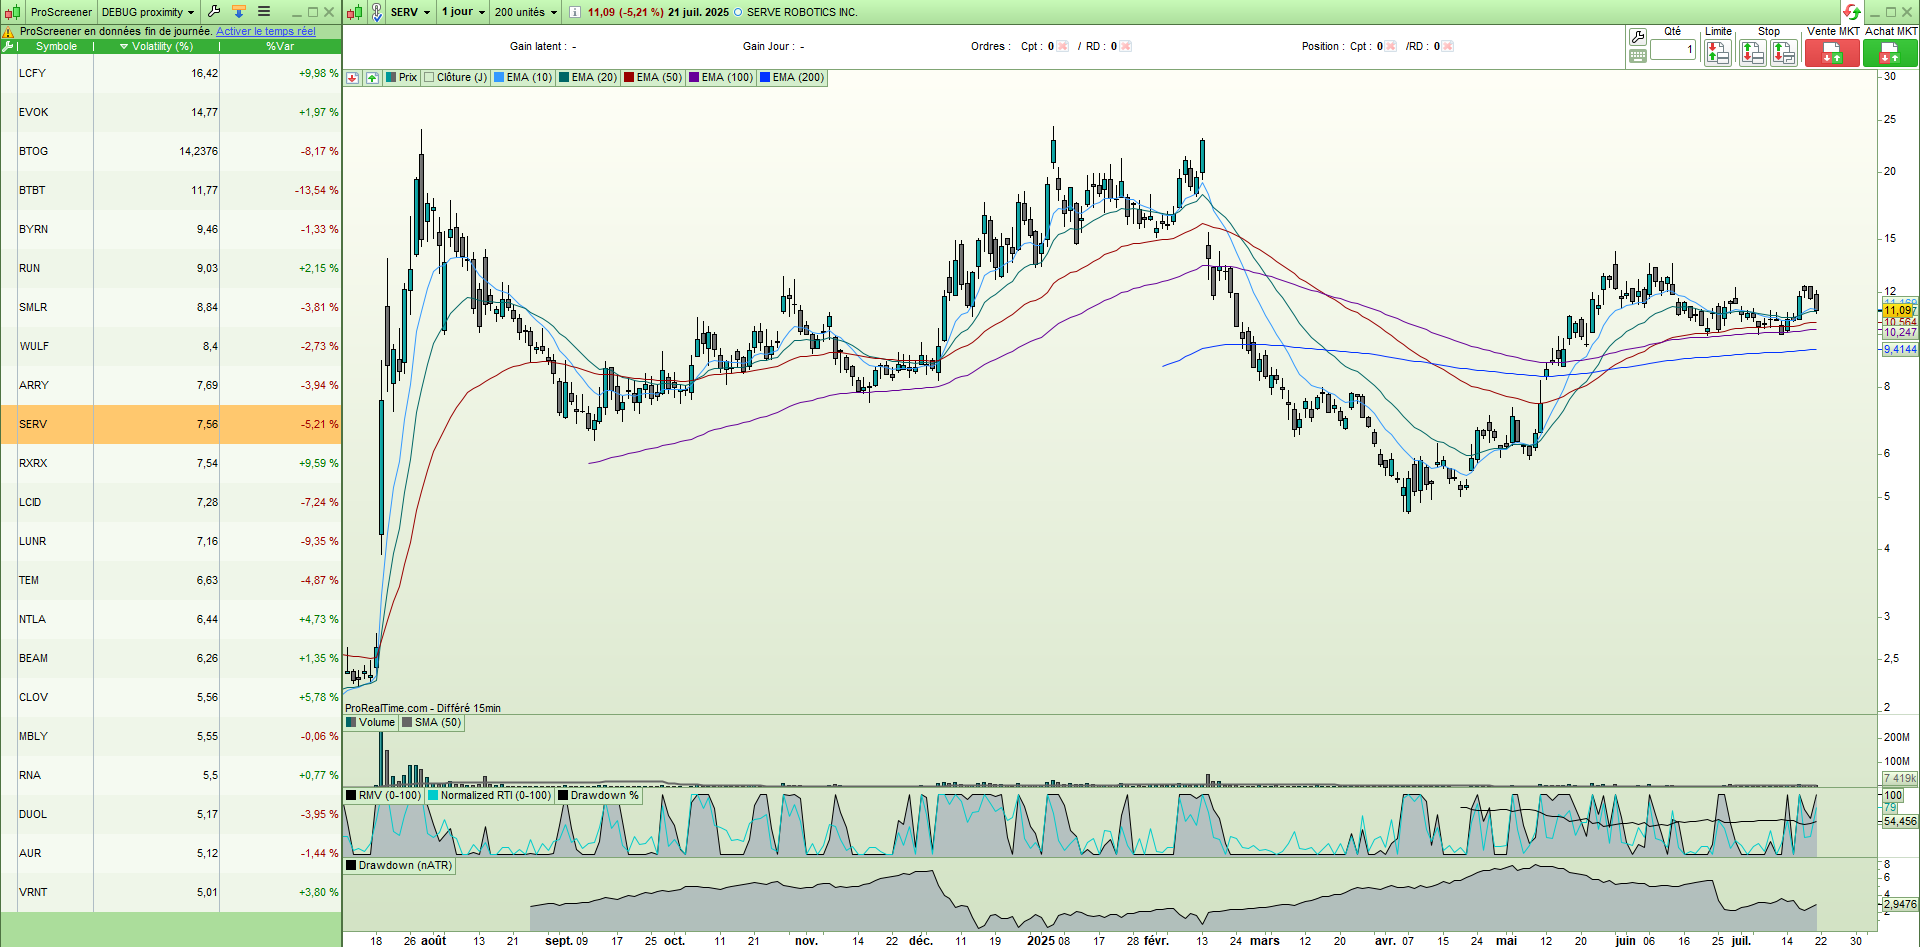
Examples (Scanning NASDAQ):
$SERV
ATR: 7.6%
Distance from EMA: 15%
nATR distance ≈ 1.97 → Should fail, but appears in scan
$GRRR
ATR: 11.6%
Distance from EMA: 4%
nATR distance ≈ 0.34 → Should pass, but missing from scan
Would appreciate your help on this, thank you.
Current ProScreener Code
// --- Main Parameters ---
atrPeriod = 14 // ATR calculation period
volumePeriod = 50 // Volume averaging period
emaPeriod = 200 // EMA period for proximity check
smaPeriod = 200 // SMA period for proximity check

// --- Moving Average Proximity Parameters ---
ONCE EnableMovingAverageCheck = 1 // Set to 1 to enable the EMA proximity check, 0 to disable
ONCE MaxNATRDistanceFromEMA = 1.0 // Maximum distance from EMA in nATR units
ONCE EnableSMACheck = 0 // Set to 1 to enable the SMA proximity check, 0 to disable
ONCE MaxNATRDistanceFromSMA = 1.0 // Maximum distance from SMA in nATR units

// --- Filter Parameters ---
minVolatility = 5 // Minimum acceptable volatility (nATR %)
maxVolatility = 99 // Maximum acceptable volatility (nATR %)
minLiquidity = 15000000 // Minimum avg currency volume
maxLiquidity = 10000000000000000 // Maximum avg daily currency volume

// --- Calculations ---
// 1. Volatility measurement (nATR)
atr = AverageTrueRange[atrPeriod](Close)
nATR = 100 * atr / Close // nATR as percentage of price

// 2. Liquidity measurement
avgVolume = Average[volumePeriod](Close * Volume)

// 3. Moving average calculations
emaX = ExponentialAverage[emaPeriod](Close)
smaX = Average[smaPeriod](Close)

// Calculate distances in nATR units
distanceFromEMA = 100 * ABS(Close - emaX) / Close  // Distance as percentage
nATRDistEmaX = distanceFromEMA / nATR              // Convert to nATR units

distanceFromSMA = 100 * ABS(Close - smaX) / Close
nATRDistSmaX = distanceFromSMA / nATR

// --- Apply All Filters ---
// Ensure we have enough data for calculations
IF BarIndex < volumePeriod OR BarIndex < emaPeriod THEN
valid = 0
ELSE
// 1. Volatility filter with range
cond1 = nATR >= minVolatility AND nATR <= maxVolatility

// 2. Liquidity filter with range
cond2 = avgVolume >= minLiquidity AND avgVolume <= maxLiquidity

// 3. Moving Average proximity checks
IF EnableMovingAverageCheck = 1 THEN
emaFilter = nATRDistEmaX <= MaxNATRDistanceFromEMA
ELSE
emaFilter = 1 // Always pass if disabled
ENDIF

IF EnableSMACheck = 1 THEN
smaFilter = nATRDistSmaX <= MaxNATRDistanceFromSMA
ELSE
smaFilter = 1 // Always pass if disabled
ENDIF

// Combined condition - ALL must be true
valid = cond1 AND cond2 AND emaFilter AND smaFilter
ENDIF

// Output result sorted by volatility
SCREENER[valid] SORT BY nATR AS "Volatility (%)"
The problem may be that you’re trying to calculate a 200-period exponential moving average with the free version of PRT. In the free version the screener has a capacity of 256 bars and in the premium 1024. Therefore the exponential moving average won’t be calculated correctly. You can easily check it:
// --- Main Parameters ---
emaPeriod = 200 // EMA period for proximity check
smaPeriod = 200 // SMA period for proximity check

ema=average[emaPeriod,1](close)
sma=average[smaPeriod,0](close)

// Output result sorted by volatility
screener(ema as "EMA", sma as "SMA")
Check the values obtained for the EMA and you’ll see that they’re not correct, whereas those for the SMA are.
Solution: reduce the number of periods…
Since I compute distance between last close and its EMA with a period smaller than the 256 capacity, I do not understand why there is not enough data for accurate results.
I could use a higher timeframe with lower MA period or purshase the premium version if capacity is the problem but I would like to understand why it is the problem in the first place.
Can you clarify this please?
Thank you
 JS
JSParticipant
Veteran
Hi,
An EMA is a recursive filter where each value is calculated using previous EMA values…
To achieve a stabilized and reliable calculation, approximately 3 times the chosen period is needed — in this case, 3 × 200 = 600 (history)candles…