//CAN THIS BE CONVERTED TO PRO REAL TIME PLEASE
// This source code is subject to the terms of the Mozilla Public License 2.0 at https://mozilla.org/MPL/2.0/
// © LonesomeTheBlue
//@version=5
indicator(‘3rd Wave’, overlay=true, max_bars_back=500, max_lines_count=500, max_labels_count=500)
// import necessary functions to calculate and show the zigzag
import LonesomeTheBlue/CreateAndShowZigzag/1 as ZigZag
prd = input.int(defval=8, title=’ZigZag Period’, minval=2, maxval=50, group=’setup’)
ret_rate_min = input.float(defval=0.382, title=’Min/Max Retracements’, minval=0.100, maxval=0.900, inline=’retrate’, group=’setup’)
ret_rate_max = input.float(defval=0.786, title=”, minval=0.100, maxval=0.900, inline=’retrate’, group=’setup’)
checkvol_support = input.bool(defval=true, title=’Check Volume Support’, group=’setup’)
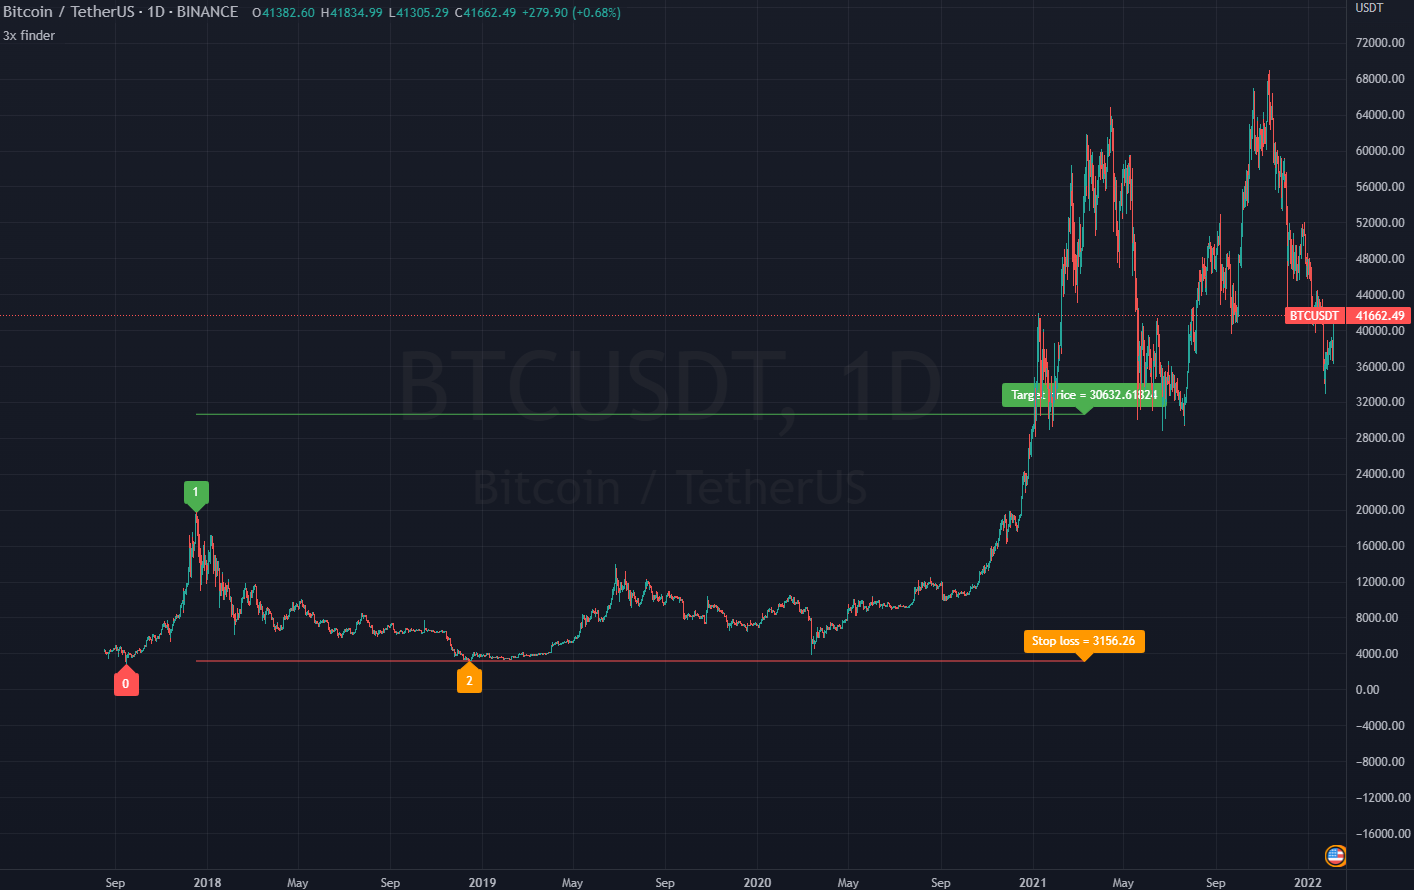
target1_enb = input.bool(defval=true, title=’Target 1′, inline=’t1′, group=’targets’)
target1_ret = input.float(defval=1., title=”, inline=’t1′, group=’targets’, tooltip = “%X of wave 1 from the begining of wave 2″)
target2_enb = input.bool(defval=true, title=’Target 2′, inline=’t2′, group=’targets’)
target2_ret = input.float(defval=1.618, title=”, inline=’t2′, group=’targets’, tooltip = “%X of wave 1 from the begining of wave 2″)
target3_enb = input.bool(defval=false, title=’Target 3′, inline=’t3′, group=’targets’)
target3_ret = input.float(defval=2.618, title=”, inline=’t3′, group=’targets’, tooltip = “%X of wave 1 from the begining of wave 2″)
target4_enb = input.bool(defval=false, title=’Target 4′, inline=’t4′, group=’targets’)
target4_ret = input.float(defval=3.618, title=”, inline=’t4′, group=’targets’, tooltip = “%X of wave 1 from the begining of wave 2″)
showwave12 = input.bool(defval=true, title=’Show Wave 1 and 2′, group=’colors’)
showbo = input.bool(defval=true, title=’Zone’, inline=’bocol’, group=’colors’)
bupcol = input.color(defval=color.rgb(0, 255, 0, 85), title=”, inline=’bocol’, group=’colors’)
bdncol = input.color(defval=color.rgb(255, 0, 0, 85), title=”, inline=’bocol’, group=’colors’)
showzigzag = input.bool(defval=false, title=’Zig Zag’, inline=’zzcol’, group=’colors’)
upcol = input.color(defval=color.lime, title=”, inline=’zzcol’, group=’colors’)
dncol = input.color(defval=color.red, title=”, inline=’zzcol’, group=’colors’)
// definitions for zigzag arrays
var max_array_size = 10 // max length for zigzag array
var zigzag = array.new_float(0)
oldzigzag = array.copy(zigzag) // keep old zigzag
// get the zigzag
dir = ZigZag.getZigzag(zigzag, prd, max_array_size)
// show the zigzag
if showzigzag
ZigZag.showZigzag(zigzag, oldzigzag, dir, upcol, dncol)
int len = array.size(zigzag) >= 8 ? bar_index – math.round(array.get(zigzag, 7)) : 1
bool vol_support = (not checkvol_support or (checkvol_support and ta.linreg(volume, len, 0) – ta.linreg(volume, len, 1) > 0))
var bool can_check_it = true
bool thereisbo = false
if (dir != dir[1])
can_check_it := true
can_check_it
// check if there is possible 3rd wave and show breakout if there is any
if array.size(zigzag) >= 8 and can_check_it
w12 = math.abs(array.get(zigzag, 2) – array.get(zigzag, 4)) / math.abs(array.get(zigzag, 4) – array.get(zigzag, 6))
if w12 >= ret_rate_min and w12 <= ret_rate_max and (dir == 1 and high > array.get(zigzag, 4) or dir == -1 and low < array.get(zigzag, 4))
can_check_it := false
if vol_support
thereisbo := true
// draw bo
if showbo
box.new(left=math.round(array.get(zigzag, 7)), top=array.get(zigzag, 4), right=bar_index, bottom=array.get(zigzag, 6), border_color=color.blue, border_width=1, border_style=line.style_dotted, bgcolor=dir == 1 ? bupcol : bdncol)
if showwave12
line.new(x1=math.round(array.get(zigzag, 7)), y1=array.get(zigzag, 6), x2=math.round(array.get(zigzag, 5)), y2=array.get(zigzag, 4))
line.new(x1=math.round(array.get(zigzag, 5)), y1=array.get(zigzag, 4), x2=math.round(array.get(zigzag, 3)), y2=array.get(zigzag, 2))
label.new(x=math.round(array.get(zigzag, 7)), y=array.get(zigzag, 6), text=’0′, color=color.new(color.white, 100), textcolor=color.blue, style=dir == 1 ? label.style_label_up : label.style_label_down)
label.new(x=math.round(array.get(zigzag, 5)), y=array.get(zigzag, 4), text=’1′, color=color.new(color.white, 100), textcolor=color.blue, style=dir == 1 ? label.style_label_down : label.style_label_up)
label.new(x=math.round(array.get(zigzag, 3)), y=array.get(zigzag, 2), text=’2′, color=color.new(color.white, 100), textcolor=color.blue, style=dir == 1 ? label.style_label_up : label.style_label_down)
// draw label
label.new(x=bar_index, y=array.get(zigzag, 6), color=dir == 1 ? upcol : dncol, style=dir == 1 ? label.style_triangleup : label.style_triangledown, size=size.small)
base = array.get(zigzag, 2)
wave1 = math.abs(array.get(zigzag, 4) – array.get(zigzag, 6))
if target1_enb
line.new(x1=bar_index, y1=math.max(base + dir * wave1 * target1_ret, 0), x2=math.round(array.get(zigzag, 7)), y2=math.max(base + dir * wave1 * target1_ret, 0), style=line.style_dashed)
if target2_enb
line.new(x1=bar_index, y1=math.max(base + dir * wave1 * target2_ret, 0), x2=math.round(array.get(zigzag, 7)), y2=math.max(base + dir * wave1 * target2_ret, 0), style=line.style_dashed)
if target3_enb
line.new(x1=bar_index, y1=math.max(base + dir * wave1 * target3_ret, 0), x2=math.round(array.get(zigzag, 7)), y2=math.max(base + dir * wave1 * target3_ret, 0), style=line.style_dashed)
if target4_enb
line.new(x1=bar_index, y1=math.max(base + dir * wave1 * target4_ret, 0), x2=math.round(array.get(zigzag, 7)), y2=math.max(base + dir * wave1 * target4_ret, 0), style=line.style_dashed)
alertcondition(thereisbo and dir == 1, title = “Breakout Long”, message = “Breakout Long”)
alertcondition(thereisbo and dir == -1, title = “Breakout Short”, message = “Breakout Short”)