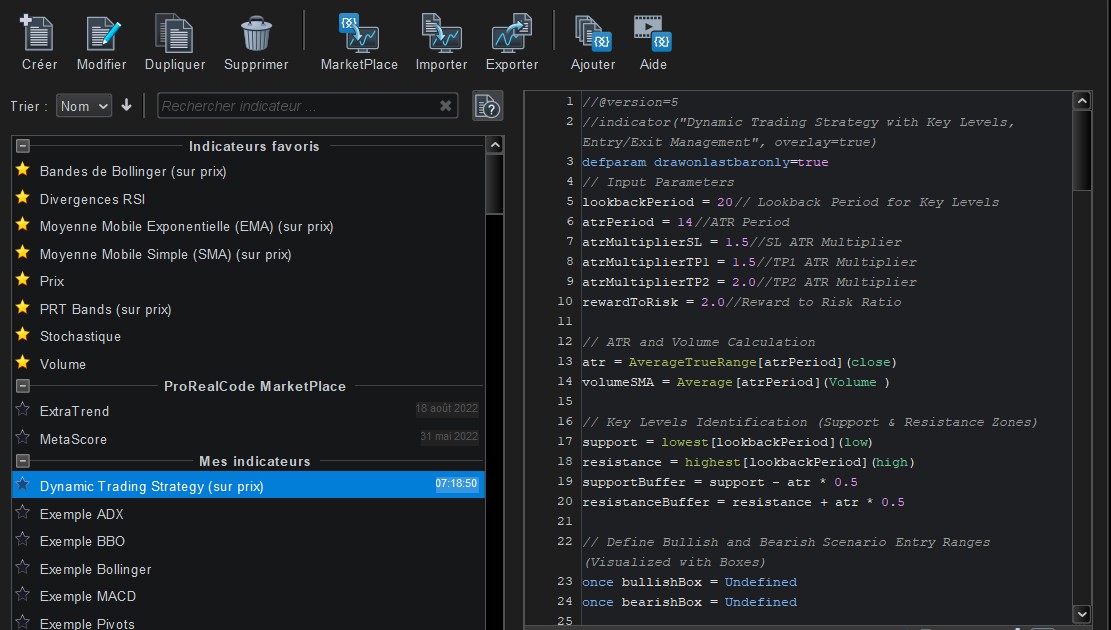
//@version=5
//indicator(“Dynamic Trading Strategy with Key Levels, Entry/Exit Management”, overlay=true)
defparam drawonlastbaronly=true
// Input Parameters
lookbackPeriod = 20// Lookback Period for Key Levels
atrPeriod = 14//ATR Period
atrMultiplierSL = 1.5//SL ATR Multiplier
atrMultiplierTP1 = 1.5//TP1 ATR Multiplier
atrMultiplierTP2 = 2.0//TP2 ATR Multiplier
rewardToRisk = 2.0//Reward to Risk Ratio
// ATR and Volume Calculation
atr = AverageTrueRange[atrPeriod](close)
volumeSMA = Average[atrPeriod](Volume )
// Key Levels Identification (Support & Resistance Zones)
support = lowest[lookbackPeriod](low)
resistance = highest[lookbackPeriod](high)
supportBuffer = support – atr * 0.5
resistanceBuffer = resistance + atr * 0.5
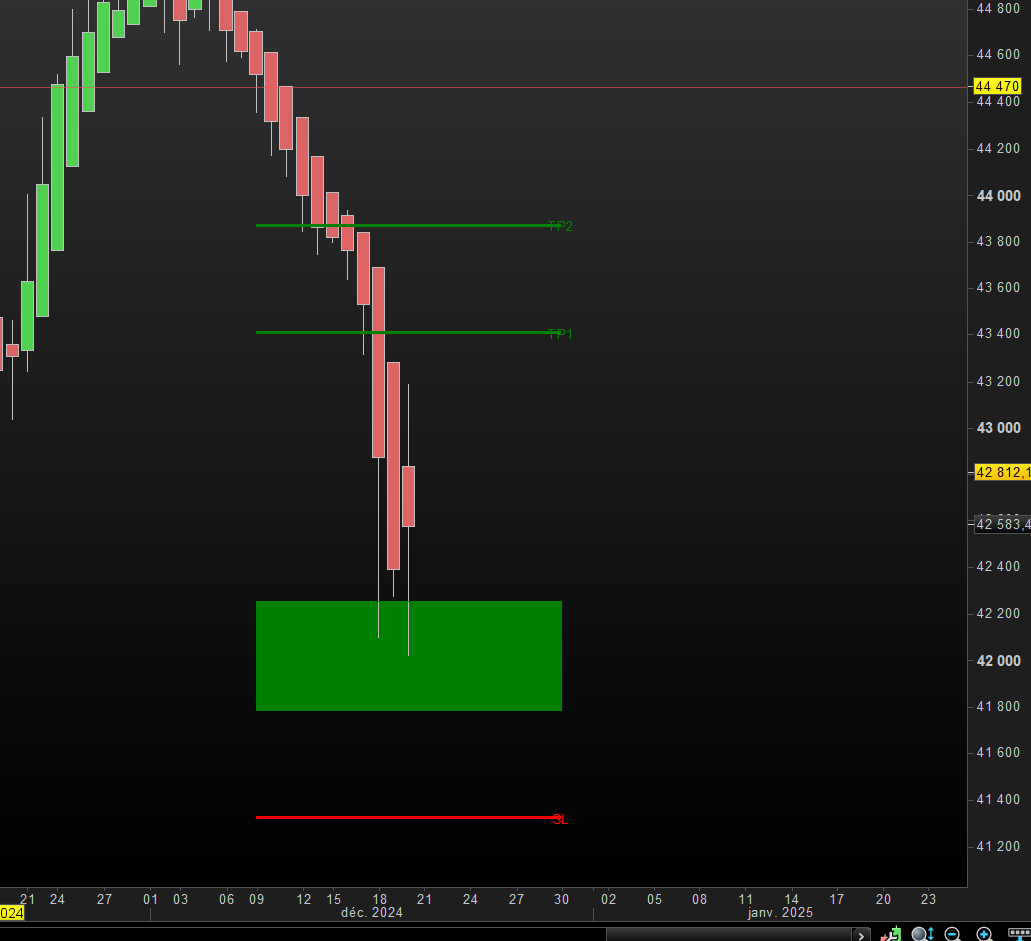
// Define Bullish and Bearish Scenario Entry Ranges (Visualized with Boxes)
once bullishBox = Undefined
once bearishBox = Undefined
// Bullish Scenario
isBullishEntry = (close > supportBuffer) and (low <= support) and (volume > volumeSMA)
if isBullishEntry then
if bullishBox then
DRAWRECTANGLE(barindex– 10, support + atr * 0.5 ,barindex+ 10, support – atr * 0.5) COLOURED(“green”) BORDERCOLOR(“green”)
else
DRAWRECTANGLE(barindex– 10, support + atr * 0.5 ,barindex+ 10, support – atr * 0.5) COLOURED(“green”)BORDERCOLOR(“green”)
endif
endif
// Bearish Scenario
isBearishEntry = (close < resistanceBuffer) and (high >= resistance) and (volume > volumeSMA)
if isBearishEntry then
if bearishBox then
DRAWRECTANGLE(barindex– 10, resistance + atr * 0.5 ,barindex+ 10, resistance– atr * 0.5) COLOURED(“red”)BORDERCOLOR(“red”)
else
DRAWRECTANGLE(barindex– 10, resistance + atr * 0.5 ,barindex+ 10, resistance– atr * 0.5) COLOURED(“red”)BORDERCOLOR(“red”)
endif
endif
// Stop Loss and Take Profit Calculations for Bullish and Bearish Scenarios
bullishSL = support – atr * atrMultiplierSL
bullishTP1 = support + atr * rewardToRisk * atrMultiplierTP1
bullishTP2 = support + atr * rewardToRisk * atrMultiplierTP2
bearishSL = resistance + atr * atrMultiplierSL
bearishTP1 = resistance – atr * rewardToRisk * atrMultiplierTP1
bearishTP2 = resistance – atr * rewardToRisk * atrMultiplierTP2
// Visualization for Bullish Scenario (TP1, TP2, SL Lines with Labels)
once bullishTP1Line = Undefined
once bullishTP2Line = Undefined
once bullishSLLine = Undefined
once bullishTP1Label = Undefined
once bullishTP2Label = Undefined
once bullishSLLabel = Undefined
if isBullishEntry then
if bullishTP1Line then
DRAWSEGMENT(barindex– 10, bullishTP1, barindex+ 10, bullishTP1) coloured(“green”)style(line,2)
else
DRAWSEGMENT(barindex– 10, bullishTP1, barindex+ 10, bullishTP1) coloured(“green”)style(line,2)
endif
if bullishTP1Label then
DRAWTEXT(“TP1”, barindex+ 10, bullishTP1) coloured(“green”)
else
DRAWTEXT(“TP1”, barindex+ 10, bullishTP1) coloured(“green”)
endif
if bullishTP2Line then
DRAWSEGMENT(barindex– 10, bullishTP2, barindex+ 10, bullishTP2) coloured(“green”)style(line,2)
else
DRAWSEGMENT(barindex– 10, bullishTP2, barindex+ 10, bullishTP2) coloured(“green”)style(line,2)
endif
if bullishTP2Label then
DRAWTEXT(“TP2”, barindex+ 10, bullishTP2) coloured(“green”)
else
DRAWTEXT(“TP2”, barindex+ 10, bullishTP2) coloured(“green”)
endif
if bullishSLLine then
DRAWSEGMENT(barindex– 10, bullishSL, barindex+ 10, bullishSL) coloured(“red”)style(line,2)
else
DRAWSEGMENT(barindex– 10, bullishSL, barindex+ 10, bullishSL) coloured(“red”)style(line,2)
endif
if bullishSLLabel then
DRAWTEXT(“SL”, barindex+ 10, bullishSL) coloured(“red”)
else
DRAWTEXT(“SL”, barindex+ 10, bullishSL) coloured(“red”)
endif
endif
// Visualization for Bearish Scenario (TP1, TP2, SL Lines with Labels)
once bearishTP1Line = Undefined
once bearishTP2Line = Undefined
once bearishSLLine = Undefined
once bearishTP1Label = Undefined
once bearishTP2Label = Undefined
once bearishSLLabel = Undefined
if isBearishEntry then
if bearishTP1Line then
DRAWSEGMENT(barindex– 10, bearishTP1, barindex+ 10, bearishTP1) coloured(“red”)style(line,2)
else
DRAWSEGMENT(barindex– 10, bearishTP1, barindex+ 10, bearishTP1) coloured(“red”)style(line,2)
endif
if bearishTP1Label then
DRAWTEXT(“TP1”, barindex+ 10, bearishTP1) coloured(“red”)
else
DRAWTEXT(“TP1”, barindex+ 10, bearishTP1) coloured(“red”)
endif
if bearishTP2Line then
DRAWSEGMENT(barindex– 10, bearishTP2, barindex+ 10, bearishTP2) coloured(“red”)style(line,2)
else
DRAWSEGMENT(barindex– 10, bearishTP2, barindex+ 10, bearishTP2) coloured(“red”)style(line,2)
endif
if bearishTP2Label then
DRAWTEXT(“TP1”, barindex+ 10, bearishTP2) coloured(“red”)
else
DRAWTEXT(“TP1”, barindex+ 10, bearishTP2) coloured(“red”)
endif
if bearishSLLine then
DRAWSEGMENT(barindex– 10, bearishSL, barindex+ 10, bearishSL) coloured(“green”)style(line,2)
else
DRAWSEGMENT(barindex– 10, bearishSL, barindex+ 10, bearishSL) coloured(“green”)style(line,2)
endif
if bearishSLLabel then
DRAWTEXT(“SL”, barindex+ 10, bearishSL) coloured(“green”)
else
DRAWTEXT(“SL”, barindex+ 10, bearishSL) coloured(“green”)
endif
endif
return