Bonjour je souhaiterai visualiser sur le graphique des cours la droite de régression linéaire basée sur les critères suivants :
-droite de régression calculée sur au moins 4 derniers plus hauts (voire plus si besoin)
-période de max 40 bougies journalières
-coefficient de régression linéaire >0.95
ce serait top de l’afficher ainsi que son équation
pouvez vous m’aider pour cela
je vous remercie
-droite de régression calculée sur au moins 4 derniers plus hauts
Merci de définir comment trouver ces 4 derniers plus hauts.
Pour un plus haut il faudra les conditions suivantes :
-écart d’au moins 5 bougies avec le plus haut précédent
-le plus haut de la bougie du jour (ombre supérieures) est plus haut que le plus haut (ombre supérieure) du jour de la bougie précédente et que le plus haut du jour(ombre supérieure) de la bougie suivante
merci
Le code ci-dessous trace la régression linéaire des X derniers plus hauts telle que décrit.
defparam drawonlastbaronly=true
defparam calculateonlastbars=1000

topc = high<high[1] and high[1]>high[2] and topbar<barindex-5
//botc = low>low[1] and low[1]<low[2] and botbar<barindex-5
if topc then
topbar=barindex[1]
top=high[1]
//elsif botc then
//botbar=barindex[1]
//bot=low[1]
endif

//PRC_Std and Ste LinRegChannel | indicator
//Standard Deviation and Standard Error
//Linear Regression Channel
//12.03.2019
//Nicolas @ www.prorealcode.com
//Sharing ProRealTime knowledge

// --- settings
lookback= 40 //channel period
ChannelType = 1 //1= Standard Deviation ; 2= Standard Error
MinTop = 5
colorRed = 255
colorGreen = 255
colorBlue = 0
// --- end of settings

sumx = 0
sumy = 0
sumxy = 0
sumx2 = 0

count=0
prev=0
for cmpt = 0 to lookback do
tmpx = cmpt
tmpy = top[cmpt]
sumy = sumy+tmpy
sumx = sumx+tmpx
sumx2 = sumx2 + (tmpx*tmpx)
sumxy = sumxy + (tmpy*tmpx)
if tmpy<>prev then
drawtext("*",topbar[cmpt],top[cmpt],dialog,bold,16)
count=count+1
prev=tmpy
endif
if count>=MinTop then
lookback=cmpt
break
endif
next

n = lookback+1

if (sumx2 = sumx * sumx) then // protection to avoid infinite values
b = sumxy - sumx * sumy
else
b = (n * sumxy - sumx * sumy) / (n * sumx2 - sumx * sumx)
endif
a = (sumy - b * sumx) / n

if count>=MinTop then
drawsegment(barindex[lookback],a+b*lookback,barindex,a+b*0) coloured(colorRed,colorGreen,colorBlue)
endif

return //a
Merci beaucoup Nicolas je vais voir si je peux exploiter cela dans une stratégie et je reviens vers le forum
Autre version corrigée ci-dessous
defparam drawonlastbaronly=true
defparam calculateonlastbars=1000

topc = high<high[1] and high[1]>high[2] and topbar<barindex-5
//botc = low>low[1] and low[1]<low[2] and botbar<barindex-5
if topc then
topbar=barindex[1]
top=high[1]
//elsif botc then
//botbar=barindex[1]
//bot=low[1]
endif

//PRC_Std and Ste LinRegChannel | indicator
//Standard Deviation and Standard Error
//Linear Regression Channel
//12.03.2019
//Nicolas @ www.prorealcode.com
//Sharing ProRealTime knowledge

// --- settings
lookback= 40 //channel period
MinTop = 5
colorRed = 255
colorGreen = 255
colorBlue = 0
// --- end of settings

sumx = 0
sumy = 0
sumxy = 0
sumx2 = 0

count=1
prev=top
for cmpt = 0 to lookback do
if cmpt=0 then
drawtext("#count#",topbar[cmpt],top[cmpt],dialog,bold,16)
endif
tmpx = cmpt
tmpy = top[cmpt]
sumy = sumy+tmpy
sumx = sumx+tmpx
sumx2 = sumx2 + (tmpx*tmpx)
sumxy = sumxy + (tmpy*tmpx)
if tmpy<>prev then
count=count+1
drawtext("#count#",topbar[cmpt],top[cmpt],dialog,bold,16)
prev=tmpy
if count=MinTop then
lb=cmpt
break
endif
endif
next

n = lb+1

if (sumx2 = sumx * sumx) then // protection to avoid infinite values
b = sumxy - sumx * sumy
else
b = (n * sumxy - sumx * sumy) / (n * sumx2 - sumx * sumx)
endif
a = (sumy - b * sumx) / n

if count>=MinTop then
drawsegment(barindex[lookback],a+b*lookback,barindex,a+b*0) coloured(colorRed,colorGreen,colorBlue)
endif

return top,lookback//a
Merci bcp j’ai juste quelques petites questions si ce n’est pas trop prendre sur ton temps.
Si j’ai bien compris le compteur de 40 peux être changé , je l’ai mis à 80 mais il ne marque pas les plus hauts (voir ex sur PEUGEOT en PJ°
D’autre part est-il possible de connaitre le coefficient de régression linéaire
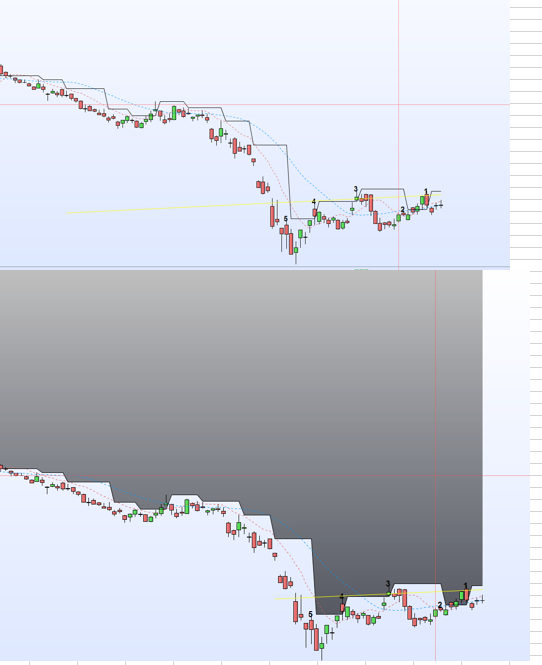
Enfin sur mes graphes il remplit en noir le dessus du graphe je ne comprends pas pourquoi
merci Nicolas
J’ai à nouveau corrigé le code pour être plus en adéquation avec ta demande initiale, ci-joint.
defparam drawonlastbaronly=true
defparam calculateonlastbars=1000

topc = high<high[1] and high[1]>high[2] and topbar<barindex-5
//botc = low>low[1] and low[1]<low[2] and botbar<barindex-5
if topc then
topbar=barindex[1]
top=high[1]
//elsif botc then
//botbar=barindex[1]
//bot=low[1]
endif

//PRC_Std and Ste LinRegChannel | indicator
//Standard Deviation and Standard Error
//Linear Regression Channel
//12.03.2019
//Nicolas @ www.prorealcode.com
//Sharing ProRealTime knowledge

// --- settings
lookback= 40 //channel period
MinTop = 5
colorRed = 255
colorGreen = 255
colorBlue = 0
// --- end of settings

sumx = 0
sumy = 0
sumxy = 0
sumx2 = 0

count=1
prev=top
for cmpt = 0 to lookback do
if cmpt=0 then
drawtext("#count#",topbar[cmpt],top[cmpt],dialog,bold,16)
endif
tmpx = cmpt
if topbar[cmpt]>barindex-lookback then
tmpy = top[cmpt]
endif

sumy = sumy+tmpy
sumx = sumx+tmpx
sumx2 = sumx2 + (tmpx*tmpx)
sumxy = sumxy + (tmpy*tmpx)

if tmpy<>prev then
count=count+1
drawtext("#count#",topbar[cmpt],top[cmpt],dialog,bold,16)
prev=tmpy
endif

next

n = lookback+1

if (sumx2 = sumx * sumx) then // protection to avoid infinite values
b = sumxy - sumx * sumy
else
b = (n * sumxy - sumx * sumy) / (n * sumx2 - sumx * sumx)
endif
a = (sumy - b * sumx) / n

if count>=MinTop then
drawsegment(barindex[lookback],a+b*lookback,barindex,a+b) coloured(colorRed,colorGreen,colorBlue)
endif

return
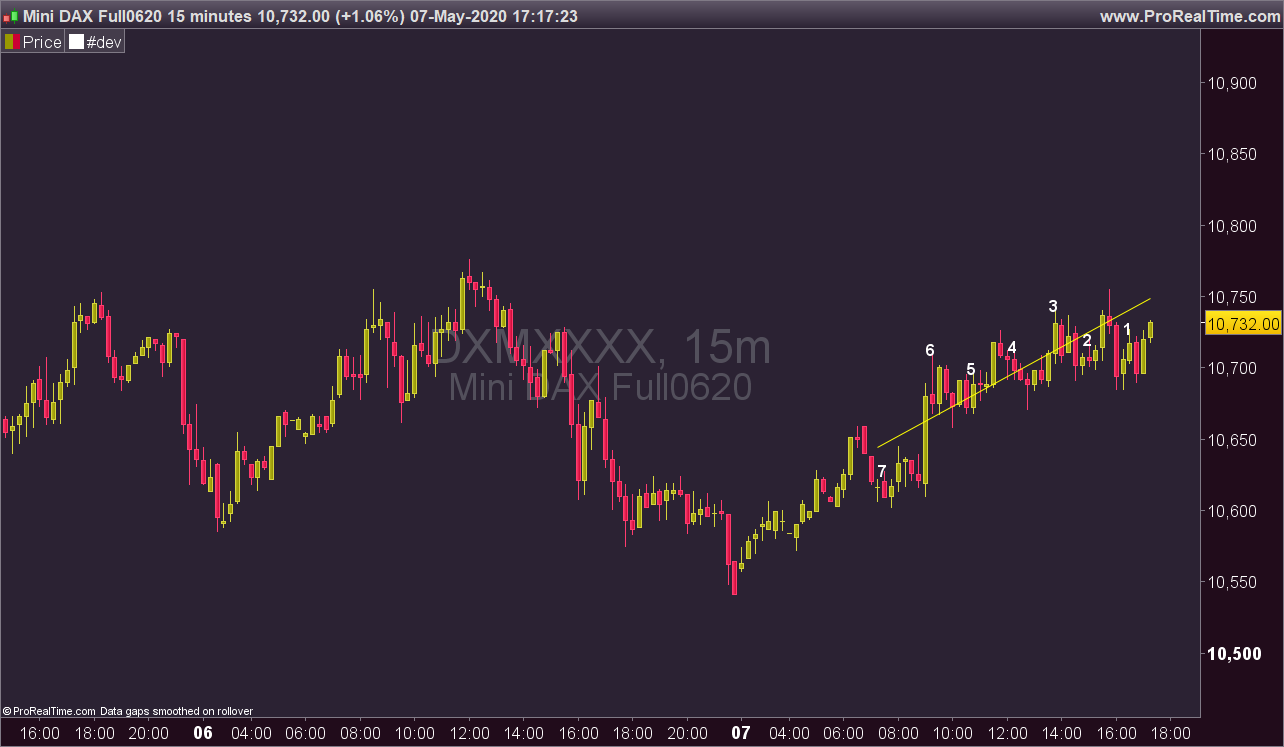
Merci Nicolas c’est TIP TOP maintenant. je vais essayer de coupler cela pour tracer des droites de tendance significatives. En gros je prends les 4 derniers plus haut (ou plus bas), je fais toutes les combinaisons de calculs de régression et je garde la meilleure avec un critère d’un R>0.99 alors on a une droite significative puis je remonte dans le temps pour chaque nouveau point haut : 2 possibilités il s’intègre à la régression=> on le rajoute, sinon on cherche celui d’avant et on refait les combinaisons
Merci en tout cas de ton aide tu as été au Top comme d’habitude
Super, j’attends ton retour pour nous faire voir ce que ça peut donner 🙂 Merci.