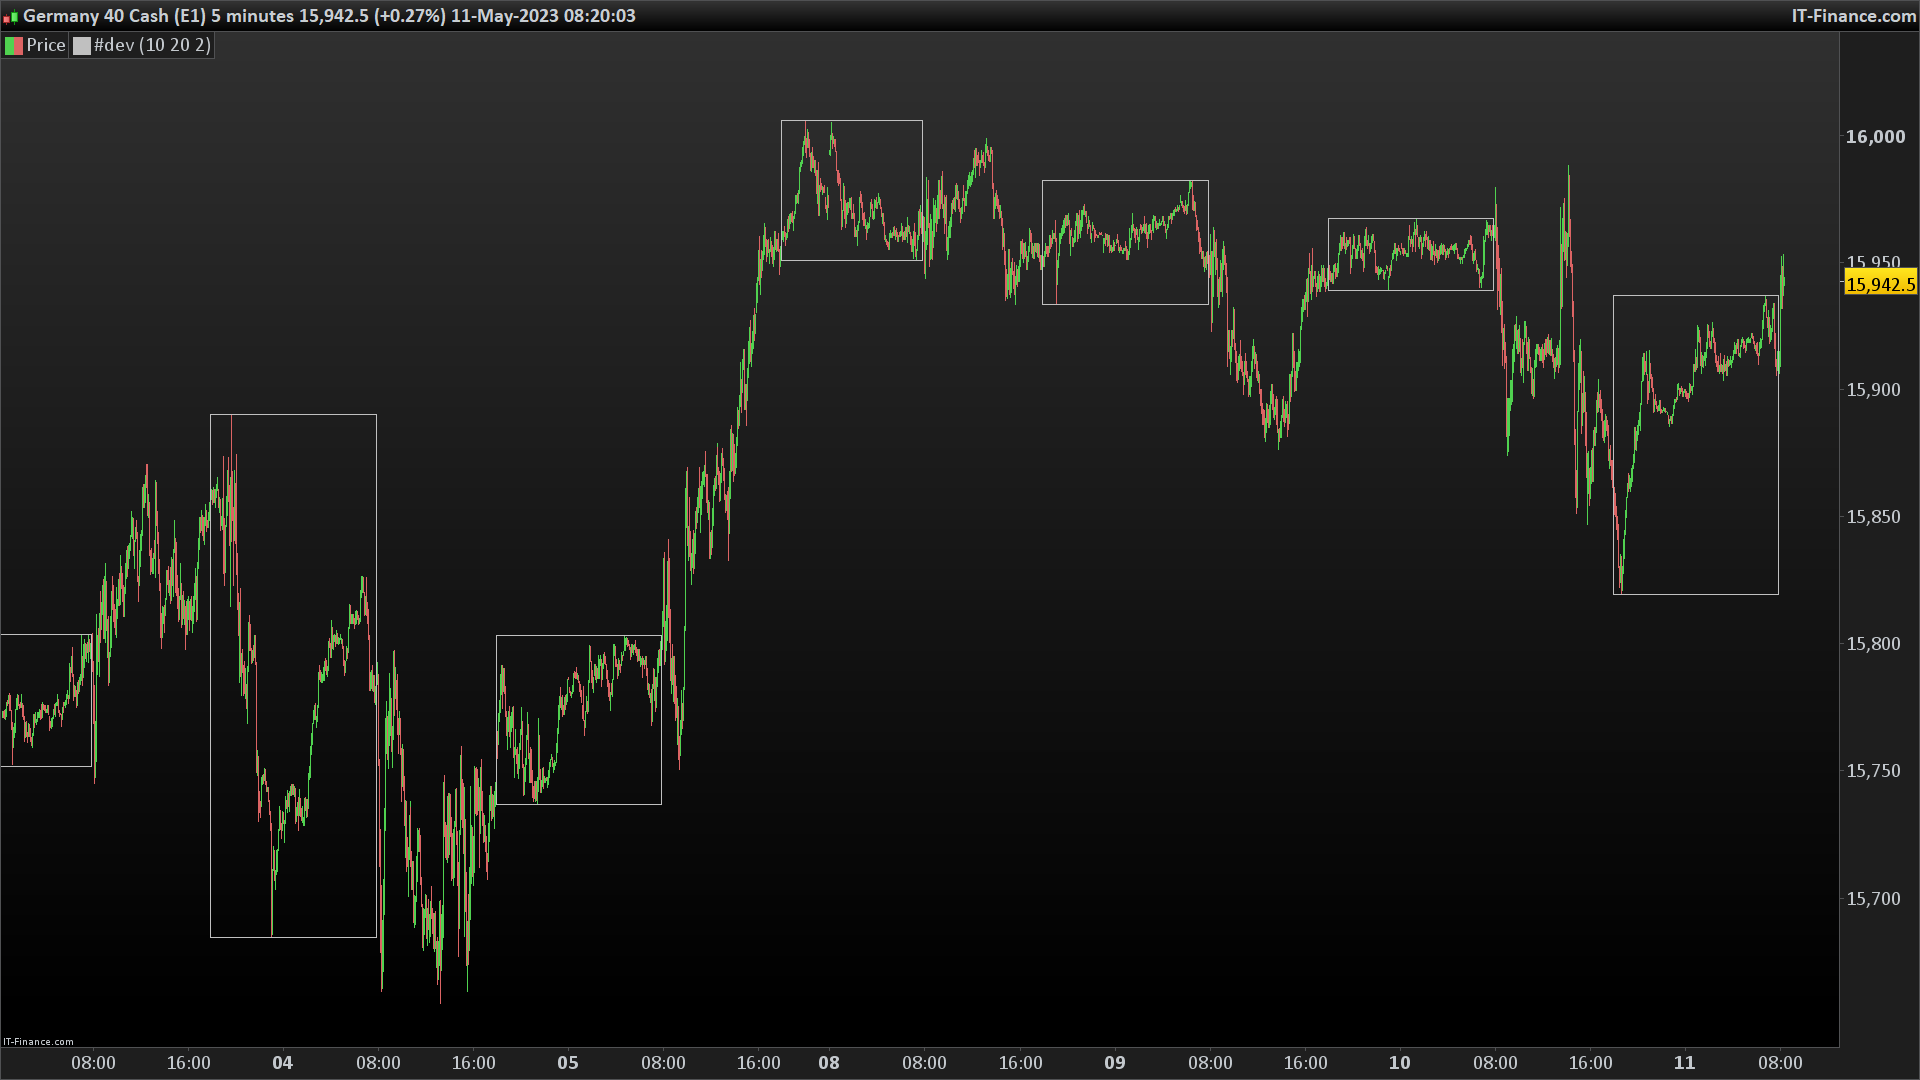
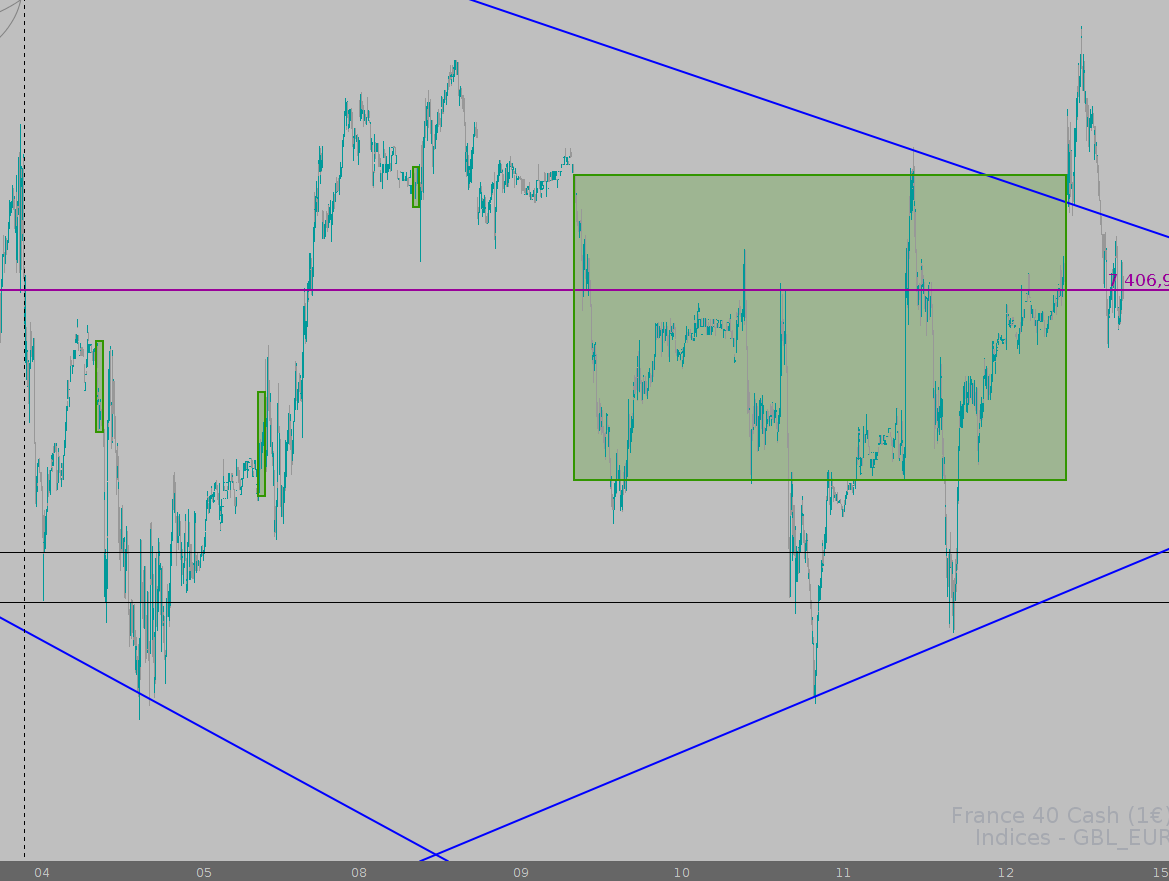
Bonjour Nicolas, bonjour à tous !
Je me résigne à venir poster sur le forum ne trouvant pas la réponse.
Je souhaite simplement afficher des rectangles entre 18h et 8h du matin identifiant les plus haut et plus bas.
Afin de comparer les journées et à des fins de réuitlisations, je souhaite que les valeurs x1,x2,y1,y2 puissent êtres stockés dans un tableau avec [array].
Quelqu’un aurait-il une esquisse de code ou de piste sérieuse ?
Par avance, merci.
Le code ci-dessous va tracer ses zones à cheval entre 2 journées sur l’ensemble de l’historique:
defparam drawonlastbaronly=true
start = time>=180000 and time<235900
end = time<080000 and time>=000000
if time=180000 then
i=i+1
$x1[i]=barindex
$y1[i]=low
$y2[i]=high
hh=high
ll=low
endif
if start or end then
$x2[i]=barindex
ll=min(ll,low)
hh=max(hh,high)
$y1[i]=ll
$y2[i]=hh
endif
if islastbarupdate and isset($x1[2]) then
for y = 1 to i do
drawrectangle($x1[y],$y1[y],$x2[y],$y2[y]) //plot in history
next
endif
return //hh,ll
Après test, c’est parfait !
Belle réactivité, c’est remarquable comme à chaque fois !
Question subsidiaire, comment puis-je réinitialiser ma variable $x1 pour la réutiliser dans un autre contexte de l’indicateur ?
Petit bémol…
J’ai tenter de modifier ce code pour ne prendre que la partie entre 8h et 9h.
Cela marche bien sur l’enssemble de l’historique sauf les 3 derniers jours ou il englobe le debut à 8h à J-3 jusqu’a ce jour 9h… une idée ?
Edit : le code
Debut = 080000
SessionKZ8 = time>=Debut and time<090000 //or (time<110000 and time>=100000)
IF time = Debut then
g=g+1
$x7[g]=barindex
$y7[g]=low
$y8[g]=high
BasKZ8=low
HautKZ8=high
endif
if SessionKZ8 then
$x8[g]=barindex
BasKZ8=min(BasKZ8,low)
HautKZ8=max(HautKZ8,high)
$y7[g]=BasKZ8
$y8[g]=HautKZ8
endif
if islastbarupdate and isset ($x7[1]) then
for y = 1 to g do
drawrectangle($x7[y],$y7[y],$x8[y],$y8[y])coloured(50,150,0,60) bordercolor(50,150,0)STYLE(line,2)
//drawsegment($x7[y],($y7[y]+$y8[y])/2,$x8[y],($y7[y]+$y8[y])/2)coloured(50,150,0,100)STYLE(line,2)
next
endif
Ce code est spécifique à l’overnight, puisque horaire à cheval entre 2 journées, tu peux essayer celui-ci pour un horaire dans la même journée:
defparam drawonlastbaronly=true
start = 090000
end = 091500
tc = time>=start and time<end
if tc and not tc[1] then
i=i+1
$x1[i]=barindex
$y1[i]=low
$y2[i]=high
hh=high
ll=low
endif
if tc then
$x2[i]=barindex
ll=min(ll,low)
hh=max(hh,high)
$y1[i]=ll
$y2[i]=hh
endif
if islastbarupdate and isset($x1[2]) then
for y = 1 to i do
drawrectangle($x1[y],$y1[y],$x2[y],$y2[y]) //plot in history
next
endif
return //hh,ll