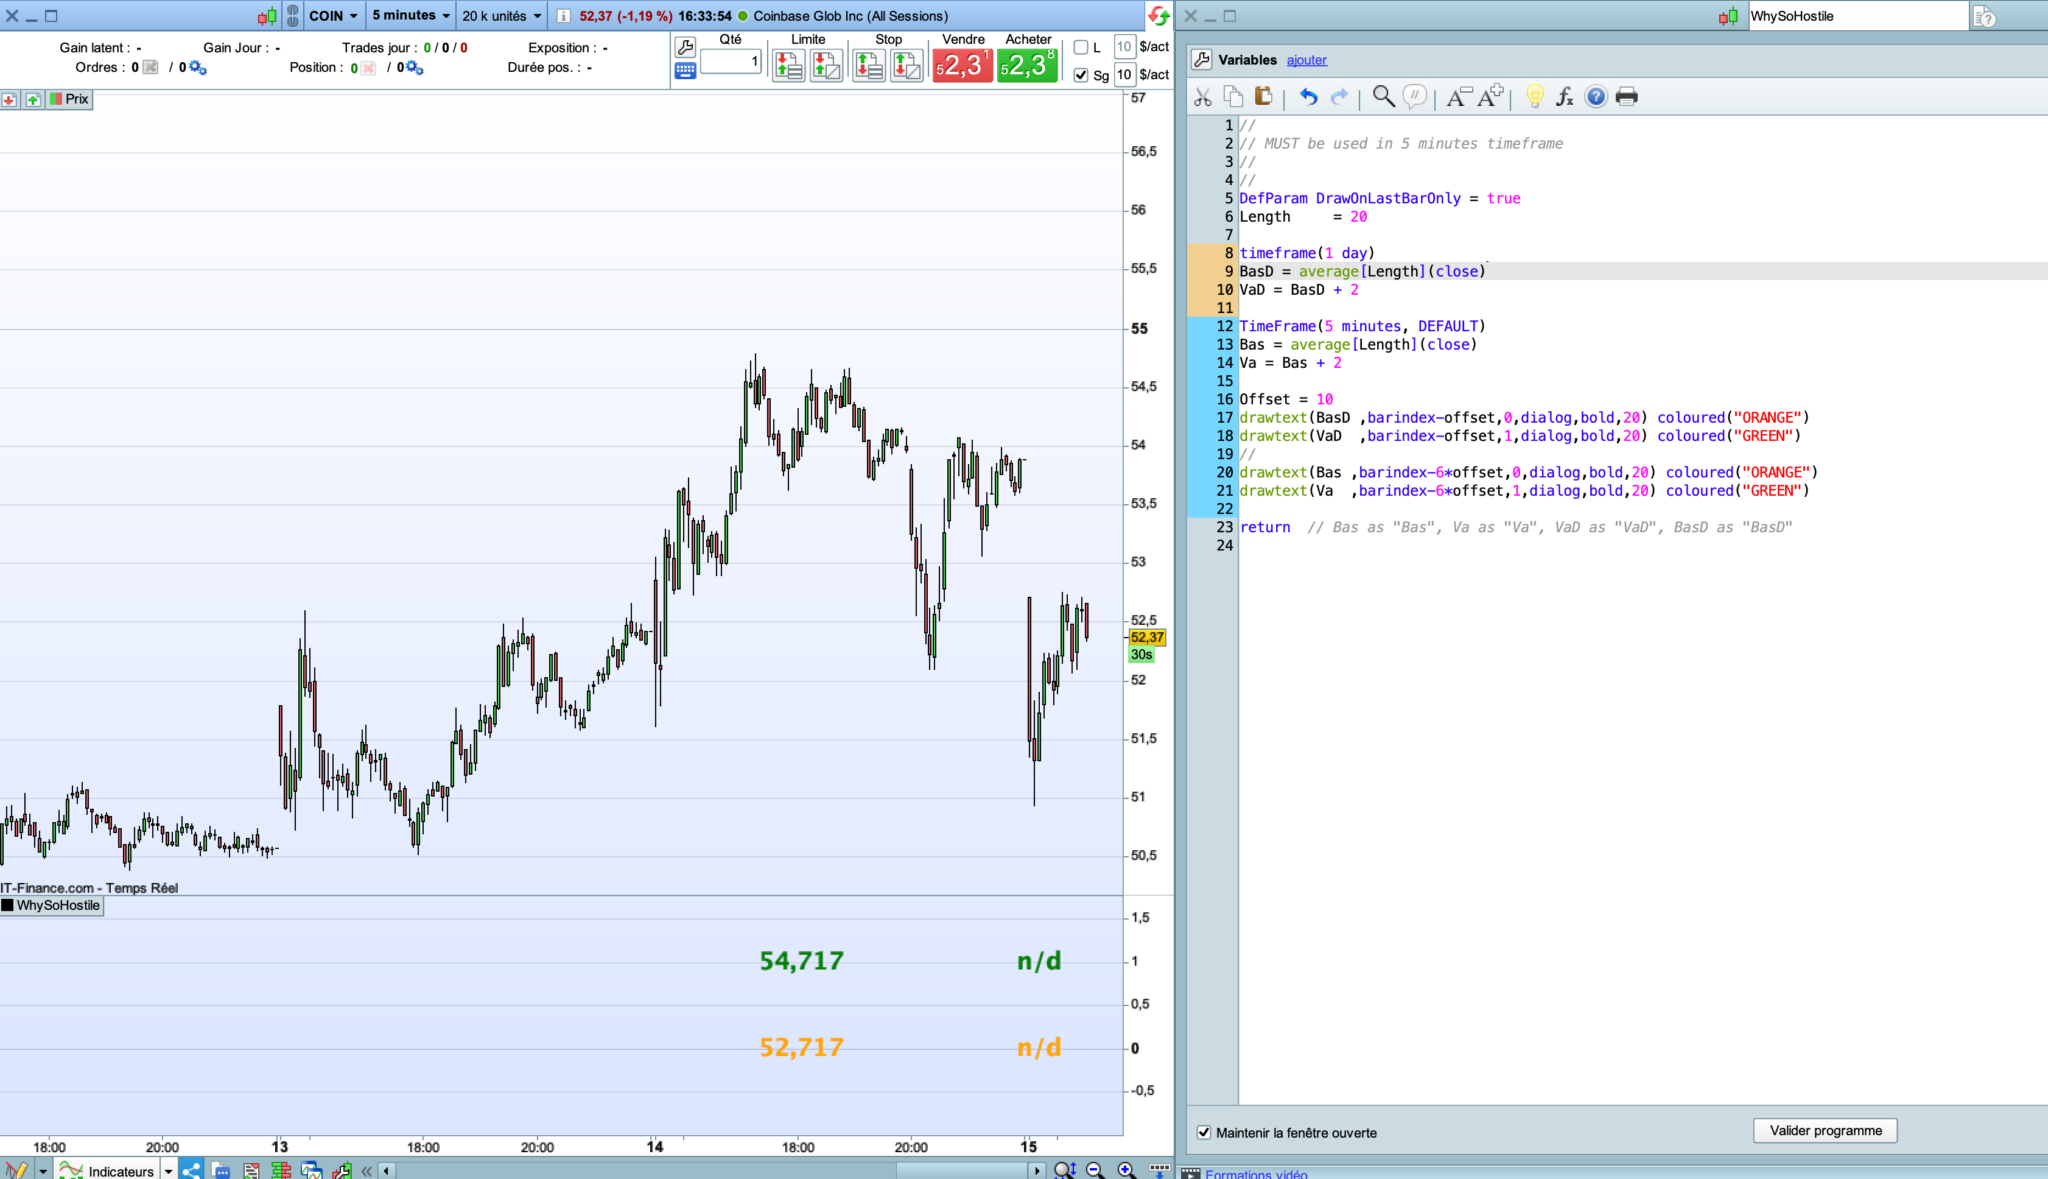
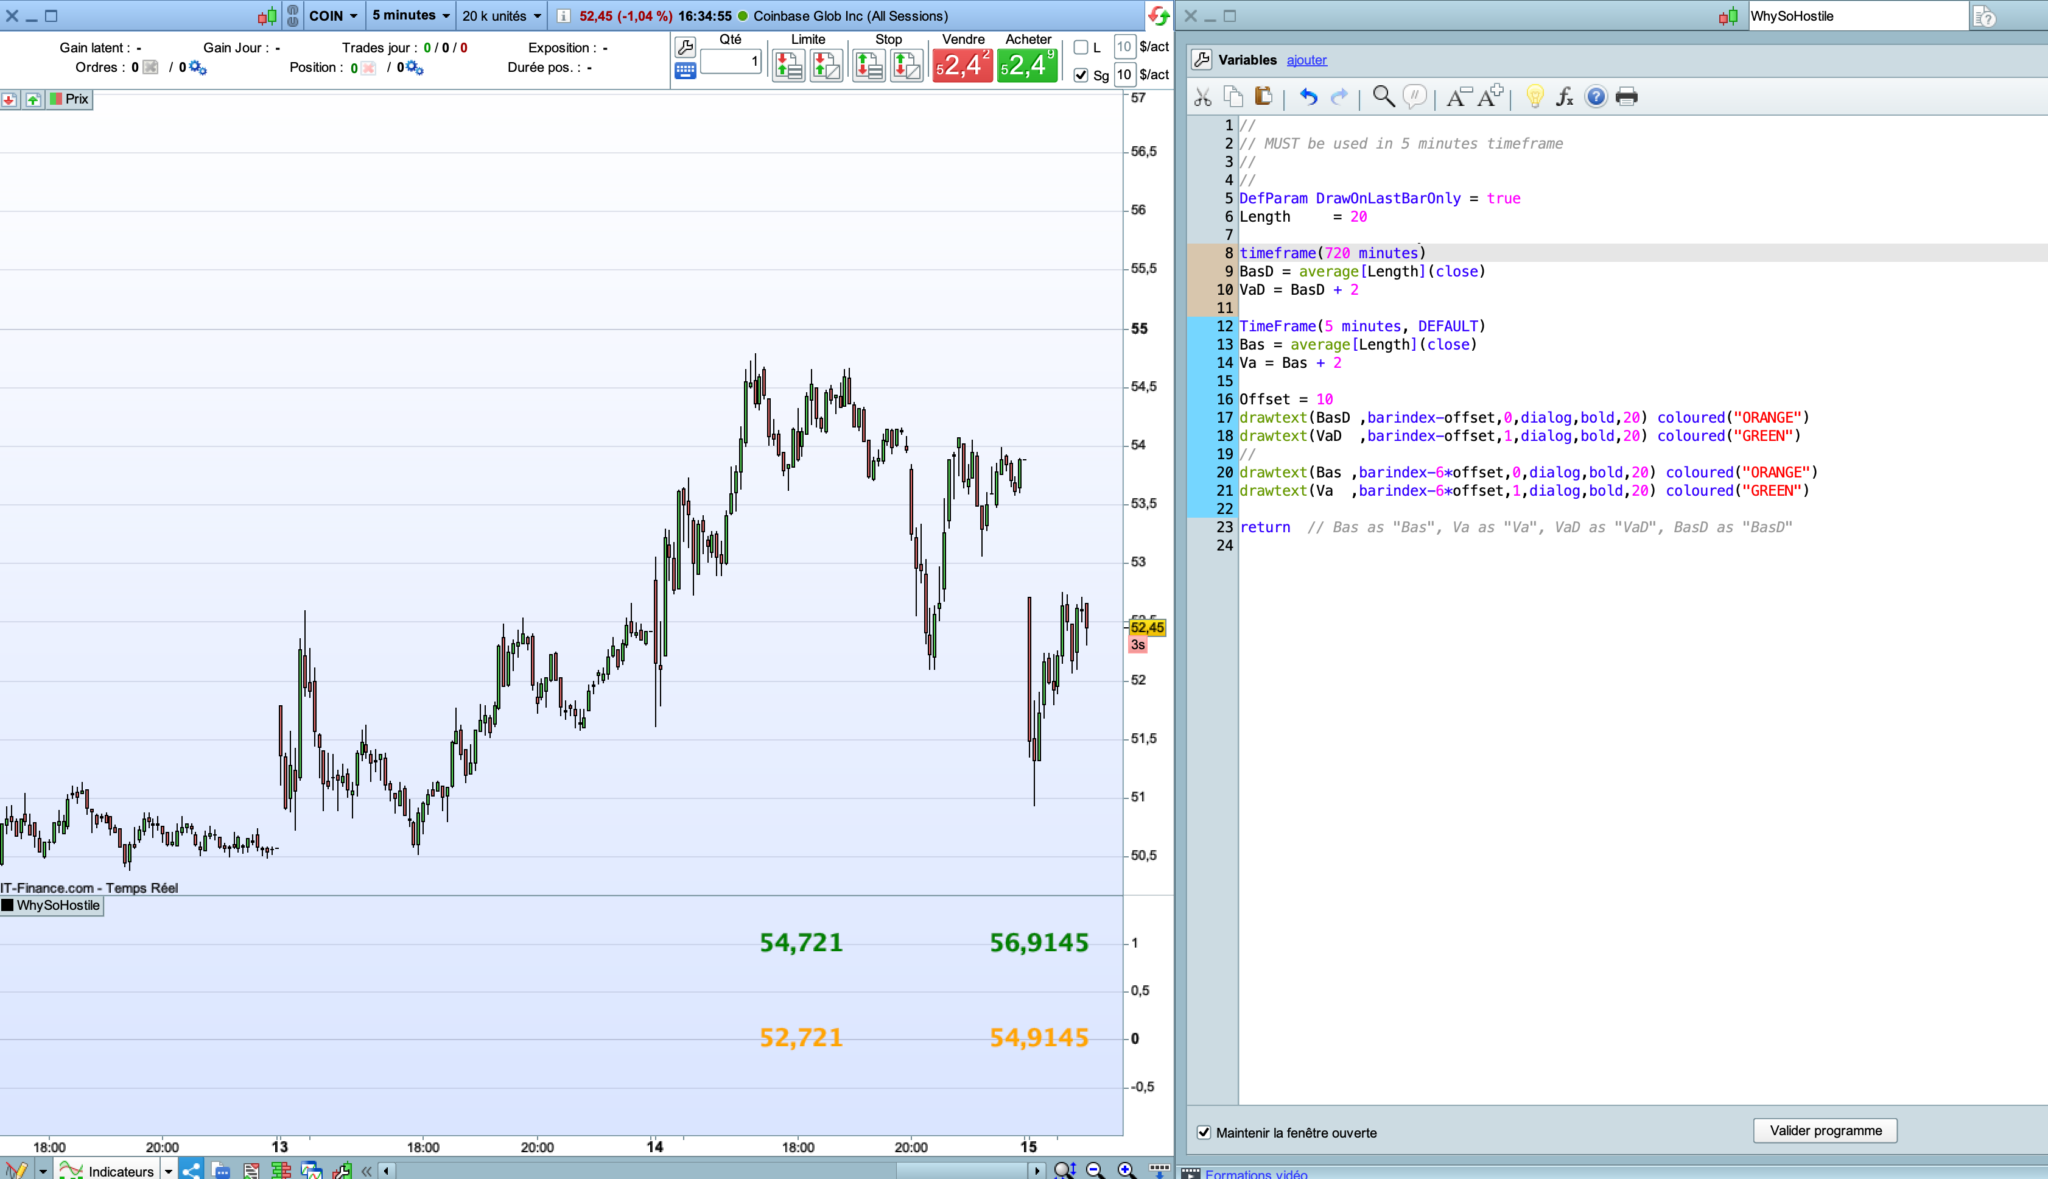
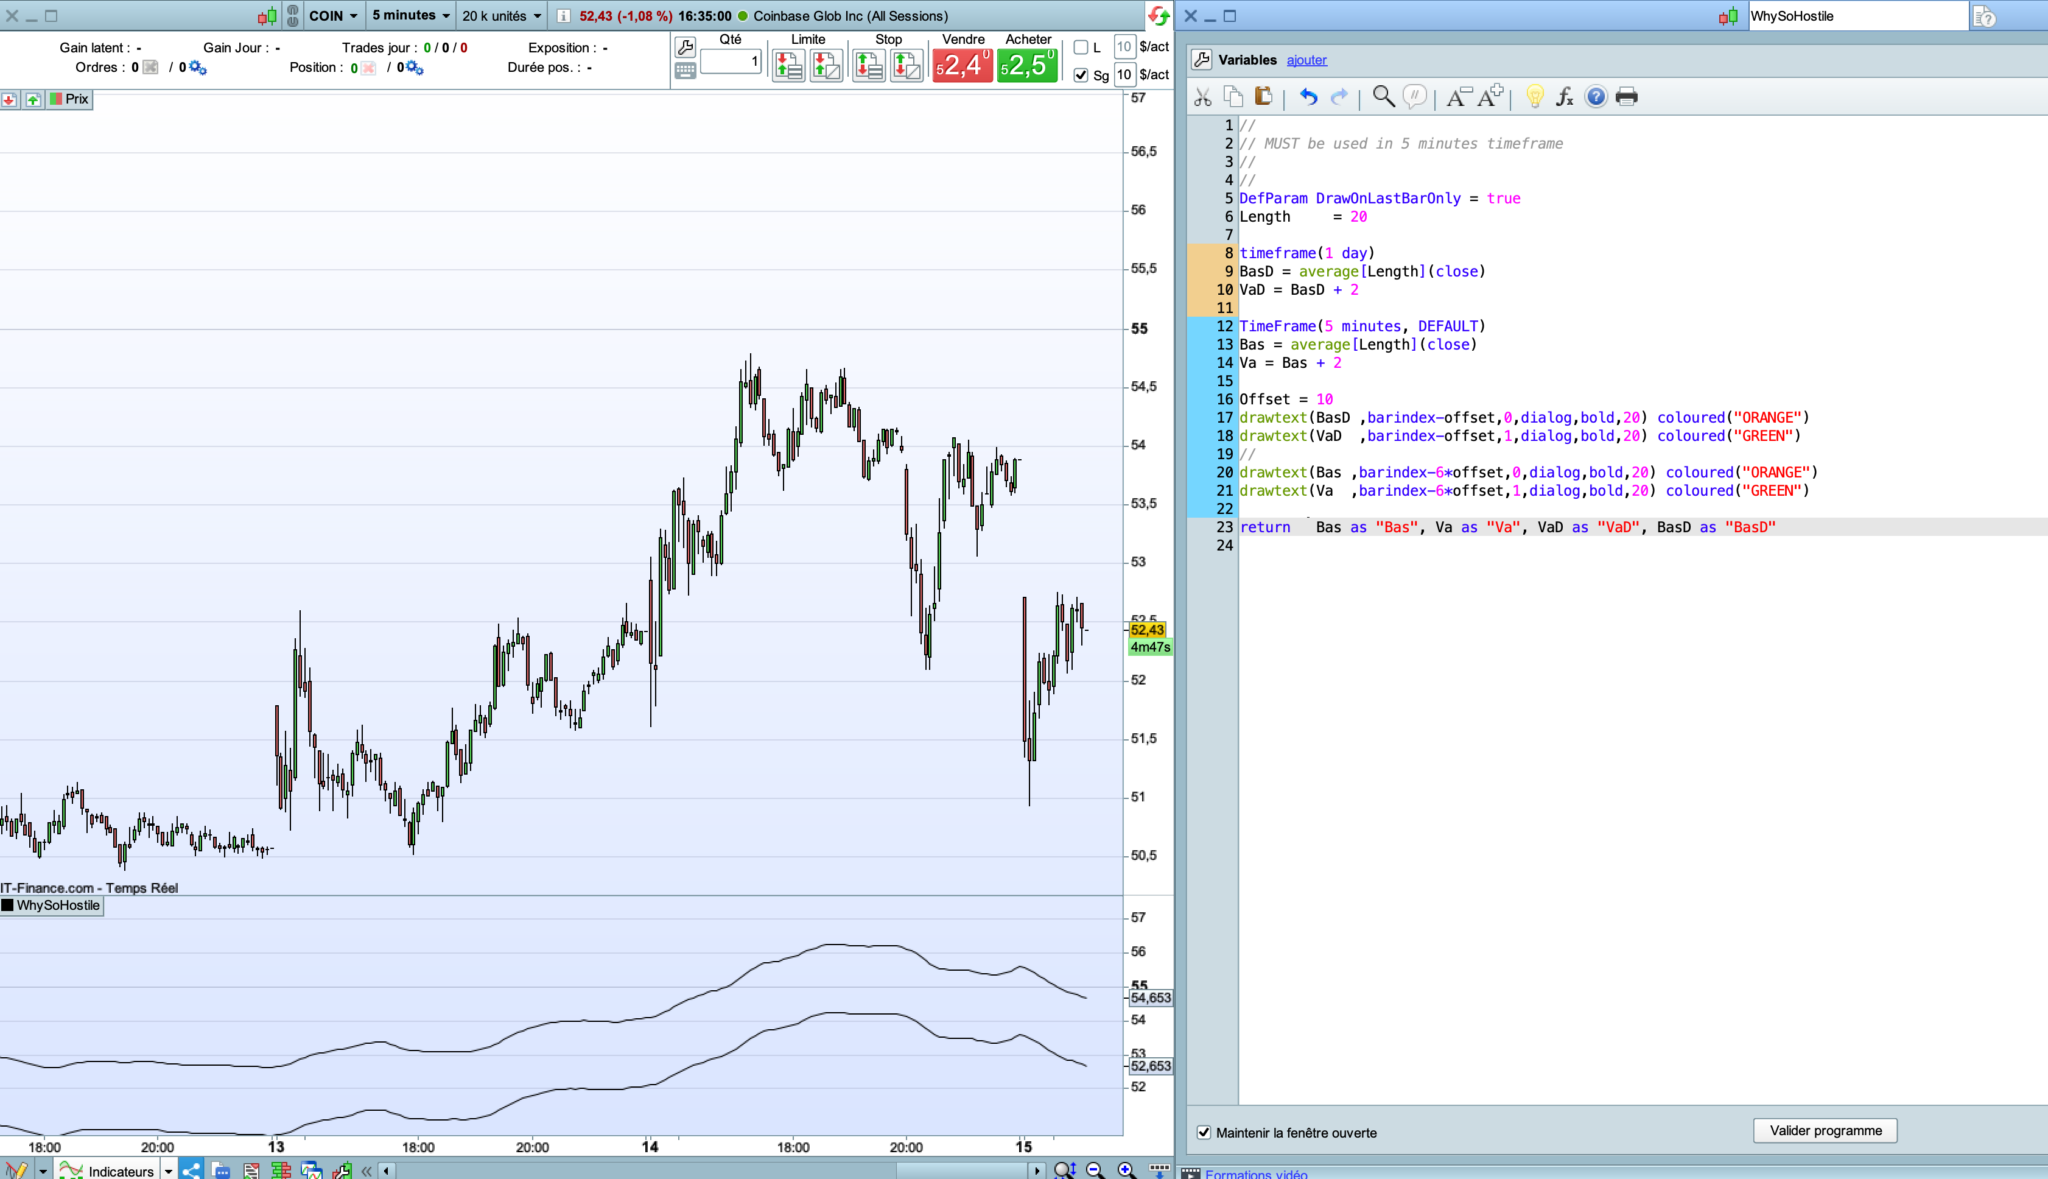
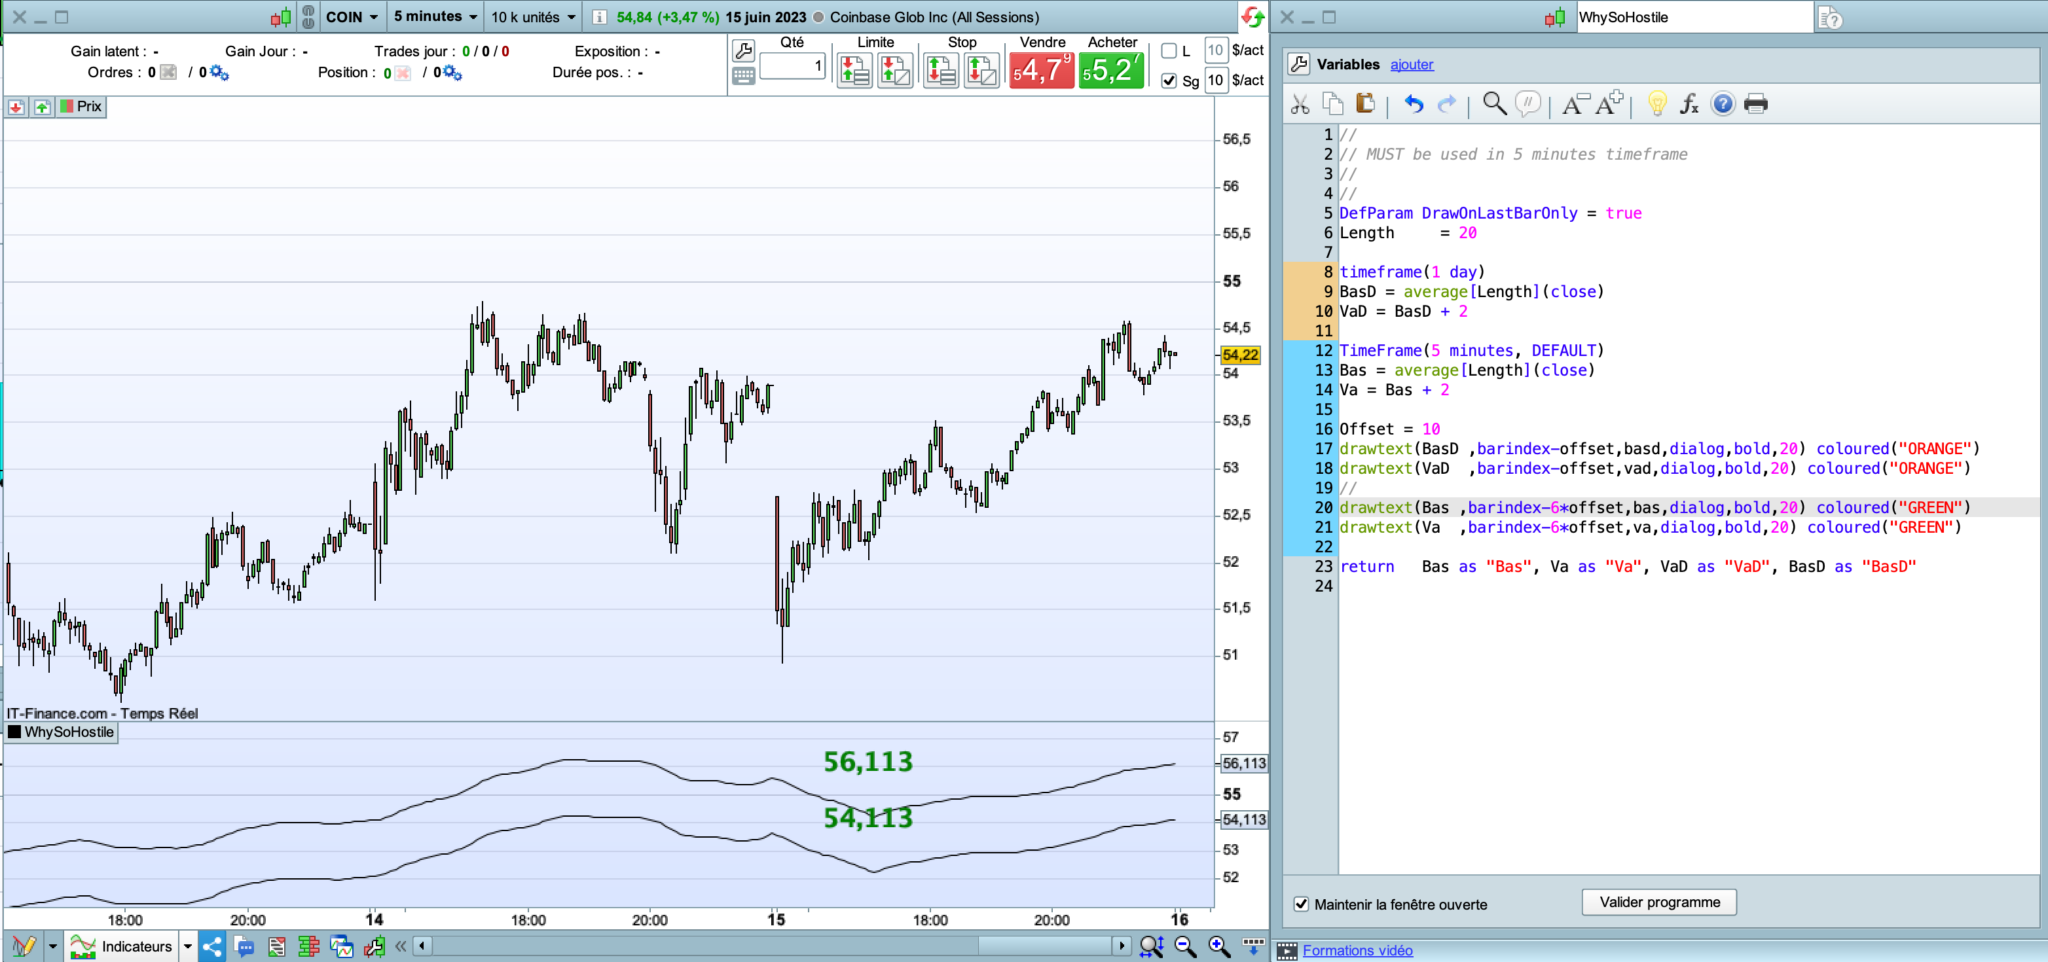
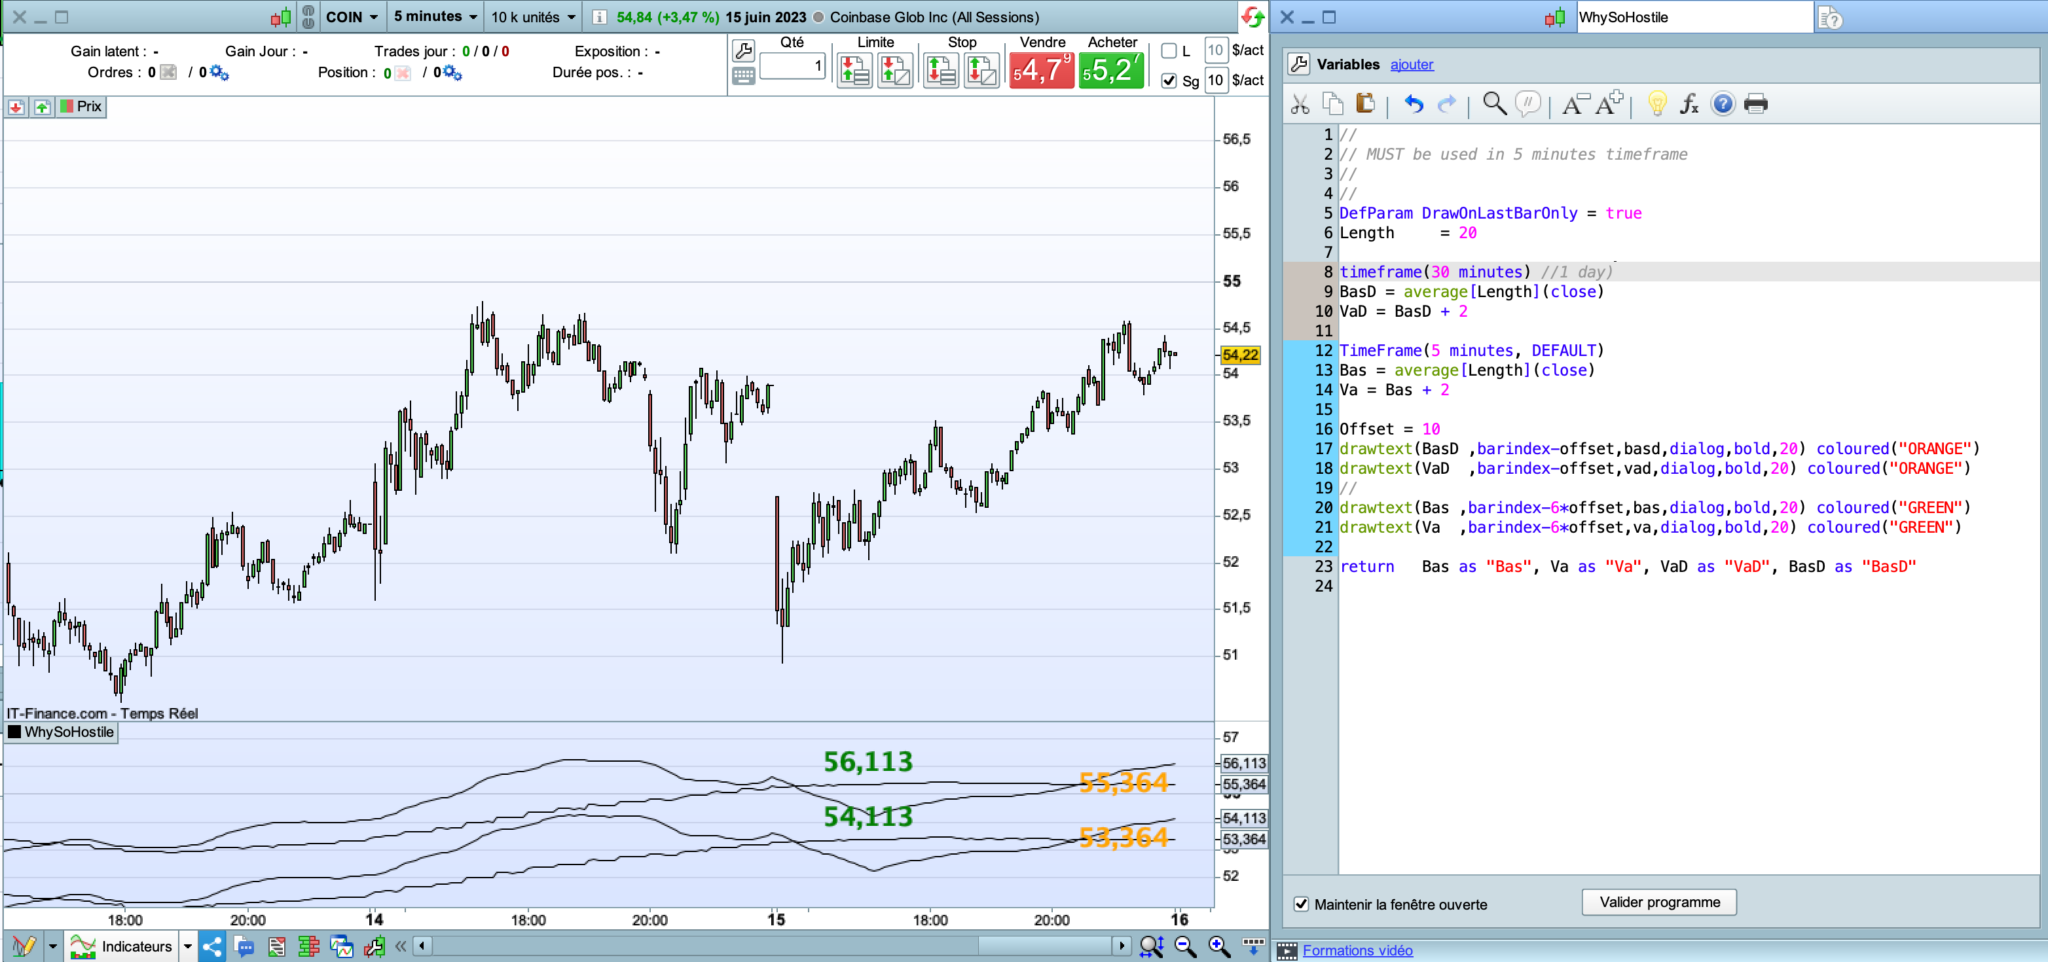
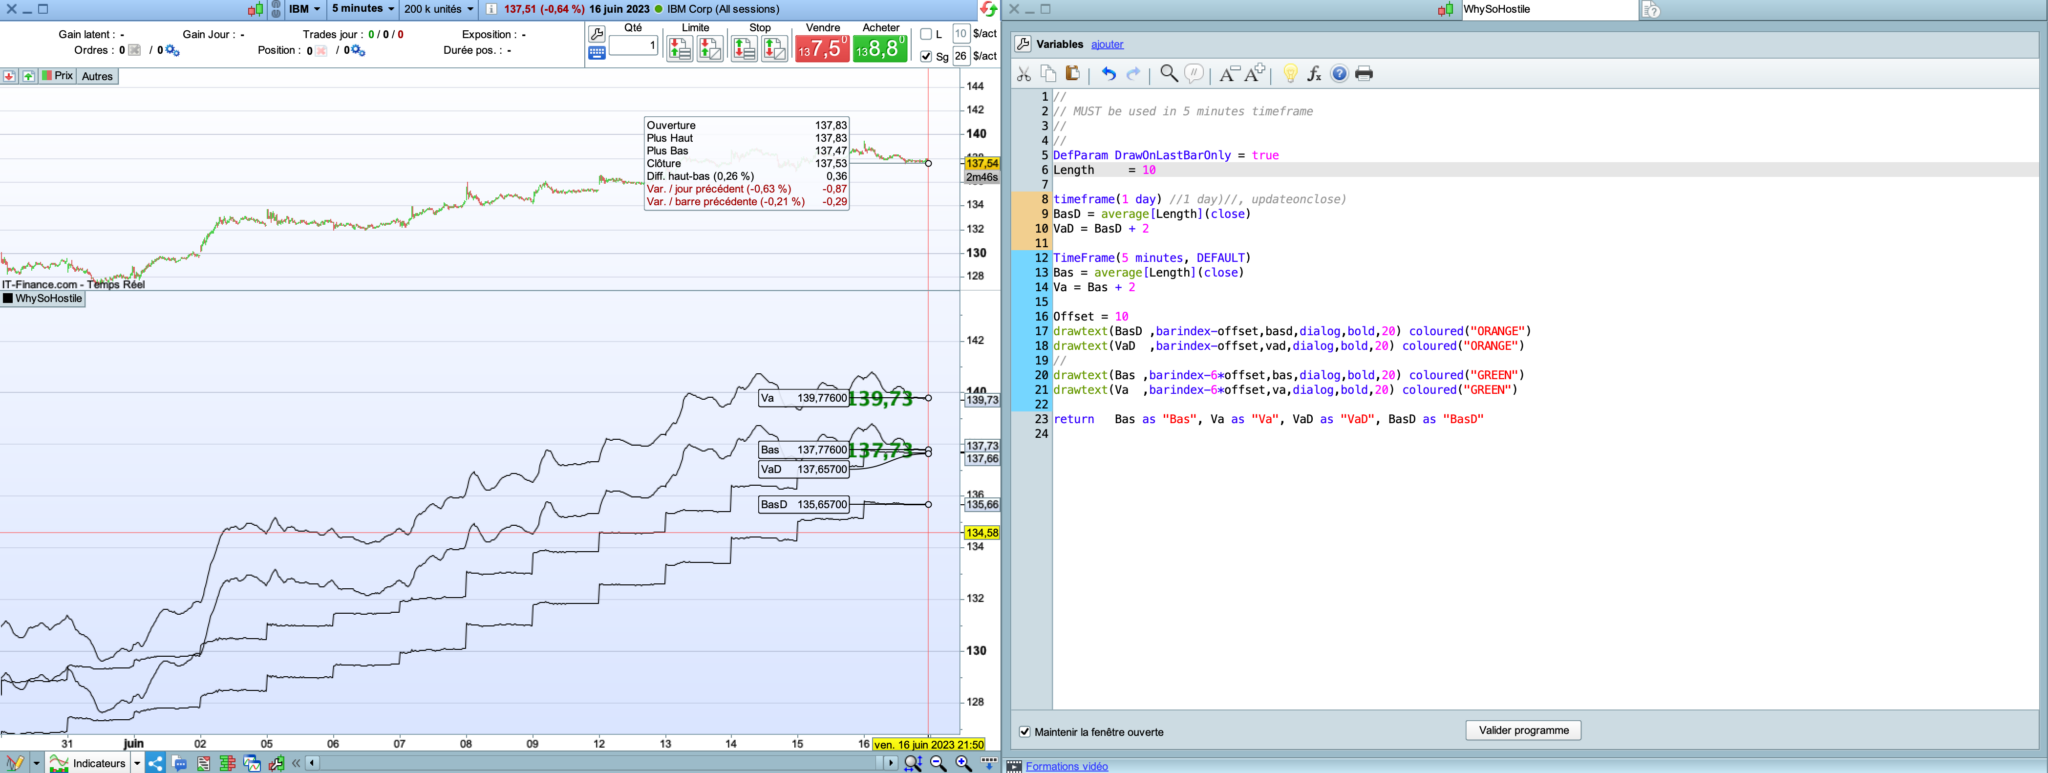
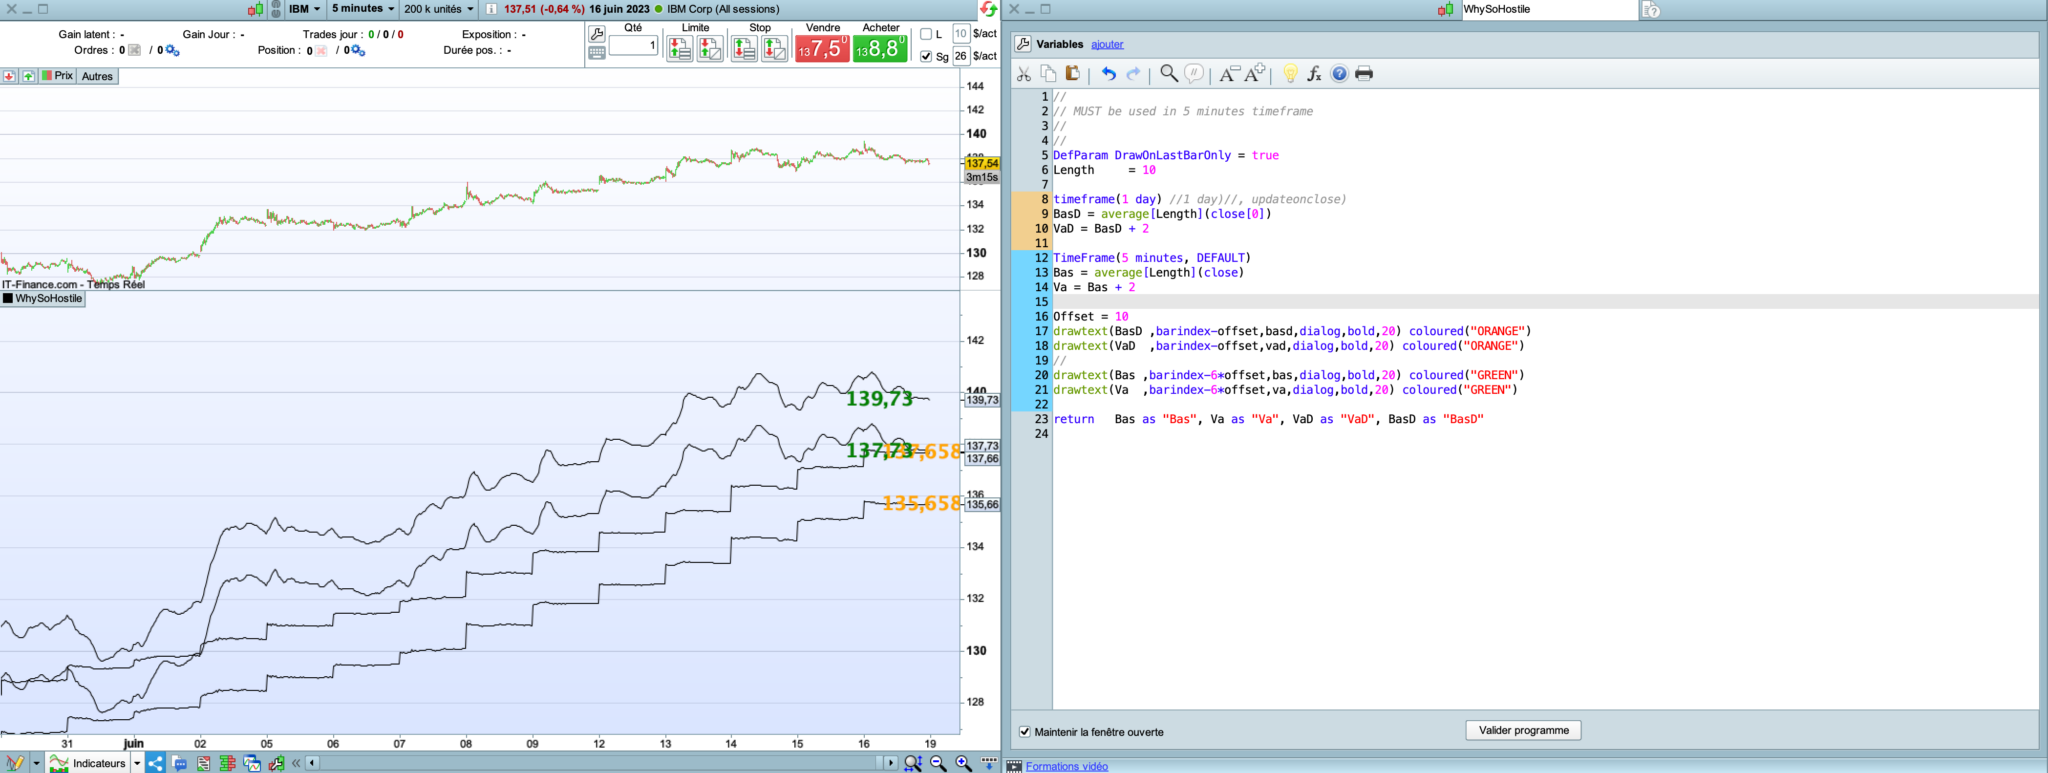
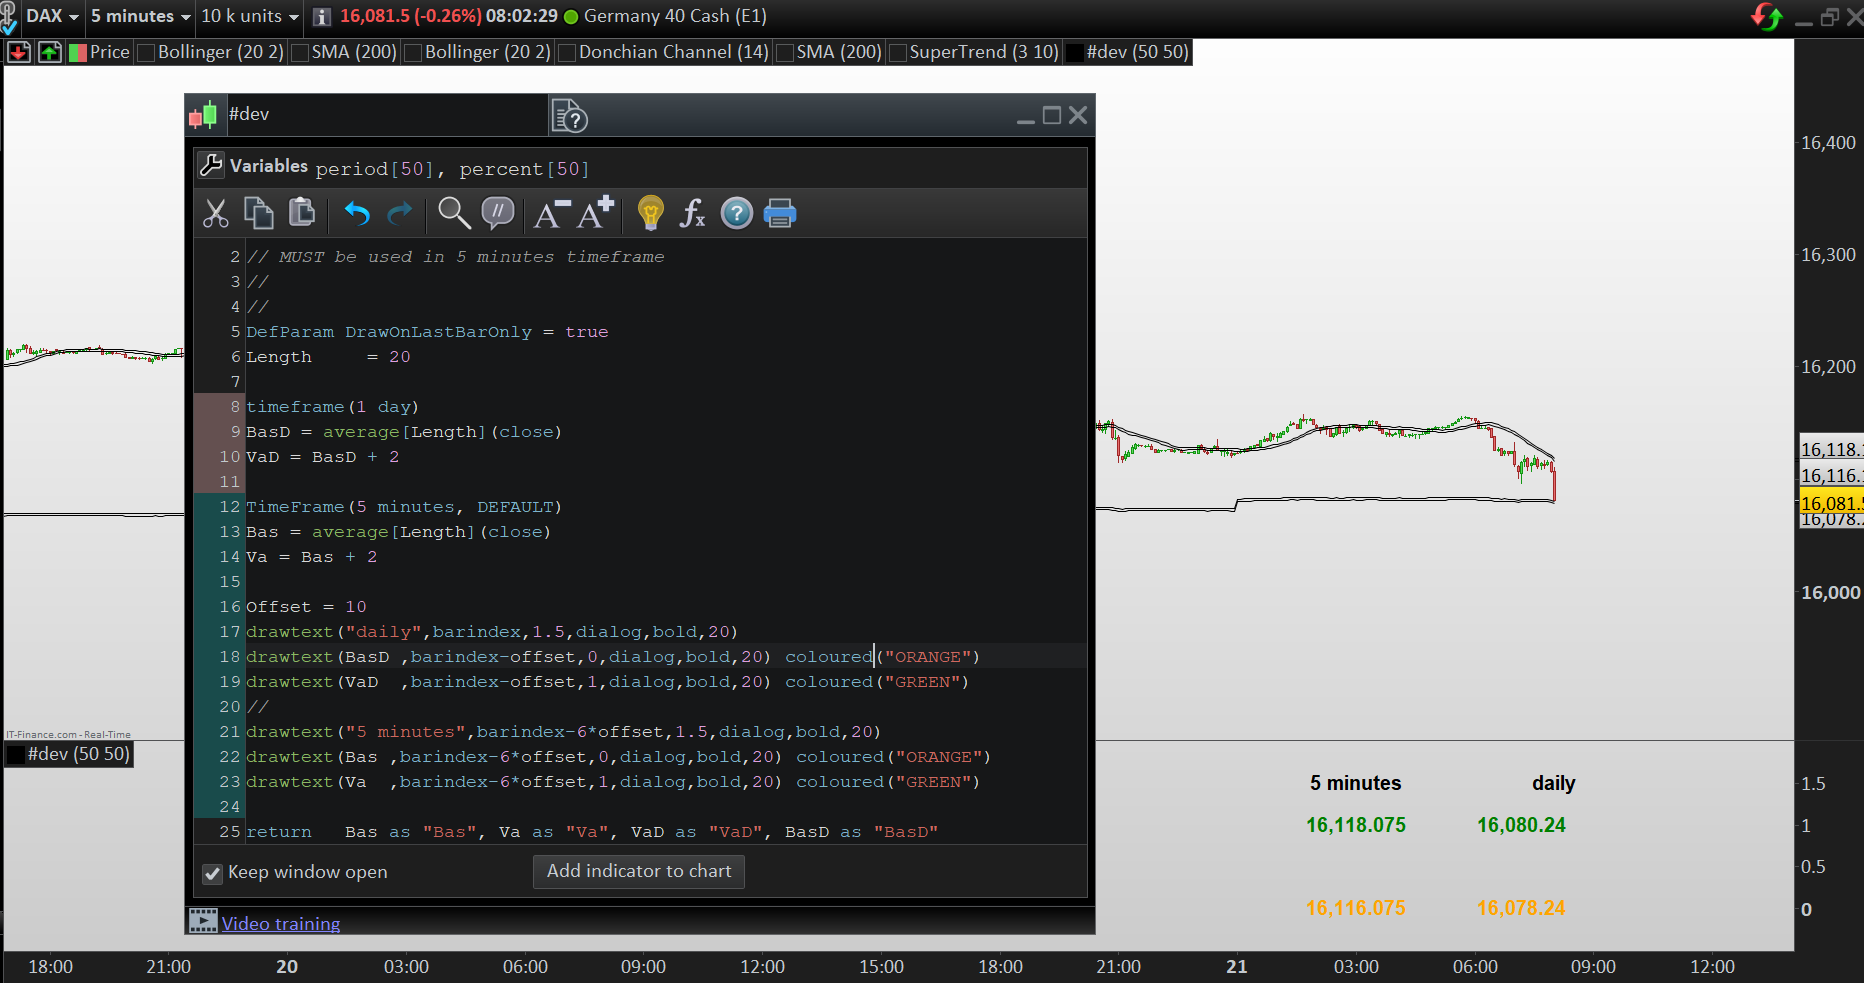
Merci pour ces investigations mais je crois tout de même qu’il y a un problème. Je dis cela bien que je n’aime pas mettre la faute sur les autres, dans ce cas PRT.
A moins naturellement que j’ai loupé un truc! Dans ce cas un ENORME MEA CULPA.
Voilà un exemple plus détaillé.
L’indicateur MTF
//
// MUST be used in 5 minutes timeframe
//
//
DefParam DrawOnLastBarOnly = true
Length = 20
//*******************************
timeframe(1 Month)
trueRangeM = MAX(High[0] - Low[0], max(High[0] - close[1], close[1] - Low[0]))
devKCM = average[length](trueRangeM[0])
//*******************************
timeframe(1 week)
trueRangeW = MAX(High[0] - Low[0], max(High[0] - close[1], close[1] - Low[0]))
devKCW = average[length](trueRangeW[0])
//*******************************
timeframe(1 day)
trueRangeD = MAX(High[0] - Low[0], max(High[0] - close[1], close[1] - Low[0]))
devKCD = average[length](trueRangeD[0])
//*******************************
timeframe(4 hours)
trueRange4H = MAX(High[0] - Low[0], max(High[0] - close[1], close[1] - Low[0]))
devKC4H = average[length](trueRange4H[0])
//*******************************
timeframe(60 Minutes)
trueRange1H = MAX(High[0] - Low[0], max(High[0] - close[1], close[1] - Low[0]))
devKC1H = average[length](trueRange1H[0])
//*******************************
timeframe(30 Minutes)
trueRange30M = MAX(High[0] - Low[0], max(High[0] - close[1], close[1] - Low[0]))
devKC30M = average[length](trueRange30M[0])
//*******************************
timeframe(15 Minutes)
trueRange15M = MAX(High[0] - Low[0], max(High[0] - close[1], close[1] - Low[0]))
devKC15M = average[length](trueRange15M[0])
//*******************************
TimeFrame(5 minutes, DEFAULT)
trueRange5M = MAX(High[0] - Low[0], max(High[0] - close[1], close[1] - Low[0]))
devKC5M = average[length](trueRange5M[0])
//*******************************
// Drawing
//*******************************
Offset = 10
// MONTHLY *******************************
drawtext(devKCM,barindex-offset,-0.5,dialog,bold,20) coloured("ORANGE")
// WEEKLY
drawtext(devKCW,barindex-2*offset,-0.5,dialog,bold,20) coloured("ORANGE")
// Daily
drawtext(devKCD,barindex-3*offset,-0.5,dialog,bold,20) coloured("ORANGE")
// 4H
drawtext(devKC4H,barindex-4*offset,-0.5,dialog,bold,20) coloured("ORANGE")
// 1H
drawtext(devKC1H,barindex-5*offset,-0.5,dialog,bold,20) coloured("ORANGE")
// 30M
drawtext(devKC30M,barindex-6*offset,-0.5,dialog,bold,20) coloured("ORANGE")
// 15M
drawtext(devKC15M,barindex-7*offset,-0.5,dialog,bold,20) coloured("ORANGE")
// 5M
drawtext(devKC5M,barindex-8*offset,-0.5,dialog,bold,20) coloured("ORANGE")
return
L’indicateur simple pour chacun des Timeframes
DefParam DrawOnLastBarOnly = true
Length = 20
//*******************************
trueRange = MAX(High[0] - Low[0], max(High[0] - close[1], close[1] - Low[0]))
devKC = average[length](trueRange[0])
//*******************************
// Drawing
//*******************************
Offset = 10
drawtext(devKC,barindex-offset,-0.5,dialog,bold,20) coloured("ORANGE")
return
Voilà ce que cela donne sur un écran. Certaines valeurs sur les unités courtes fonctionnent mais il y a des soucis sur les Timeframe plus grand.
J’adorerai avoir tord mais surtout comprendre.
Quelqu’un pourrait-il me mettre sur la voie?