Divergences SMI and CCI

Viewing 9 posts - 1 through 9 (of 9 total)
  • Author
    Posts
  • #116463 quote
    Zigo
    Participant
    Master

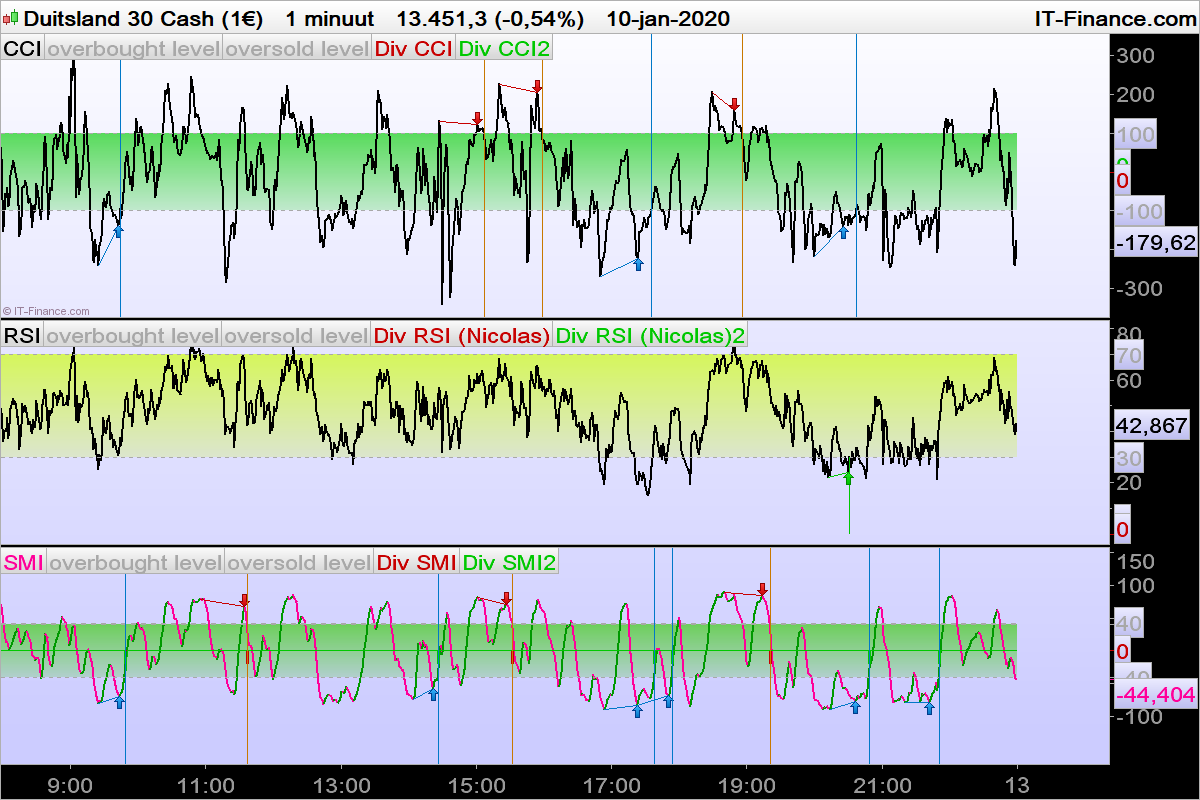
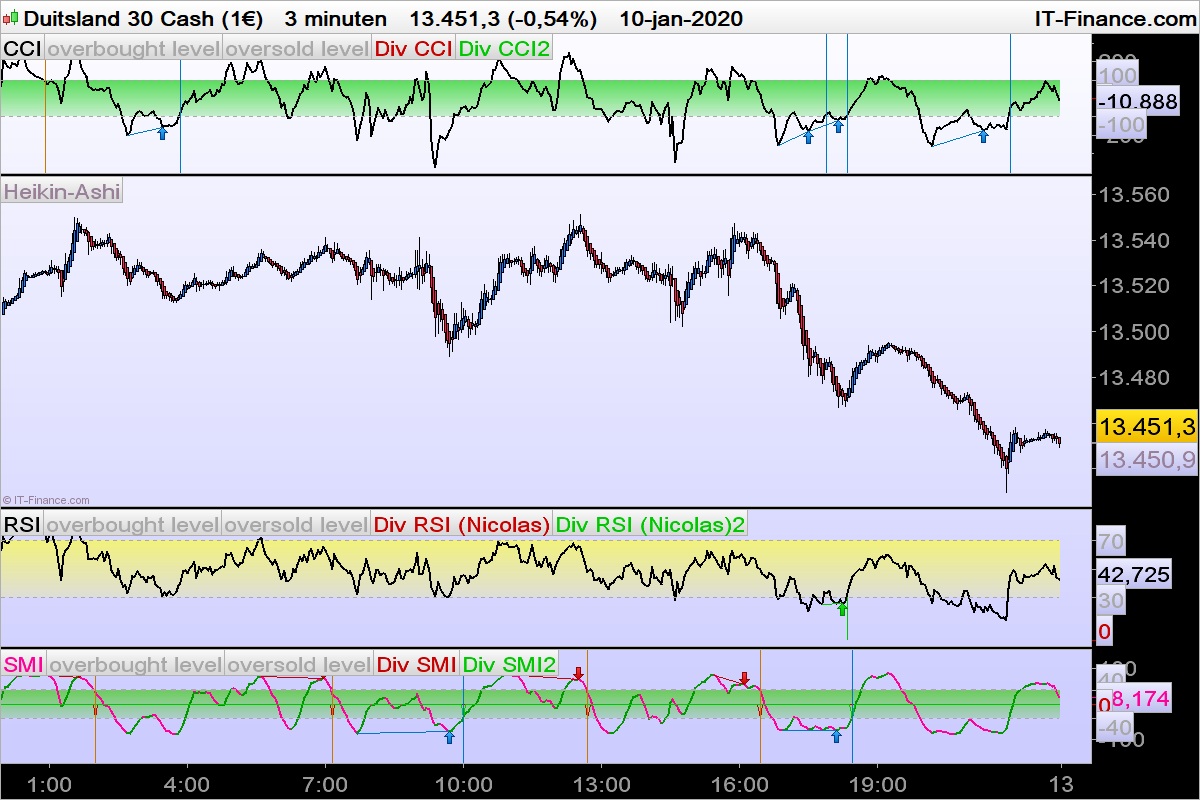
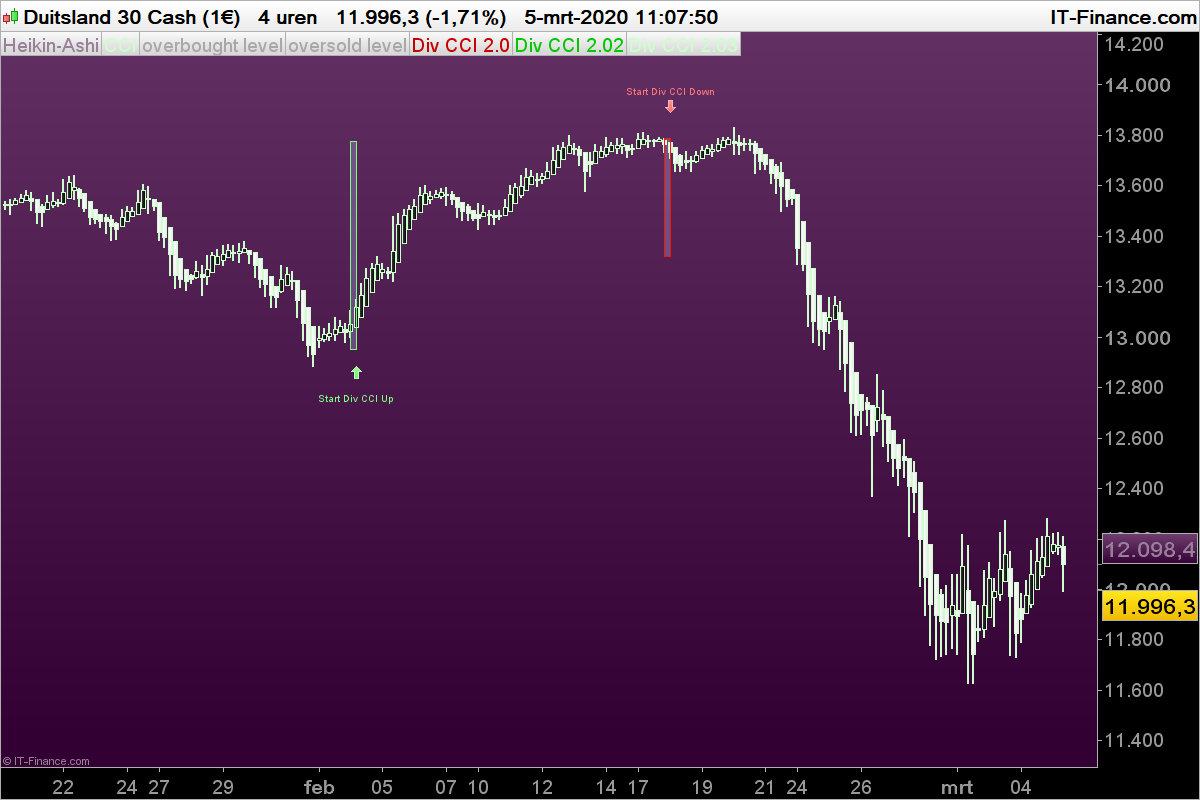
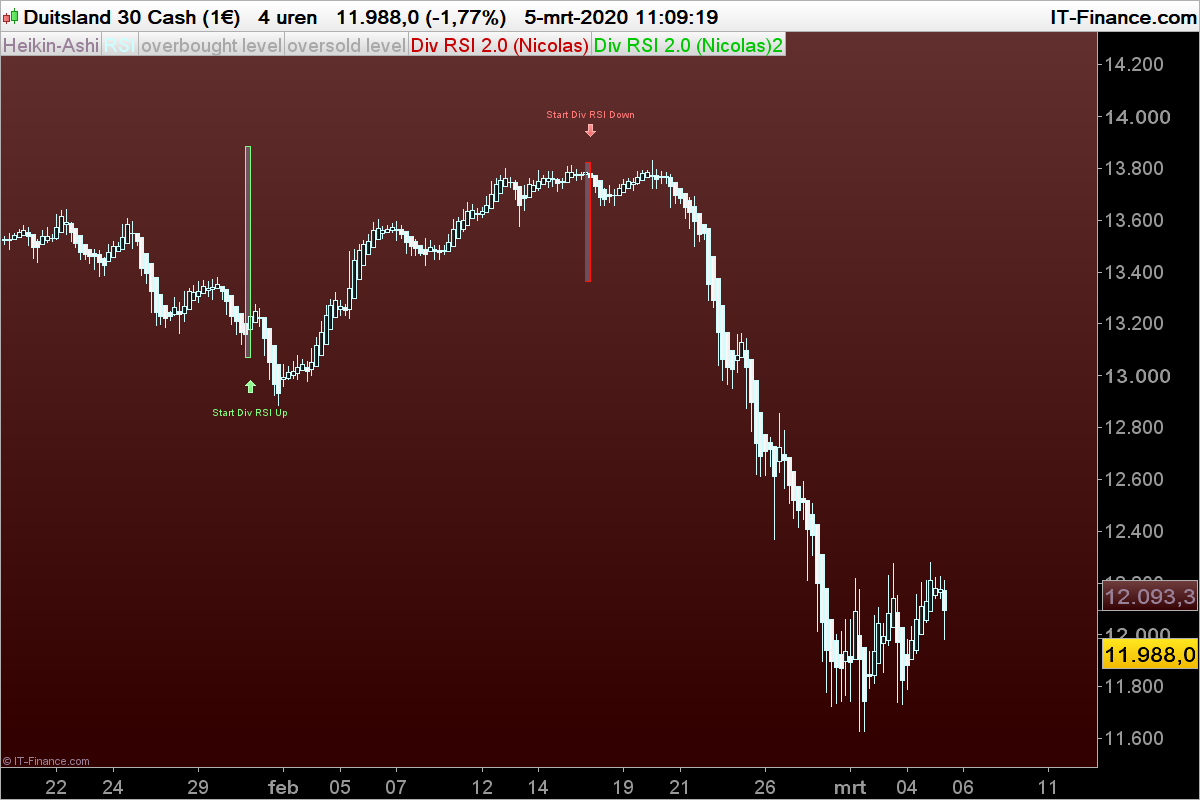
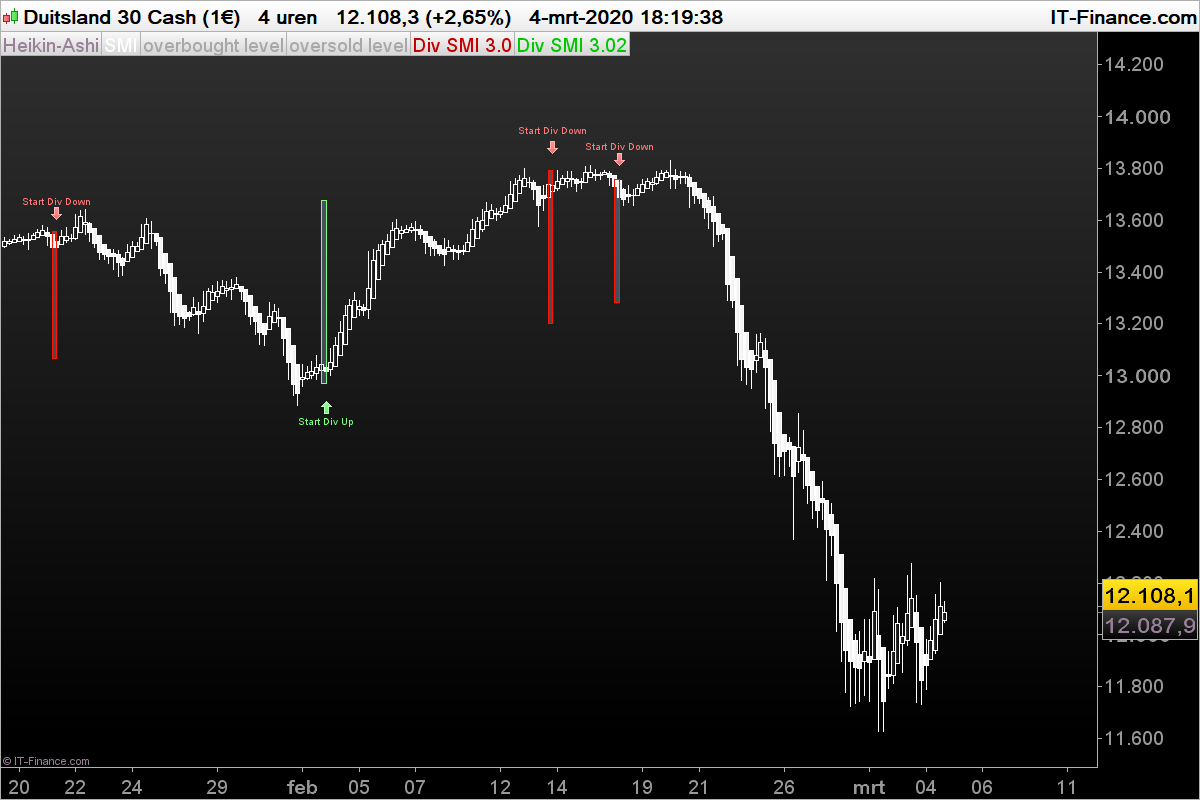
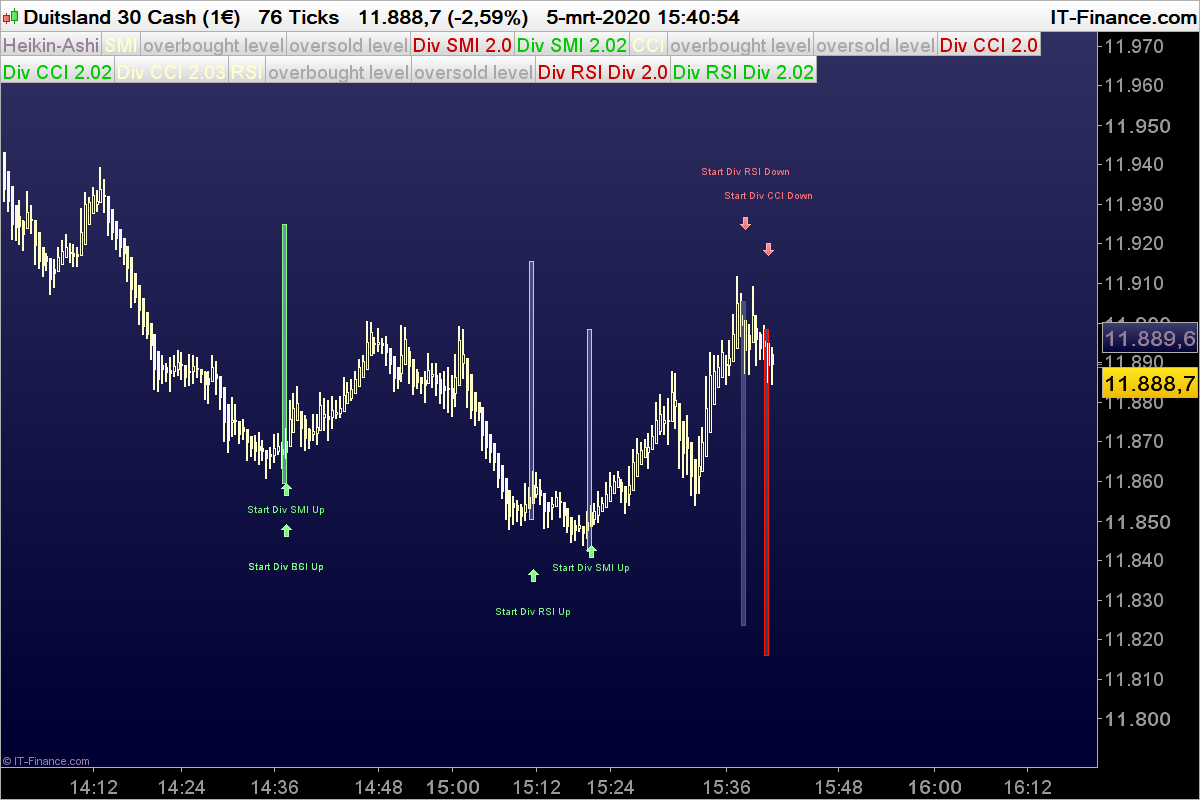
    I was inspired by the “Another RSI Divergence Indicator by Nicolas. The same idee has applied to the SMI and to the CCI indicators.

    OverboughtLevel are not 70 and 30 RSI but 40 and -40 for SMI and 100 and -100 for CCI.
    And as you can see the RSI is replaced by the SMI and the CCI respectively.


    // Settings for SMI Divergence
    
    obLevel=40 //overbought level
    osLevel=-40 //oversold level
    minimalBars=5 //minimal count of bars where CCI is ob or os
    // End of settings
     
    iSMi =SMI[14,3,5](close)
    ob = iSMi>obLevel
    os = iSMi<osLevel
     
    if ob then
    if not ob[1] then
    maxSMi = 0
    maxprice = 0
    firstobbar = barindex
    endif
    maxSMi=max(maxSMi,ISMI)
    maxprice=max(maxprice,high)
    if maxSMi<>maxSMi[1] then
    maxSMibar=barindex
    endif
    endif
     
    if os then
    if not os[1] then
    minSMi = 100
    minprice = close*100
    firstosbar = barindex
    endif
    minSMi=min(minSMi,ISMI)
    minprice=min(minprice,low)
    if minSMi<>minSMi[1] then
    minSMibar=barindex
    endif
    endif
    
    
    divsell=0
    if ISMI crosses under obLevel then
    //verif divergence
    div = maxprice>oldmaxprice and maxSMi<oldmaxSMi and (barindex-firstobbar)>=minimalBars
    if div then
    drawsegment(oldmaxSMibar,oldmaxSMi,maxSMibar,maxSMi) coloured(200,0,0)
    drawarrowdown(maxSMibar,maxSMi) coloured(200,0,0)
    DRAWVLINE(barindex)coloured(200,120,0,255)
    divsell=osLevel
    endif
    oldmaxSMi = maxSMi
    oldmaxprice = maxprice
    oldmaxSMibar = maxSMibar
    endif
     
    divbuy=0
    if iSMI crosses over osLevel then
    //verif divergence
    div = minprice<oldminprice and minSMi>oldminSMi and (barindex-firstosbar)>=minimalBars
    if div then
    drawsegment(oldminSMibar,oldminSMi,minSMibar,minSMi) coloured(0,120,200)
    drawarrowup(minSMibar,minSMi) coloured(0,120,200)
    DRAWVLINE(barindex)coloured(0,120,200,255)
    divbuy=osLevel
    endif
    oldminSMi = minSMi
    oldminprice = minprice
    oldminSMibar = minSMibar
    endif
    
    return iSMI style(line,2) as "SMI",obLevel coloured(168,168,168) style(dottedline,2) as "overbought level", osLevel coloured(168,168,168) style(dottedline,1) as "oversold level", divsell coloured(200,0,0), divbuy coloured(0,200,0)
    // Settings for CCI Divergence
    
    obLevel=40 //overbought level
    osLevel=-40 //oversold level
    minimalBars=5 //minimal count of bars where CCI is ob or os
    // End of settings
     
    iSMi =SMI[14,3,5](close)
    ob = iSMi>obLevel
    os = iSMi<osLevel
     
    if ob then
    if not ob[1] then
    maxSMi = 0
    maxprice = 0
    firstobbar = barindex
    endif
    maxSMi=max(maxSMi,ISMI)
    maxprice=max(maxprice,high)
    if maxSMi<>maxSMi[1] then
    maxSMibar=barindex
    endif
    endif
     
    if os then
    if not os[1] then
    minSMi = 100
    minprice = close*100
    firstosbar = barindex
    endif
    minSMi=min(minSMi,ISMI)
    minprice=min(minprice,low)
    if minSMi<>minSMi[1] then
    minSMibar=barindex
    endif
    endif
    
    
    divsell=0
    if ISMI crosses under obLevel then
    //verif divergence
    div = maxprice>oldmaxprice and maxSMi<oldmaxSMi and (barindex-firstobbar)>=minimalBars
    if div then
    drawsegment(oldmaxSMibar,oldmaxSMi,maxSMibar,maxSMi) coloured(200,0,0)
    drawarrowdown(maxSMibar,maxSMi) coloured(200,0,0)
    DRAWVLINE(barindex)coloured(200,120,0,255)
    divsell=osLevel
    endif
    oldmaxSMi = maxSMi
    oldmaxprice = maxprice
    oldmaxSMibar = maxSMibar
    endif
     
    divbuy=0
    if iSMI crosses over osLevel then
    //verif divergence
    div = minprice<oldminprice and minSMi>oldminSMi and (barindex-firstosbar)>=minimalBars
    if div then
    drawsegment(oldminSMibar,oldminSMi,minSMibar,minSMi) coloured(0,120,200)
    drawarrowup(minSMibar,minSMi) coloured(0,120,200)
    DRAWVLINE(barindex)coloured(0,120,200,255)
    divbuy=osLevel
    endif
    oldminSMi = minSMi
    oldminprice = minprice
    oldminSMibar = minSMibar
    endif
    
    return iSMI style(line,2) as "SMI",obLevel coloured(168,168,168) style(dottedline,2) as "overbought level", osLevel coloured(168,168,168) style(dottedline,1) as "oversold level", divsell coloured(200,0,0), divbuy coloured(0,200,0)
    Lighthouse and Nicolas thanked this post
    DAX-1-minuutDiv.png DAX-1-minuutDiv.png
    #116465 quote
    Zigo
    Participant
    Master

    I have seen that SMI is posted Twice(Sorry)

    #116497 quote
    Zigo
    Participant
    Master

    The code for the CCI Divergence is missing in my earlier posts, therfore I try again:

    // Settings for CCI Divergence
    CCIp=28 //CCI period
    obLevel=100 //overbought level
    osLevel=-100 //oversold level
    minimalBars=5 //minimal count of bars where CCI is ob or os
    // End of settings
     
    icci = cci[ccIp]
    ob = icci>obLevel
    os = icci<osLevel
     
    if ob then
    if not ob[1] then
    maxcci = 0
    maxprice = 0
    firstobbar = barindex
    endif
    maxcci=max(maxcci,icci)
    maxprice=max(maxprice,high)
    if maxcci<>maxcci[1] then
    maxccibar=barindex
    endif
    endif
     
    if os then
    if not os[1] then
    mincci = 100
    minprice = close*100
    firstosbar = barindex
    endif
    mincci=min(mincci,icci)
    minprice=min(minprice,low)
    if mincci<>mincci[1] then
    minccibar=barindex
    endif
    endif
     
    divsell=0
    if icci crosses under obLevel then
    //verif divergence
    div = maxprice>oldmaxprice and maxcci<oldmaxcci and (barindex-firstobbar)>=minimalBars
    if div then
    drawsegment(oldmaxccibar,oldmaxcci,maxccibar,maxcci) coloured(200,0,0)
    drawarrowdown(maxccibar,maxcci) coloured(200,0,0)
    DRAWVLINE(barindex)coloured(200,120,0,255)
    divsell=osLevel
    endif
    oldmaxcci = maxcci
    oldmaxprice = maxprice
    oldmaxccibar = maxccibar
    endif
     
    divbuy=0
    if icci crosses over osLevel then
    //verif divergence
    div = minprice<oldminprice and mincci>oldmincci and (barindex-firstosbar)>=minimalBars
    if div then
    drawsegment(oldminccibar,oldmincci,minccibar,mincci) coloured(0,120,200)
    drawarrowup(minccibar,mincci) coloured(0,120,200)
    DRAWVLINE(barindex)coloured(0,120,200,255)
    divbuy=osLevel
    endif
    oldmincci = mincci
    oldminprice = minprice
    oldminccibar = minccibar
    endif
    
    return icci style(line,2) as "CCI",obLevel coloured(168,168,168) style(dottedline,1) as "overbought level", osLevel coloured(168,168,168) style(dottedline,1) as "oversold level", divsell coloured(200,0,0), divbuy coloured(0,200,0)
    Lighthouse thanked this post
    #116501 quote
    Zigo
    Participant
    Master

    The difference in divergence is shown in a 3 min picture of the dax (last trading day)

    DAX-3-minuten.png DAX-3-minuten.png
    #116613 quote
    Nicolas
    Keymaster
    Master

    Thanks a lot @Zigo for giving back to the community! I appreciate a lot.

    Seems that confluent divergences of the indicators gave accurate signals in this case.

    #121259 quote
    Zigo
    Participant
    Master

    The oblevel (50)and the oslevel(-50) for CCI in a 4h graphic give good results

    The oblevel (60) and oslevel(40) for RSI in a 4h graphic

    The Oblevel (40) and Oslevel(-40) for SMI in a 4h graphic.

    Thes levels are comparable to each other. The code changes are below for the CCI and similar for RSI and SMI.

    DRAWRECTANGLE(barindex, High+8*AverageTrueRange[14](close), barindex[1], low[1]-0.618*AverageTrueRange[14](close))coloured(125,255,125,255)
    DRAWTEXT("Start Div CCI Up", barindex, Low-4.23*AverageTrueRange[14](close))coloured(125,255,125,255)
    DRAWARROWUP(barindex, low-2.618*AverageTrueRange[14](close))coloured(125,255,125,255)
    Al thanked this post
    CCI-Div2.0.png CCI-Div2.0.png RSI-Div-2.0.png RSI-Div-2.0.png SMI-Div2.0.png SMI-Div2.0.png
    #121263 quote
    Zigo
    Participant
    Master

    The complete code for Div.CCI 2.0:


    // Settings for CCI Divergence
    CCIp=29 //CCI period
    obLevel=50 //overbought level
    osLevel=-50 //oversold level
    minimalBars=10 //minimal count of bars where CCI is ob or os
    // End of settings
     
    icci = cci[ccIp]
    ob = icci>obLevel
    os = icci<osLevel
     
    if ob then
    if not ob[1] then
    maxcci = 0
    maxprice = 0
    firstobbar = barindex
    endif
    maxcci=max(maxcci,icci)
    maxprice=max(maxprice,high)
    if maxcci<>maxcci[1] then
    maxccibar=barindex
    endif
    endif
     
    if os then
    if not os[1] then
    mincci = 50
    minprice = close*50
    firstosbar = barindex
    endif
    mincci=min(mincci,icci)
    minprice=min(minprice,low)
    if mincci<>mincci[1] then
    minccibar=barindex
    endif
    endif
     
    divsell=0
    if icci crosses under obLevel then
    //verif divergence
    div = maxprice>oldmaxprice and maxcci<oldmaxcci and (barindex-firstobbar)>=minimalBars
    if div then
    drawsegment(oldmaxccibar,oldmaxcci,maxccibar,maxcci) coloured(200,0,0)
    drawarrowdown(maxccibar,maxcci) coloured(200,0,0)
    DRAWRECTANGLE(barindex, High+0.618*AverageTrueRange[14](close), barindex[1], low[1]-8*AverageTrueRange[14](close))coloured(255,20,0,255)
    DRAWTEXT("Start Div CCI Down", barindex, High+4.23*AverageTrueRange[14](close))coloured(255,120,120,255)
    DRAWARROWDOWN(barindex, high+2.618*AverageTrueRange[14](close))coloured(255,120,120,255)
    divsell=oslevel
    endif
    oldmaxcci = maxcci
    oldmaxprice = maxprice
    oldmaxccibar = maxccibar
    endif
     
    divbuy=0
    if icci crosses over osLevel then
    //verif divergence
    div = minprice<oldminprice and mincci>oldmincci and (barindex-firstosbar)>=minimalBars
    if div then
    drawsegment(oldminccibar,oldmincci,minccibar,mincci) coloured(0,120,200)
    drawarrowup(minccibar,mincci) coloured(0,120,200)
    DRAWRECTANGLE(barindex, High+8*AverageTrueRange[14](close), barindex[1], low[1]-0.618*AverageTrueRange[14](close))coloured(125,255,125,255)
    DRAWTEXT("Start Div CCI Up", barindex, Low-4.23*AverageTrueRange[14](close))coloured(125,255,125,255)
    DRAWARROWUP(barindex, low-2.618*AverageTrueRange[14](close))coloured(125,255,125,255)
    divbuy=osLevel
    endif
    oldmincci = mincci
    oldminprice = minprice
    oldminccibar = minccibar
    endif
    
    return icci style(line,2) as "CCI",obLevel coloured(168,168,168) style(dottedline,1) as "overbought level", osLevel coloured(168,168,168) style(dottedline,1) as "oversold level", divsell coloured(200,0,0), divbuy coloured(0,200,0),0
    Nicolas thanked this post
    #121266 quote
    Zigo
    Participant
    Master

    I like to discuss the three divergencies, I will give the exacttime for the different signals:

      1. div. up  SMI 3/2/2020 at 9 PM
      2.  div up CCI 4/2/2020 at 5 AM
      3.  div up RSI 30/1/2020 at 9 PM
      4. div down SMI  one at 13/2/2020 at 9 PM and one at 18/2/2020 at 5 AM
      5.  div down CCI 18/2/2020 at 9 PM
      6. div down RSI 17/2/2020 at 9

    Oblevels and Oslevels

    1. SMI  40 and -40

    2. CCI 50 and – 50

    3. RSI 60 and 40

    One can also use the divergenties in smaller time frames. In the attachement there are all three divergencies visible

    Matriciel thanked this post
    DAXDiv-76-Ticks.png DAXDiv-76-Ticks.png
    #121317 quote
    Matriciel
    Participant
    Master
    Thank you for your work.
    I think the differences are difficult to trade.
    You never really know when they end.
Viewing 9 posts - 1 through 9 (of 9 total)
  • You must be logged in to reply to this topic.

Divergences SMI and CCI


ProBuilder: Indicators & Custom Tools

New Reply
Author
author-avatar
Zigo @zigo Participant
Summary

This topic contains 8 replies,
has 3 voices, and was last updated by Matriciel
5 years, 11 months ago.

Topic Details
Forum: ProBuilder: Indicators & Custom Tools
Language: English
Started: 01/11/2020
Status: Active
Attachments: 6 files
Logo Logo
Loading...