Bard
BardParticipant
Master
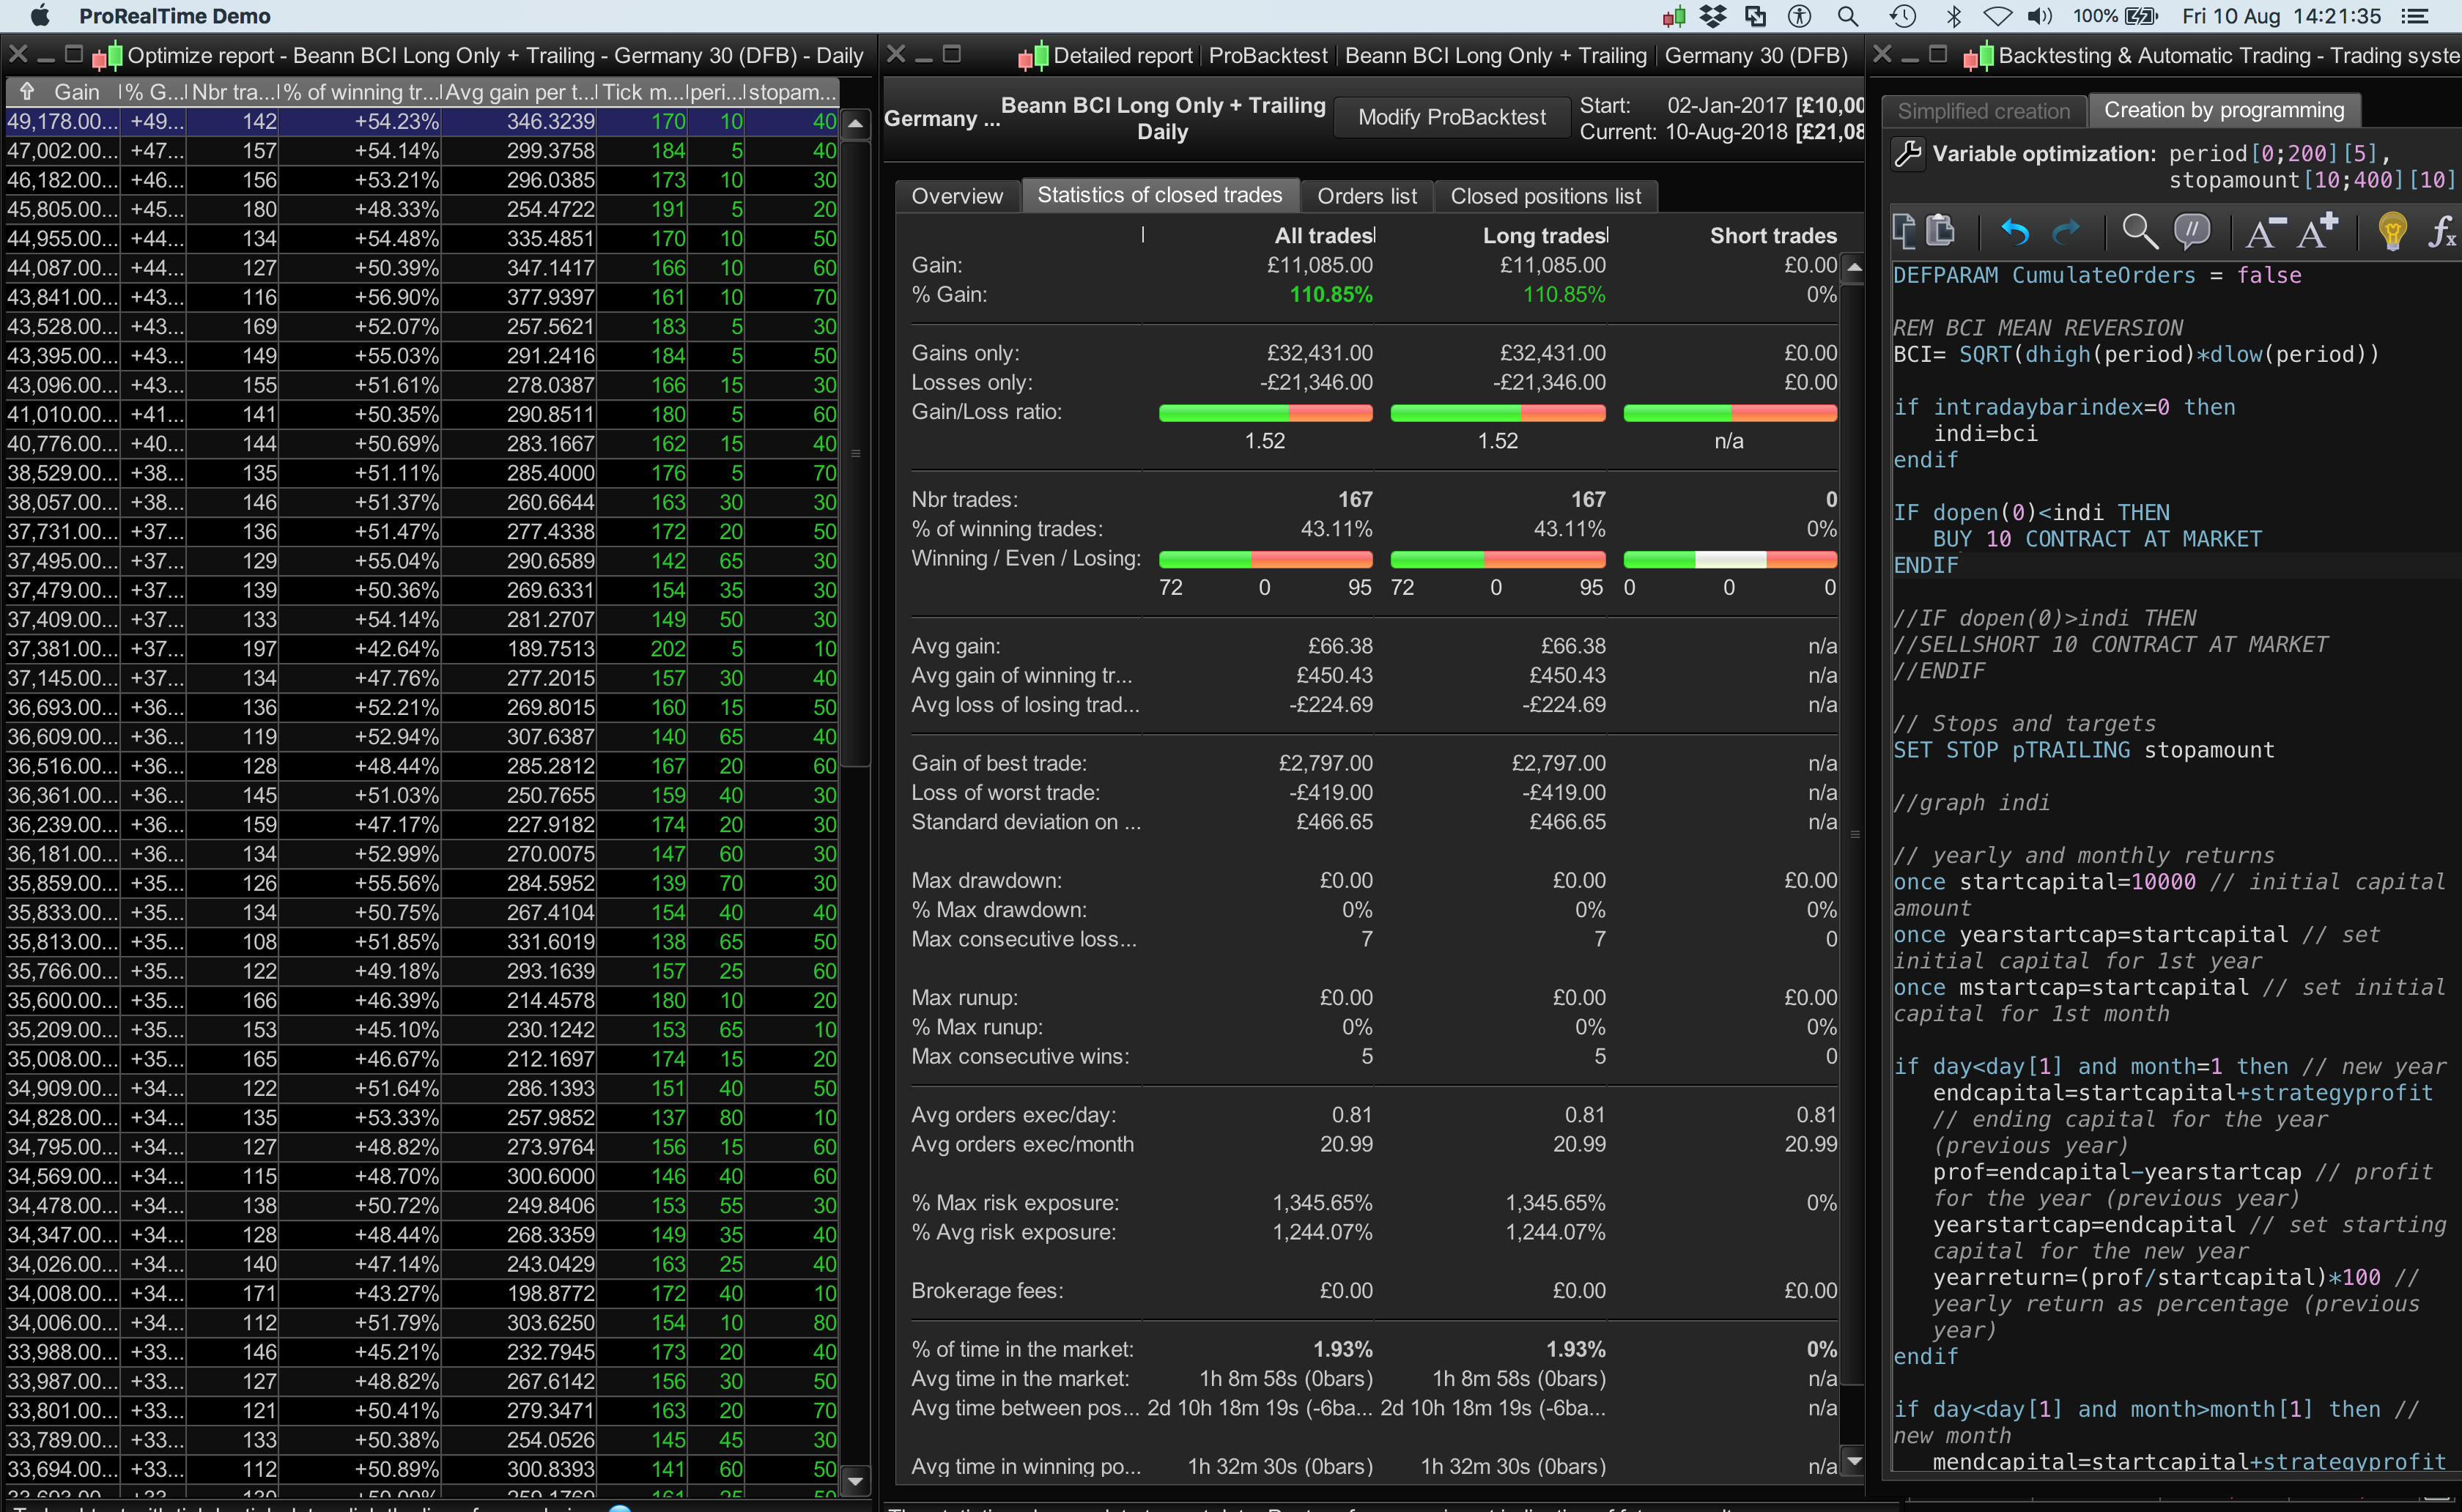
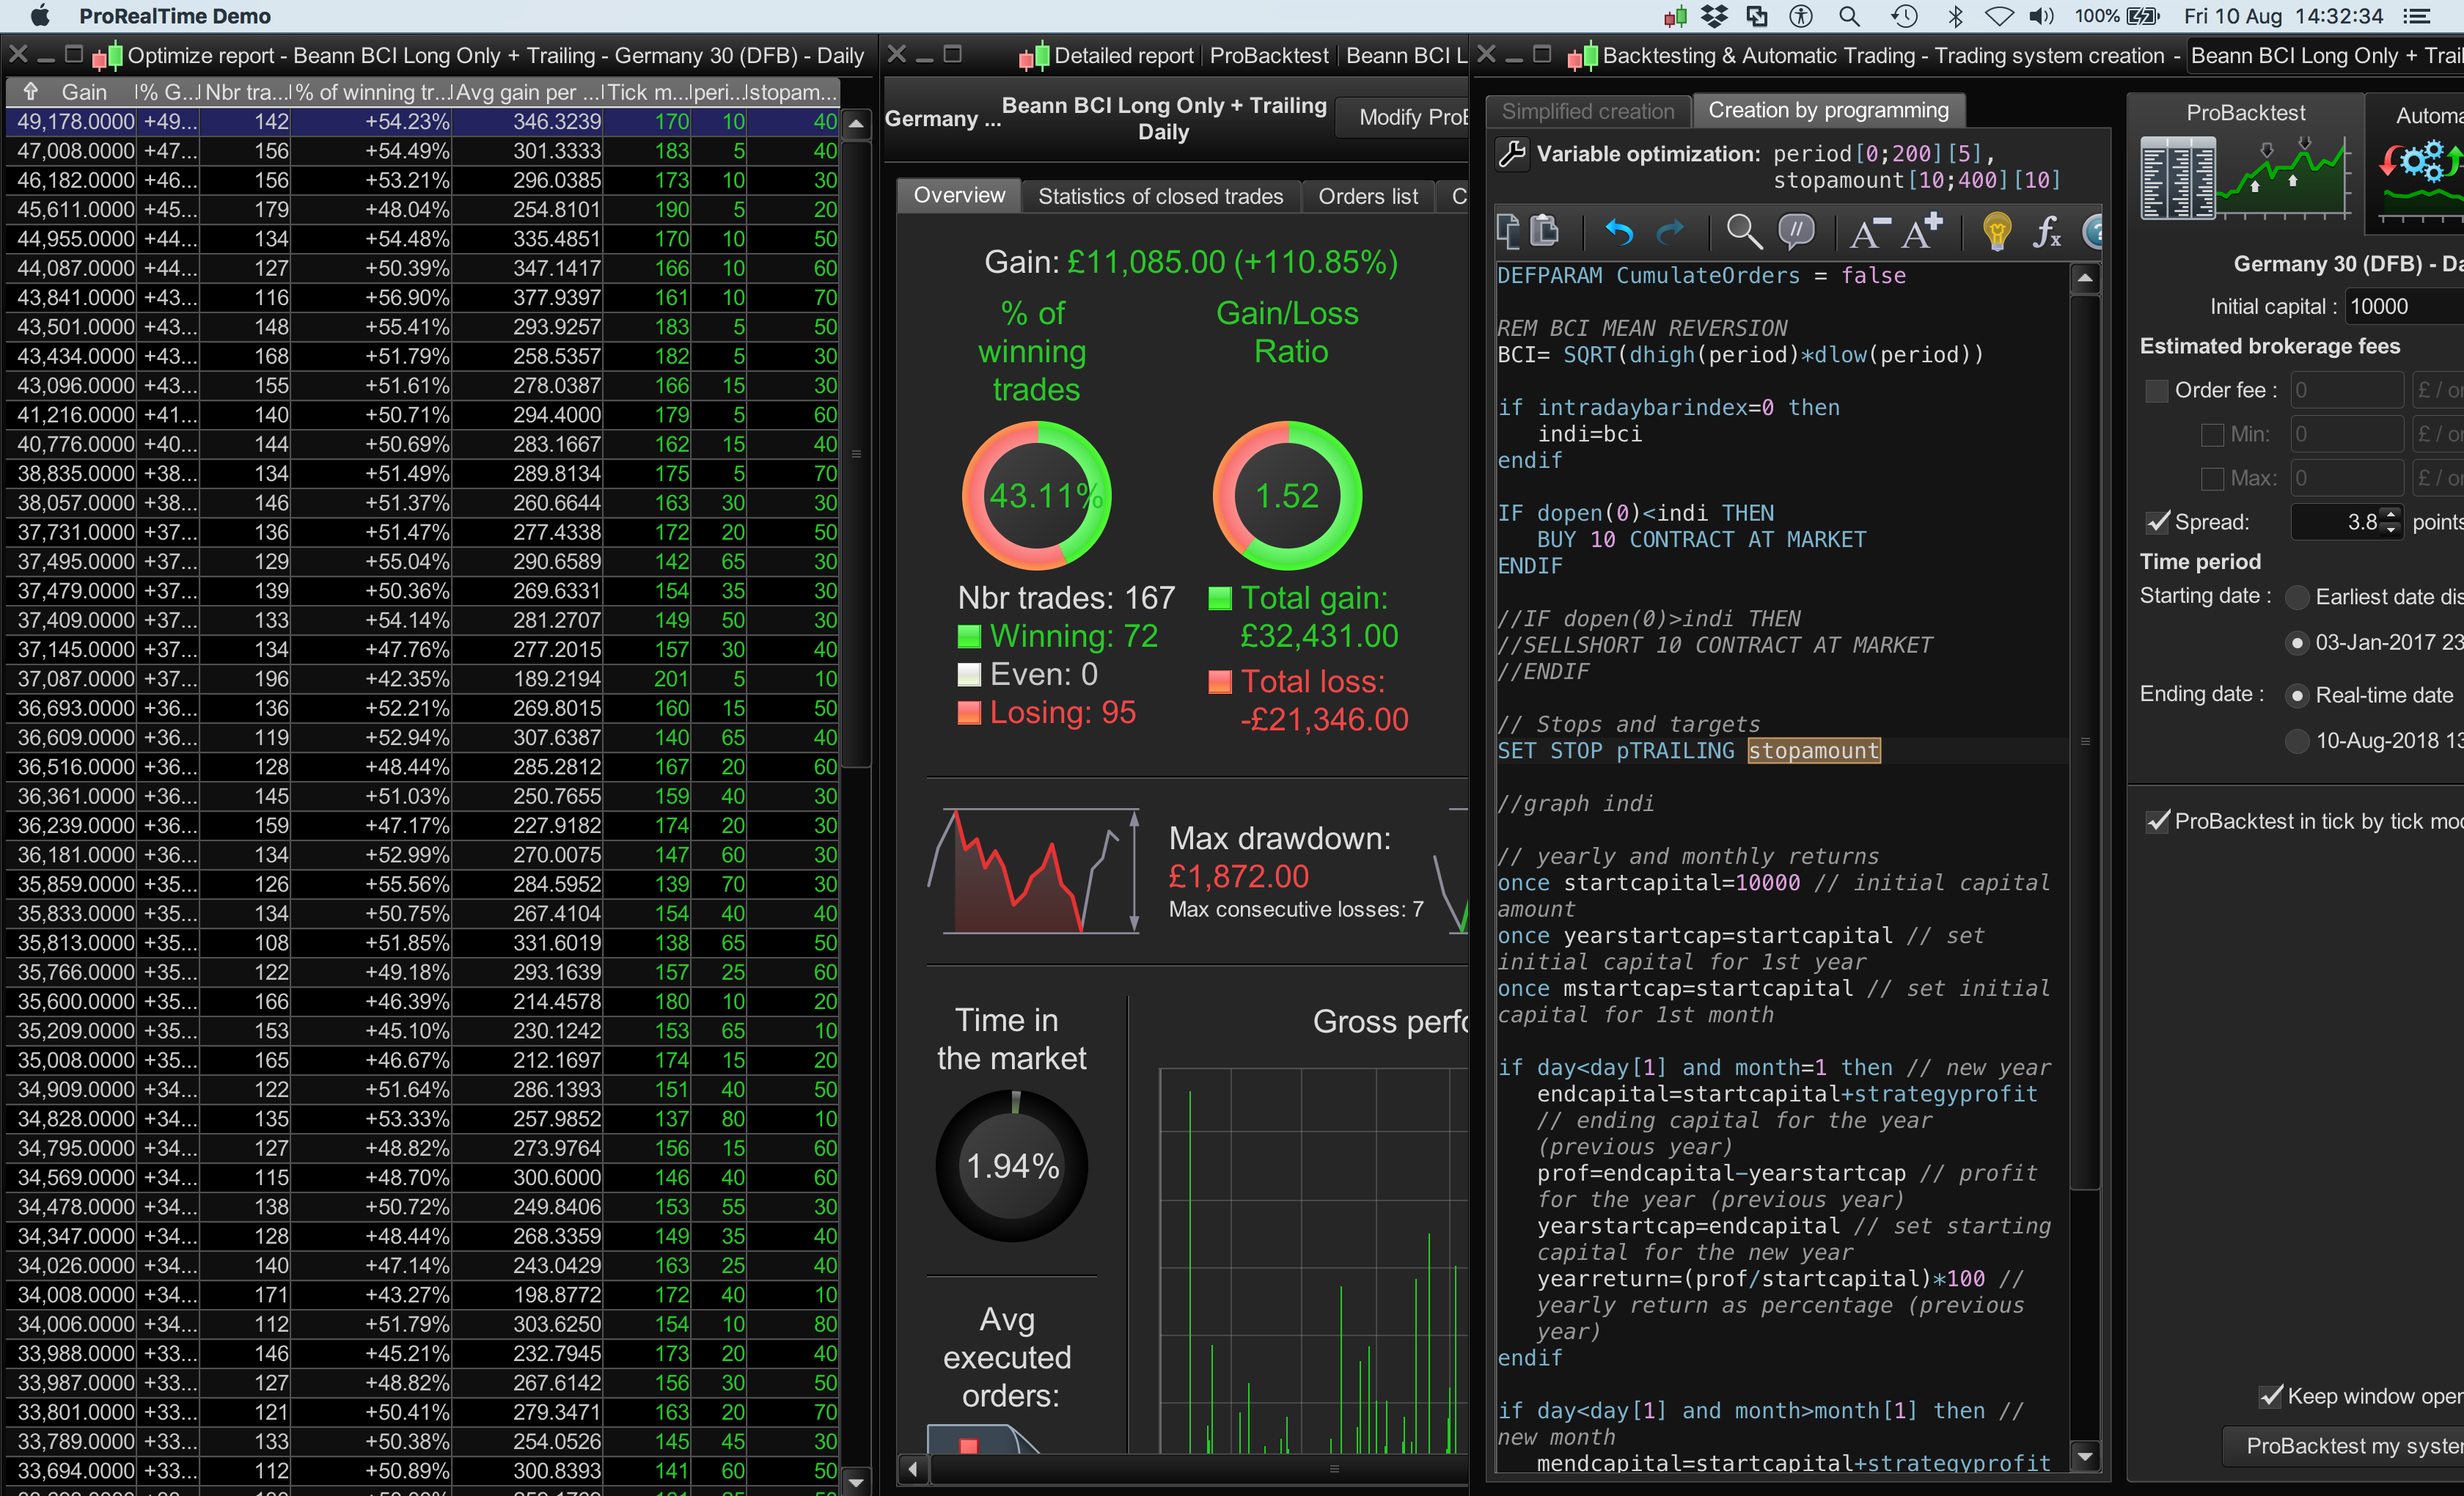
Hi, Can anyone understand why I see two different profit results on this Long only Dax Index Mean Reversion backtest? Different profit figures Optimised Report v’s Detailed Report – Pls see 3x screenshots:Code:
DEFPARAM CumulateOrders = false

REM BCI MEAN REVERSION
BCI= SQRT(dhigh(period)*dlow(period))

if intradaybarindex=0 then
indi=bci
endif

IF dopen(0)<indi THEN
BUY 10 CONTRACT AT MARKET
ENDIF

//IF dopen(0)>indi THEN
//SELLSHORT 10 CONTRACT AT MARKET
//ENDIF

// Stops and targets
SET STOP pTRAILING stopamount
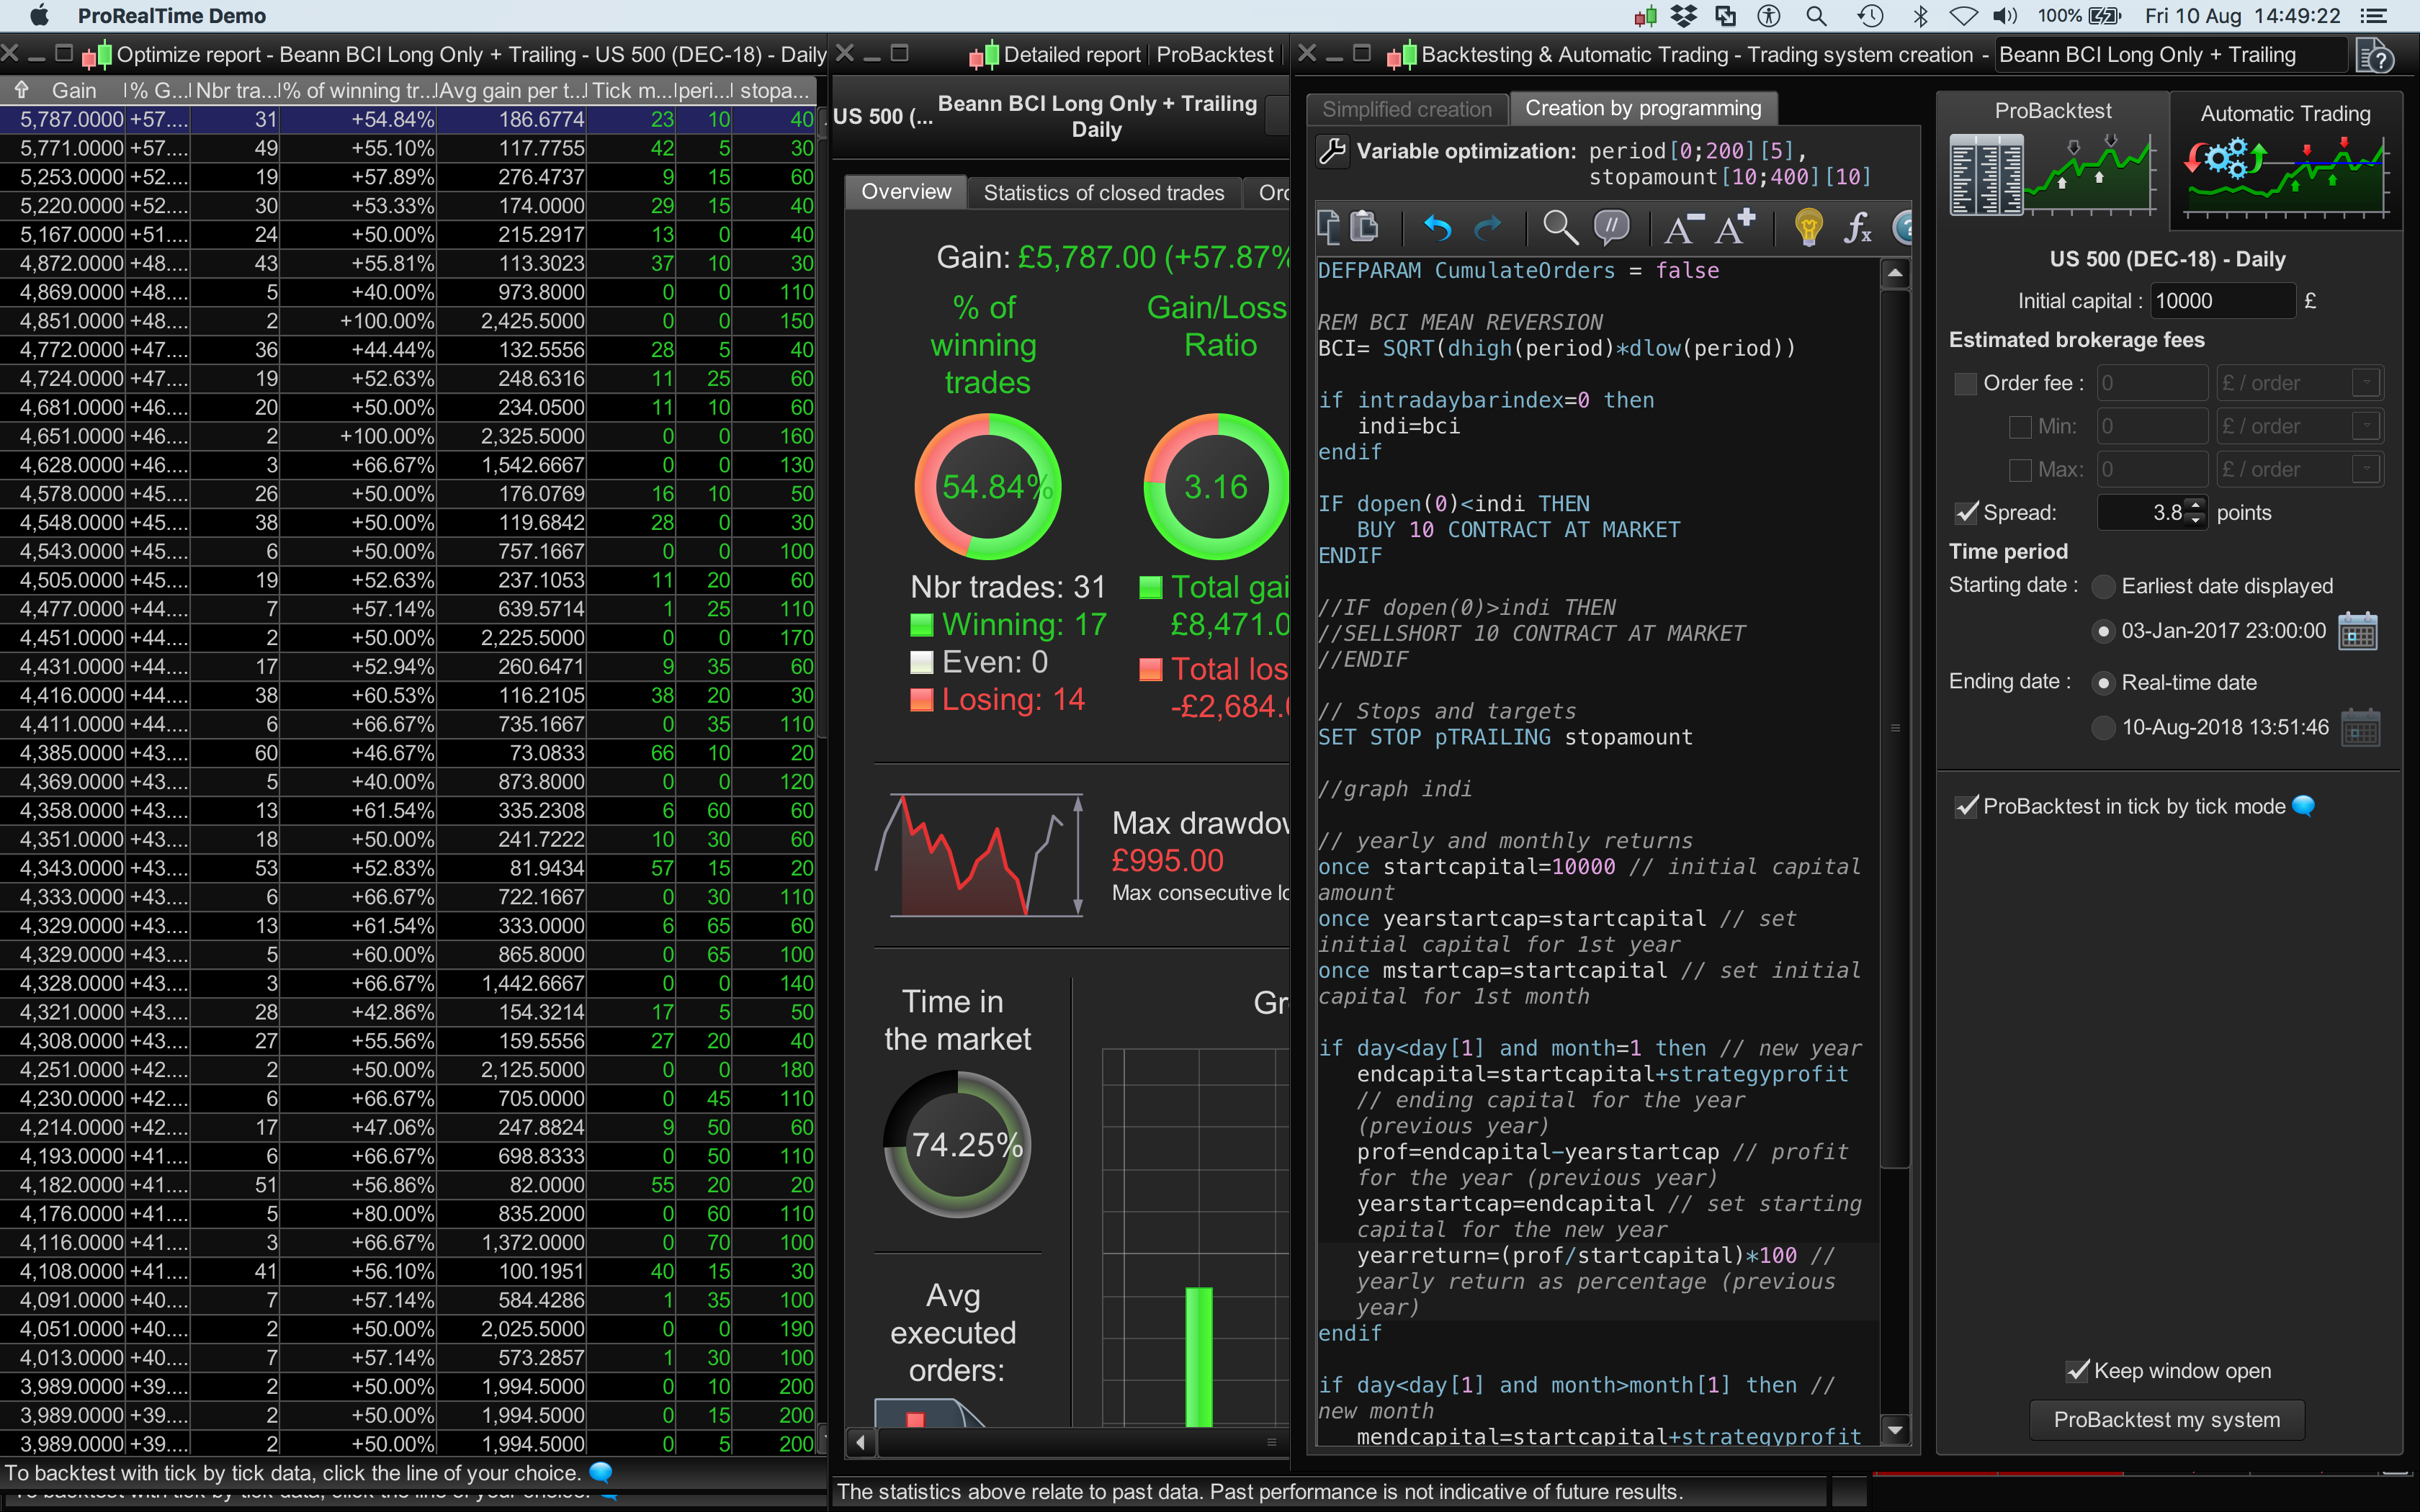
Not seen this before when double optimising (2 parameters)? — Just tried it on the S&P 500 and the results are consistent as per screenshot.
Thanks for any help,
It’s surprising how difficult it can be to understand what exactly is being referred to in posts like this? Well, I find it difficult anyway! 🙂 But I feel that having a go at helping is better than ignoring, even if wrong?
So on that basis, is it to do with the 170 under Tick Mode in the row showing a gain of 49,178? So when these variable values are loaded on a Chart then the value results in 11,085 ??
@Bard, if you need to know why / what the Tick Mode column means then just say?
I may be wrong and I will learn something by trying to help you? 🙂
BardParticipant
Master
All help always appreciated,👌
Yeah, basically I ran an optimisation on this system but was surprised to see a vastly different profit figure in the Optimised Report v’s the small 11k profit in the Detailed Report? All other optimisations on other products matched.
Not sure about the Tick column either?
Cheers!
Bard
surprised to see a vastly different profit figure in the Optimised Report v’s the small 11k profit in the Detailed Report?
If you had referred specifically as above then it would make it so much easier for us to help! 🙂
170 in the Tick Mode column means that during use of the variable values in that row there were 170 instances where the Take Profit and Stop Loss both were hit together in the same bar.
PRT then computes the result as if ONLY the Take Profit was hit and so shows 49,178 as the profit.
However, when the results are loaded onto the Chart / equity curve, PRT then runs Tick by Tick and computes the results exactly as would be the case in real time trading … hence a profit of only 11,085.
Exactly as would be the case in real time trading means …
- If Take Profit is hit first then Profit is the result.
- If Stop Loss is hit first then Loss is the result.
Hope that makes sense? If not just say.
BardParticipant
Master
Brilliant, thanks @GraHal,
This makes sense about order flow (profit v’s loss being hit first), yet I’m thinking why aren’t all backtests producing different results between the Optimised and Detailed? It must be to do with whether the backtest is being done on a tic by tic basis yet that US S&P 500 is on tic mode too – both tests Jan 2017 to present?
Now, I have about another 50 questions if you’re not too busy today? 😄
why aren’t all backtests producing different results between the Optimised and Detailed?
When results are same in Optimised and Backtest even though there is a value under Tick Mode column it means that the Take Profit is being hit first even in tick by tick running … so could be an indication of realistic / workable variable values.
Re other 50 questions … most of the answers will likely be on this site already? 🙂 But in any case be specific what your problem was and refer to values etc in your screen shots. I had to read your original post about 4 or 5 times before I – even then – I had to guess at what issue you were experiencing.
Reason I had to guess was because I was thinking … he must know what Tick Mode means in the Optimiser results else he would look it up / read up in case this may be linked to his problem??
Anybody else reading this … Make it Easy for us to help You.
I use google.com for search and type in ProRealCode.com then type my chosen search term. This gets me more readable / usable results than using the search function on this website.
BardParticipant
Master
Thanks @GraHal, Yes, sorry, it should have been more clearly explained using the profit figures. And yes to Bing versus this site search – my French and German isn’t as good as it used to be!
BardParticipant
Master
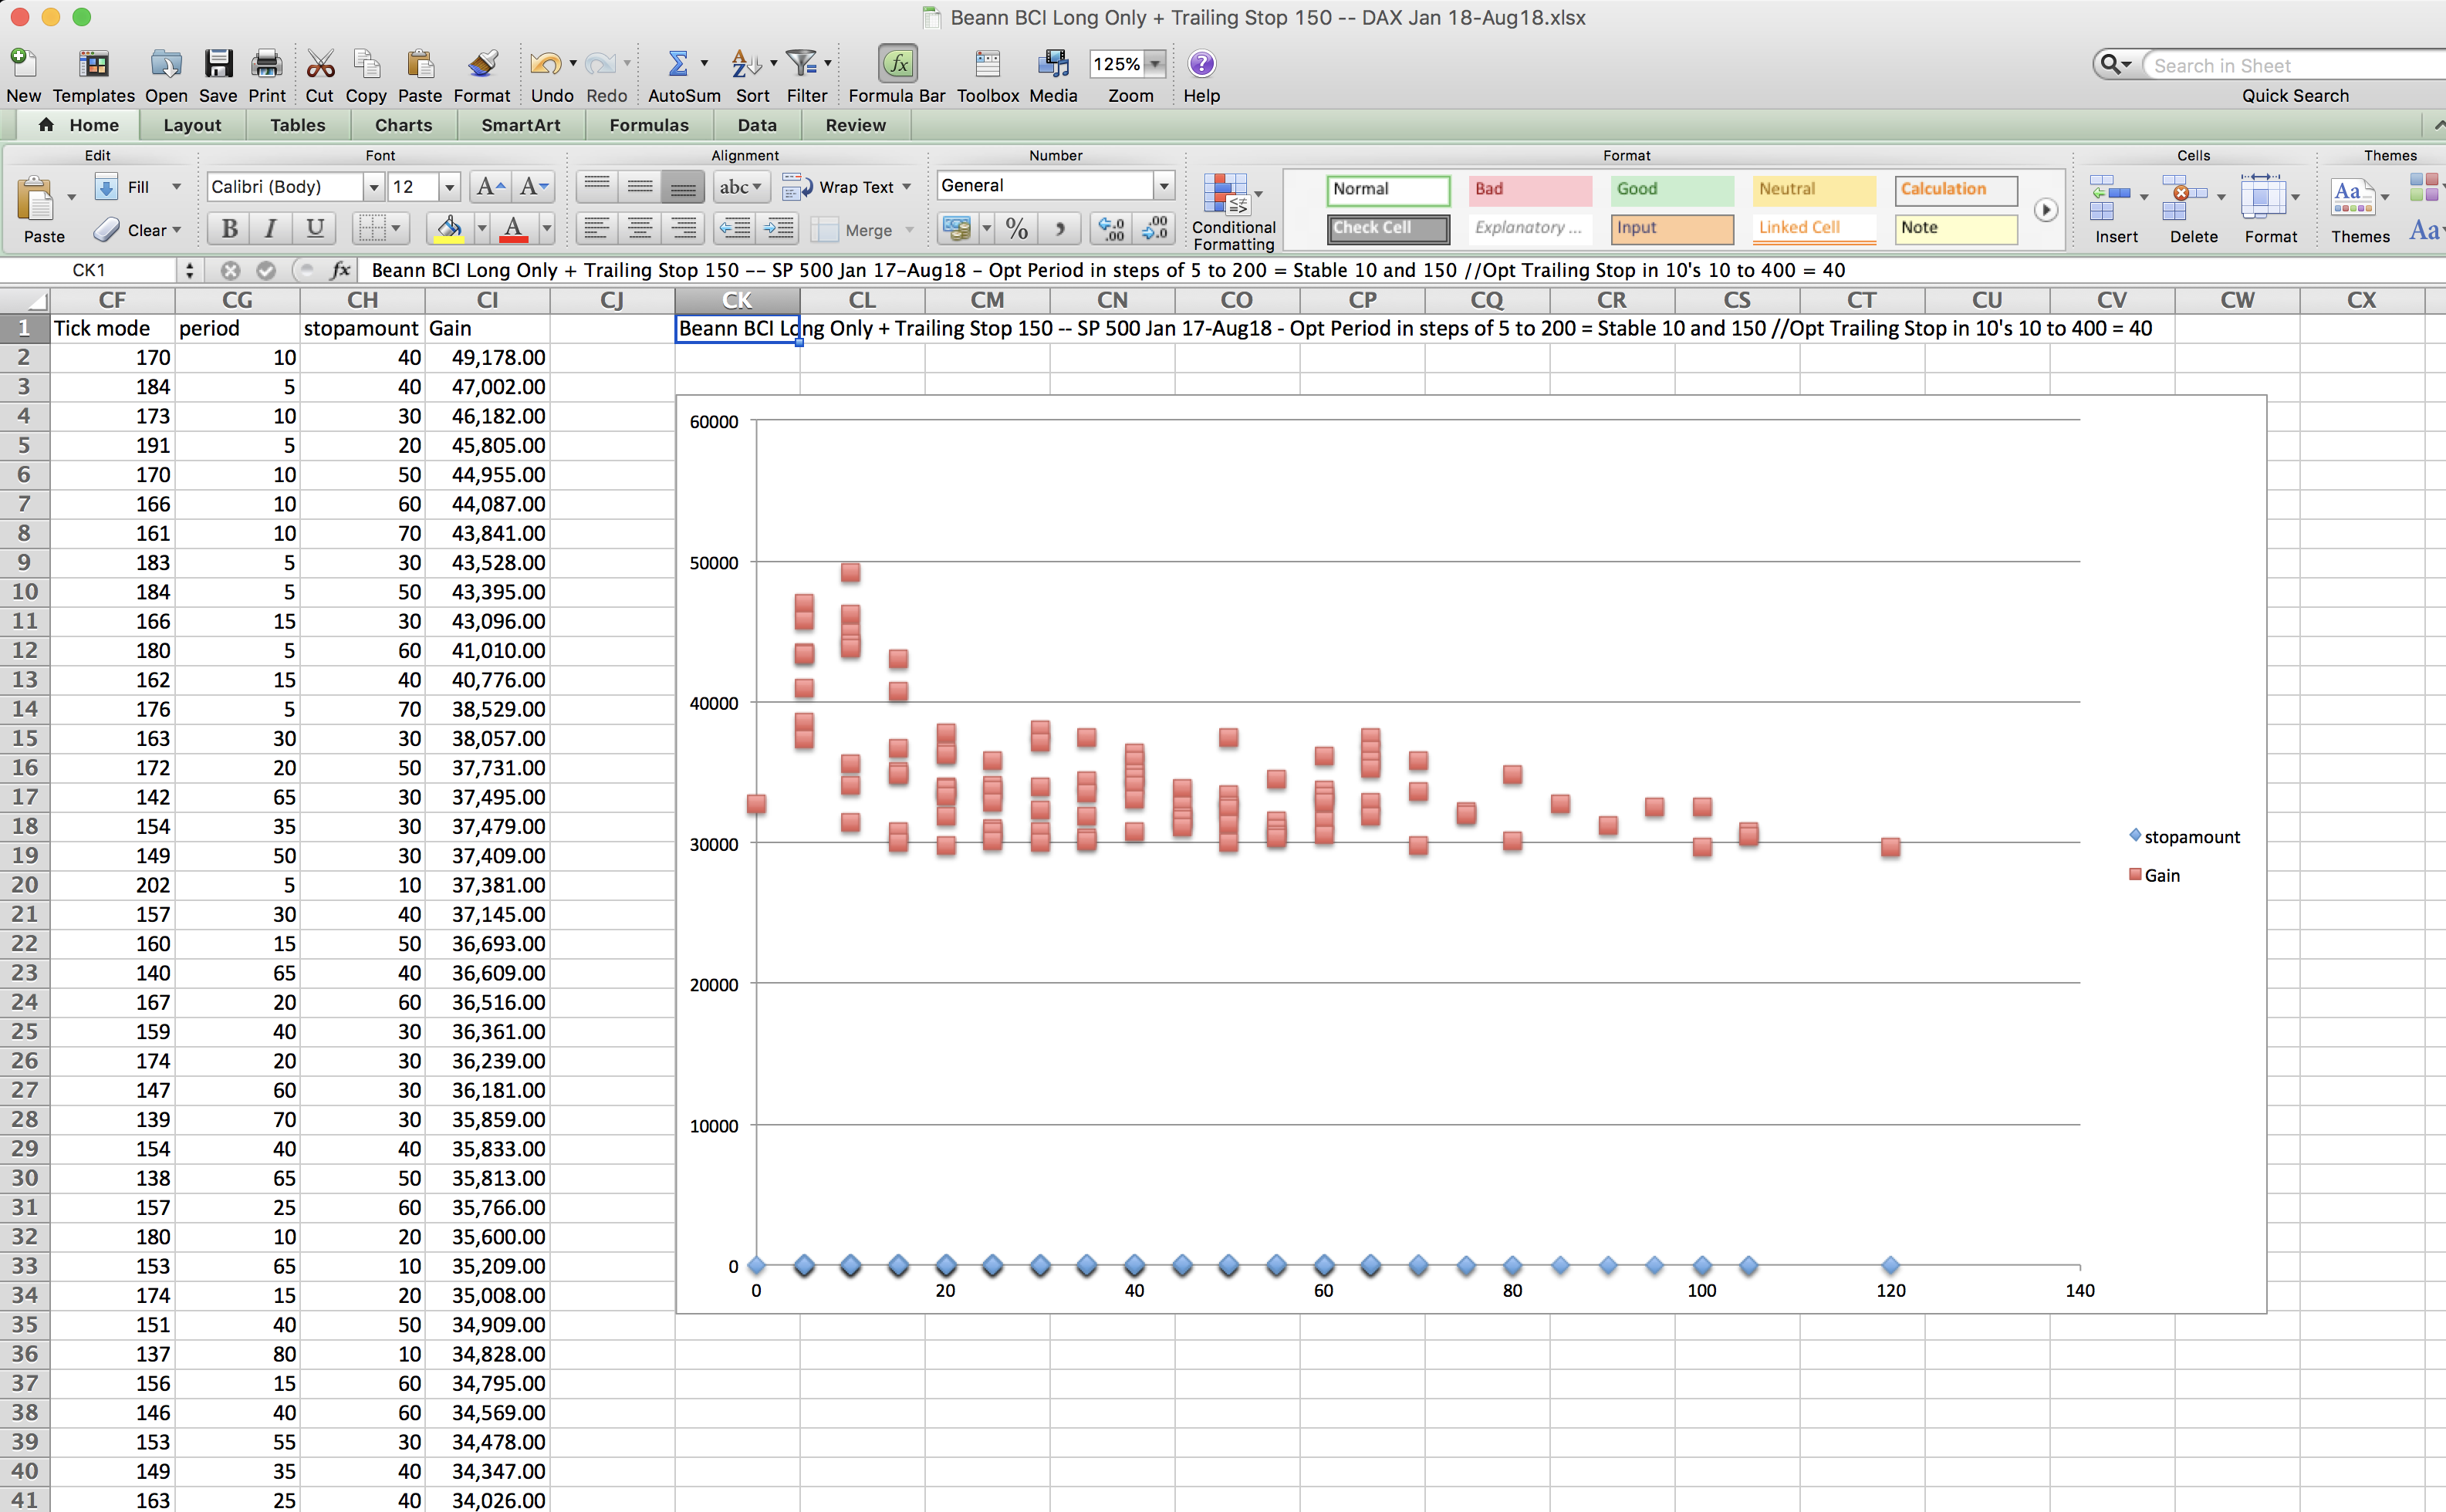
I don’t remember this difference in profit figures (pls see headline subject heading) happening when I was doing optimisations last year and then putting the results into Excel (to find robust ranges of optimised parameters) but it’s just happened again optimising s trailing stop.
Is there any reason why an optimised report can’t calculate the same way as a detailed report @GraHal @nicolas? Is it just a case of too many permutations to calculate?
Cheers
s there any reason why an optimised report can’t calculate the same way as a detailed report
Yes it would take far too long as every line would have to optimise on a tick by tick basis and at the end of all that time for us and server resource at PRT then we only go forward with one line worth of the results so it is a best compromise the way it currently does it.
Whichever line of the optimised results that we click on … loads onto a chart on a tick by tick basis and the Detailed Report can then be viewed.
I don’t remember this difference in profit figures happening when I was doing optimisations last year
Maybe you didn’t have Set Stop Profit and Set Stop Loss in the strategy last year and so you would not get any Tick Mode values at all resulting in difference between Optimisation and Detailed Report?
so it is a best compromise the way it currently does it.
I’m not sure it is as we don’t get to see all of the possible results listed in the final report and the results we do get to see are not true tick by tick testing until we click on them. For me this is a major negative to any tick by tick back testing and a big reason why I currently stick to close of candle back tests in which I have much more confidence in the back test results being quantifiable.
Have you put your better idea above (and I agree) forward to PRT as a suggestion for improvement?
I am going to send in a few more ideas (when I get less busy) to PRT via a direct email to PRT (contact@prorealtime.com) so I have a copy and so I know my suggestion has at least been seen and forwarded to the dev team etc.
Who knows … latest improvement suggestions may get rolled up into PRT version 11.0 (here’s hoping! 🙂 ).
BardParticipant
Master
I never limit profits and generally don’t use those kind of traditional stops. I think it’s the fact that I just wasn’t using tick by tick backtests much (or at all).