Bonjour, j’ai plusieurs code d’indicateurs que je display pour vérifier les prises de positions avec l’automatique.
Et j’ai des problèmes ca ne prend pas les positions aux bons endroits (je réintègre le code de mes indicateurs dans mon code de trade)
Indicateur 1
// Humble LinReg Candles
// Inputs
SignalSmoothing = 7
SimpleMASignalLine = 1 // Set to 1 for True, 0 for False
LinReg = 1 // Set to 1 for True, 0 for False
LinearRegressionLength = 11

// Calculate Linear Regression values
IF LinReg THEN
bOpen = LinearRegression[LinearRegressionLength](open)
bHigh = LinearRegression[LinearRegressionLength](high)
bLow = LinearRegression[LinearRegressionLength](low)
bClose = LinearRegression[LinearRegressionLength](close)
ELSE
bOpen = open
bHigh = high
bLow = low
bClose = close
ENDIF

// Calculate Signal
IF SimpleMASignalLine THEN
signal = Average[SignalSmoothing](bClose)
ELSE
signal = ExponentialAverage[SignalSmoothing](bClose)
ENDIF

// Plot candles
r = bOpen < bClose

IF r THEN
DRAWCANDLE(bOpen, bHigh, bLow, bClose) COLOURED ("green")
ELSE
DRAWCANDLE(bOpen, bHigh, bLow, bClose) COLOURED ("red")
ENDIF

RETURN signal
Indicateur 2 :
// UT Bot Alerts
// Inputs
KeyVaule = 2
ATRPeriod = 11
UseHeikinAshi = 0

// Calculate ATR
xATR = AverageTrueRange[ATRPeriod]

// Calculate nLoss
nLoss = KeyVaule * xATR

// Use Heikin Ashi Candles if enabled
IF UseHeikinAshi = 1 THEN
src = Close  //HeikinAshi
ELSE
src = Close
ENDIF

// Calculate xATRTrailingStop
xATRTrailingStop = 0
IF src > xATRTrailingStop[1] AND src[1] > xATRTrailingStop[1] THEN
xATRTrailingStop = Max(xATRTrailingStop[1], src - nLoss)
ELSIF src < xATRTrailingStop[1] AND src[1] < xATRTrailingStop[1] THEN
xATRTrailingStop = Min(xATRTrailingStop[1], src + nLoss)
ELSIF src > xATRTrailingStop[1] THEN
xATRTrailingStop = src - nLoss
ELSE
xATRTrailingStop = src + nLoss
ENDIF

// Calculate position
pos = 0
IF src[1] < xATRTrailingStop[1] AND src > xATRTrailingStop[1] THEN
pos = 1
ELSIF src[1] > xATRTrailingStop[1] AND src < xATRTrailingStop[1] THEN
pos = -1
ELSE
pos = pos[1]
ENDIF

// EMA Calculation
ema = ExponentialAverage[1](src)

// Buy and Sell Conditions
above = ema > xATRTrailingStop AND ema[1] <= xATRTrailingStop[1]
below = ema < xATRTrailingStop AND ema[1] >= xATRTrailingStop[1]

// Draw Arrows
IF src > xATRTrailingStop AND above THEN
DRAWARROWUP(barindex, src - xATR) COLOURED (255, 255, 0)
endif
IF src < xATRTrailingStop AND below THEN
DRAWARROWDOWN(barindex, src + xATR) COLOURED (127, 0,255)
endif

return
Indicateur 3
//input parameters
TCLen = 12
MA1 = 26
MA2 = 50

Once Factor = 0.5

if barindex>MA2 then
//{Calculate a MACD Line}
XMAC = ExponentialAverage[MA1](Close) - ExponentialAverage[MA2](Close)

//{1st Stochastic: Calculate Stochastic of a MACD}
Value1 = Lowest[TCLen](XMAC)
Value2 = Highest[TCLen](XMAC) - Value1

//{%Fast K of MACD}
if Value2 > 0 then
Frac1 =  ((XMAC - Value1)/Value2) * 100
else
Frac1 = Frac1[1]
endif

//{Smoothed Calculation for % Fast D of MACD}
PF = PF[1] + (Factor * (Frac1 - PF[1]))

//{2nd Stochastic: DCalculate Stochastic of smoothed Percent Fast D, 'PF', above}
Value3 = Lowest[TCLen](PF)
Value4 = Highest[TCLen](PF) - Value3

//{% of Fast K of PF}
if Value4 > 0 then
Frac2 = ((PF - Value3)/Value4) * 100
else
Frac2 = Frac2[1]
endif

//{Smoothed Calculation for %Fast D of PF}
PFF = PFF[1] + (Factor * (Frac2 - PFF[1]))
endif

RETURN PFF, 75 coloured(0,0,255) as "level 75", 25 coloured(0,0,255) as "level 25"
Code du trading automatique:
//https://www.youtube.com/watch?v=dgALZfsFhow
// Humble LinReg Candles
// Inputs
SignalSmoothing = 7
SimpleMASignalLine = 1 // Set to 1 for True, 0 for False
LinReg = 1 // Set to 1 for True, 0 for False
LinearRegressionLength = 11

// Calculate Linear Regression values
IF LinReg THEN
bOpen = LinearRegression[LinearRegressionLength](open)
bHigh = LinearRegression[LinearRegressionLength](high)
bLow = LinearRegression[LinearRegressionLength](low)
bClose = LinearRegression[LinearRegressionLength](close)
ELSE
bOpen = open
bHigh = high
bLow = low
bClose = close
ENDIF

// Calculate Signal
IF SimpleMASignalLine THEN
signal = Average[SignalSmoothing](bClose)
ELSE
signal = ExponentialAverage[SignalSmoothing](bClose)
ENDIF

// Plot candles
r = bOpen < bClose

//STC better MACD
//input parameters
TCLen = 12
MA1 = 26
MA2 = 50

Once Factor = 0.5

if barindex>MA2 then
//{Calculate a MACD Line}
XMAC = ExponentialAverage[MA1](Close) - ExponentialAverage[MA2](Close)

//{1st Stochastic: Calculate Stochastic of a MACD}
Value1 = Lowest[TCLen](XMAC)
Value2 = Highest[TCLen](XMAC) - Value1

//{%Fast K of MACD}
if Value2 > 0 then
Frac1 =  ((XMAC - Value1)/Value2) * 100
else
Frac1 = Frac1[1]
endif

//{Smoothed Calculation for % Fast D of MACD}
PF = PF[1] + (Factor * (Frac1 - PF[1]))

//{2nd Stochastic: DCalculate Stochastic of smoothed Percent Fast D, 'PF', above}
Value3 = Lowest[TCLen](PF)
Value4 = Highest[TCLen](PF) - Value3

//{% of Fast K of PF}
if Value4 > 0 then
Frac2 = ((PF - Value3)/Value4) * 100
else
Frac2 = Frac2[1]
endif

//{Smoothed Calculation for %Fast D of PF}
PFF = PFF[1] + (Factor * (Frac2 - PFF[1]))
endif
STCRising = PFF => PFF[1]
STCFalling = PFF =< PFF[1]

// UT Bot Alerts
// Inputs
KeyVaule = 2
ATRPeriod = 11
UseHeikinAshi = 0

// Calculate ATR
xATR = AverageTrueRange[ATRPeriod](bOpen)

// Calculate nLoss
nLoss = KeyVaule * xATR

// Use Heikin Ashi Candles if enabled
IF UseHeikinAshi = 1 THEN
src = bClose  //HeikinAshi
ELSE
src = bClose
ENDIF

// Calculate xATRTrailingStop
xATRTrailingStop = 0
IF src > xATRTrailingStop[1] AND src[1] > xATRTrailingStop[1] THEN
xATRTrailingStop = Max(xATRTrailingStop[1], src - nLoss)
ELSIF src < xATRTrailingStop[1] AND src[1] < xATRTrailingStop[1] THEN
xATRTrailingStop = Min(xATRTrailingStop[1], src + nLoss)
ELSIF src > xATRTrailingStop[1] THEN
xATRTrailingStop = src - nLoss
ELSE
xATRTrailingStop = src + nLoss
ENDIF

// Calculate position
pos = 0
IF src[1] < xATRTrailingStop[1] AND src > xATRTrailingStop[1] THEN
pos = 1
ELSIF src[1] > xATRTrailingStop[1] AND src < xATRTrailingStop[1] THEN
pos = -1
ELSE
pos = pos[1]
ENDIF

// EMA Calculation
ema = ExponentialAverage[1](src)

// Buy and Sell Conditions
above = ema > xATRTrailingStop AND ema[1] <= xATRTrailingStop[1]
below = ema < xATRTrailingStop AND ema[1] >= xATRTrailingStop[1]

// Draw Arrows
//IF src > xATRTrailingStop AND above THEN
//DRAWARROWUP(barindex, src - xATR) COLOURED (0, 255, 0)
//endif
//IF src < xATRTrailingStop AND below THEN
//DRAWARROWDOWN(barindex, src + xATR) COLOURED (255, 0, 0)

// Conditions d'achat
BuyCondition1 = src > xATRTrailingStop AND above // UT bot alerts draw arrow up
BuyCondition2 = bClose > signal AND bClose > bOpen// Green linear candle close above the white line
BuyCondition3 = STCRising// STC is green (rising)

// Conditions de vente
SellCondition1 = src < xATRTrailingStop AND below // UT bot alerts draw arrow down
SellCondition2 = bClose < signal AND bClose < bOpen// Red linear candle close below the white line
SellCondition3 =  STCFalling// STC is red (falling)


IF BuyCondition1 AND BuyCondition2 AND BuyCondition3 THEN
BUY 1 SHARES AT MARKET
SET STOP LOSS  signal - xATR
Endif
IF SellCondition1 AND SellCondition2 AND SellCondition3 THEN
SELLSHORT 1 SHARES AT MARKET
SET STOP LOSS  signal + xATR
endif

IF longonmarket AND bOpen > bClose THEN
sell at market
ENDIF

IF shortonmarket AND bOpen < bClose THEN
EXITSHORT AT MARKET
ENDIF
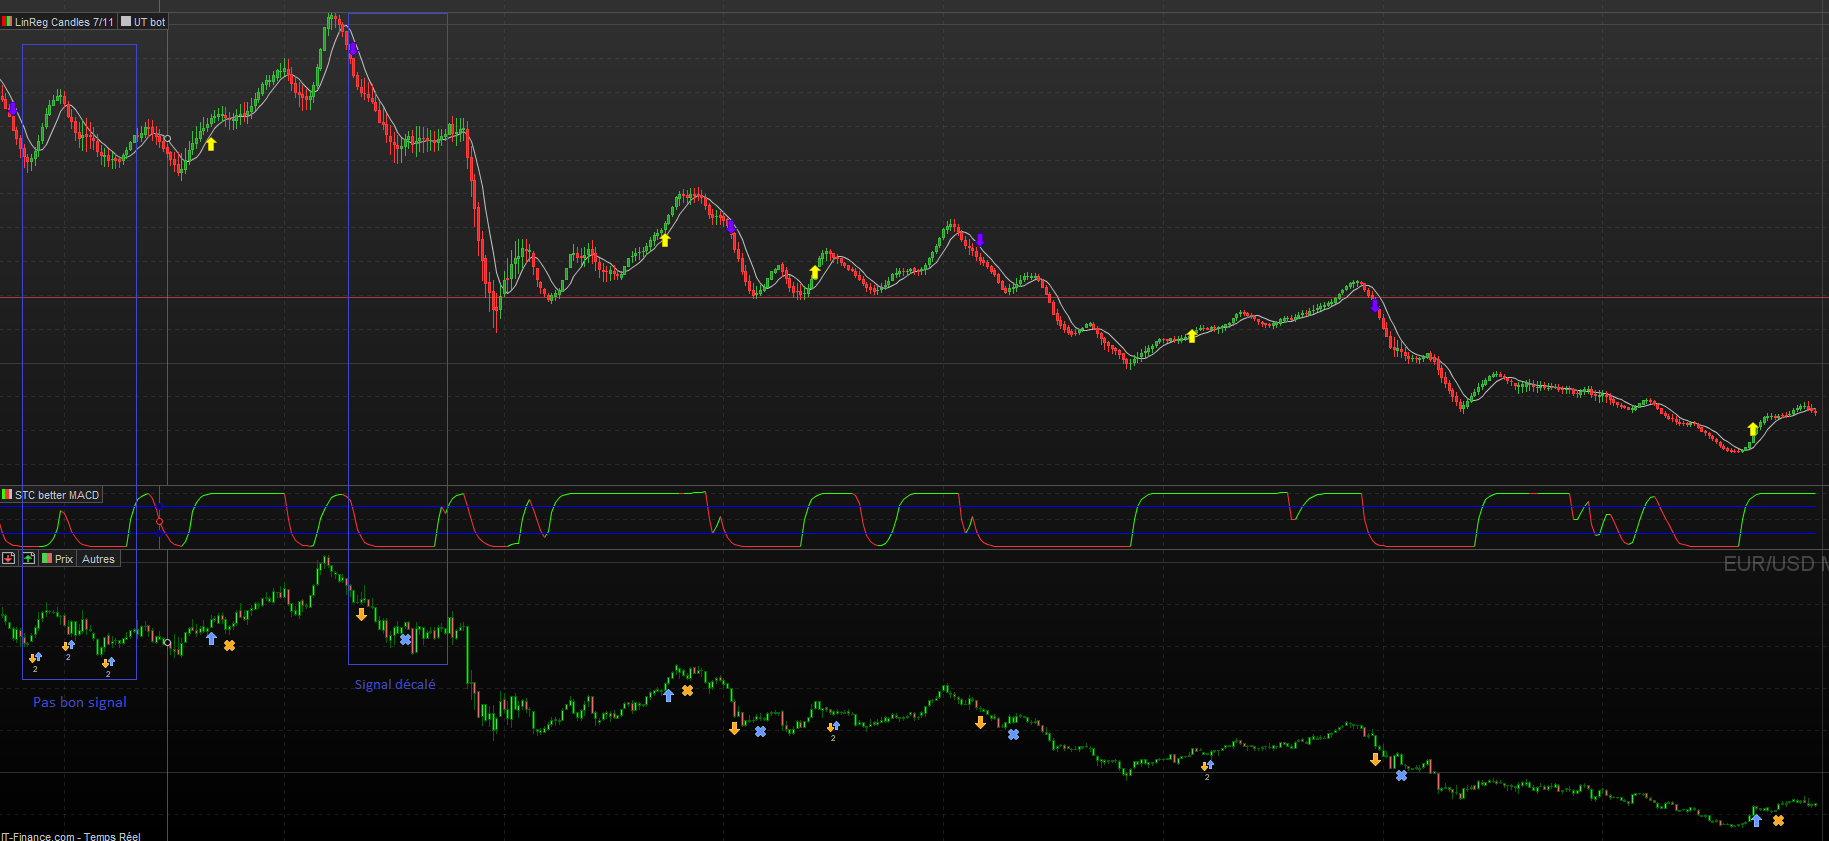
Dans ma viz j’enlève les bougie classique, j’ai donc mes bougies linreg + ema, sur lequel j’applique l’indicateur UT bot.
Quand je compare avec les prises de positions il y’en a 70 % sur les bon signaux et d’autres sont soit “inventés” soit décalés de 3-4 unités.
J’ai creusé longtemps et changé sur l’xATR par bOpen, car c’est ce qui faisait correspondre le plus (bClose ou close en invente d’autant plus)
Un détails doit m’échapper :/