Bonjour à tous.
J’aimerais créer un indicateur dérivé sur l’Order Block que je mets en copie ci-dessous.
L’objectif est de créer un histogramme permettant de placer des alertes lorsque le prix rempli les conditions suivantes :
– Un order block acheteur (vert) est formé + Plus bas de la bougie est dans l’order block (entre la limite haute et la limite basse), nous avons histogramme = à 1.
– UN order block vendeur (rouge) est formé + plus haut de la bougie est dans l’odrer block (entre la limite haute et la limite basse), nous avons histogramme = à -1
Si autre condition remplie histogramme = 0.
Cela ne doit être réalisé que lorsque l’ordre block est donc formé et présent.
Il s’agit d’une détection de prix lorsqu’il se trouve en OB. Chacun pourra modifier par la suite selon ses propres critères.
// Sonarlabs - Order Block Finder
// converted from TradingView
// Lower the sensitivity to show more order blocks. A higher sensitivity will show less order blocks

defparam drawonlastbaronly=true

//Transparency = 80

//sens = 28

once obcreatedbear = 0
once obcreatedbull = 0
once crossindexbear = 0
once crossindexbull = 0


// Custom Rate of Change (ROC) calculation. This is to calculate high momentum moves in the market.
pc = ((open - open[4]) / open[4]) * 100


// -----------------
sens = sens/100 //ExponentialAverage[8](pc) //sens/100
OBBullMitigation = close[1]
OBBearMitigation = close[1]


// If the ROC crossover our Sensitivty input - Then create a Bearish Order Block
// Sensitivty is negative as this is a Bearish OB
if pc crosses under -sens then
obcreatedbear = 1
crossindexbear = barindex
endif


// If the ROC crossover our Sensitivty input - Then create a Bullish Order Block
if pc crosses over sens then
obcreatedbull = 1
crossindexbull = barindex
endif


////////////////////////////////////////////////////////////////////////////////////////////////////////////////
//      Calculation
////////////////////////////////////////////////////////////////////////////////////////////////////////////////

// -------------------------------
// Bearish OB Creation
// -------------------------------
// Check if we should create a OB. Also check if we haven't created an OB in the last 5 candles.
if obcreatedbear and (crossindexbear - crossindexbear[1]) > 5 then
lastgreen = 0
hhighest = 0
// Loop through the most recent candles and find the first GREEN (Bullish) candle. We will place our OB here.
for i = 4 to 15
if close[i] > open[i] then
lastgreen = i
//populate the arrays of order block to draw them later
$left[plot]= barindex[lastgreen]
$top[plot]=high[lastgreen]
$bottom[plot]=low[lastgreen]
$right[plot]=barindex[lastgreen]
plot=plot+1 //increase the array column for next data
break
endif
next
endif


// -------------------------------
// Bullish OB Creation
// -------------------------------
// Check if we should create a OB, Also check if we haven't created an OB in the last 5 candles.
if obcreatedbull and (crossindexbull - crossindexbull[1]) > 5 then
lastred = 0
hhighest = 0
// Loop through the most recent candles and find the first RED (Beaarish) candle. We will place our OB here.
for ibull = 4 to 15
if close[ibull] < open[ibull] then
lastred = ibull
//populate the arrays of order block to draw them later
$leftbull[plotbull]= barindex[lastred]
$topbull[plotbull]=high[lastred]
$bottombull[plotbull]=low[lastred]
$rightbull[plotbull]=barindex[lastred]
plotbull=plotbull+1 //increase the array column for next data
break
endif
next
endif


////////////////////////////////////////////////////////////////////////////////////////////////////////////////
//      Cleanup
////////////////////////////////////////////////////////////////////////////////////////////////////////////////

// Clean up Bearish OB boxes
if plot>0 then
for j = plot-1 downto 0 //0 to plot-1
// If the two last closes are above the high of the bearish OB - Remove the OB
if $left[j]>0 then //check if the zone still exist
itop = $top[j]
breakout = summation[max(1,barindex-$left[j])](OBBearMitigation>itop)>=1 //2
if breakout then
$left[j]=0
endif
endif
next
endif

// Clean up Bullish OB boxes
if plotbull>0 then
for jbull = plotbull-1 downto 0 //0 to plotbull-1
// If the two last closes are below the low of the bullish OB - Remove the OB
if $leftbull[jbull]>0 then //check if the zone still exist
ibot = $bottombull[jbull]
breakoutbull = summation[max(1,barindex-$leftbull[jbull])](OBBullMitigation<ibot)>=1
if breakoutbull then
$leftbull[jbull]=0
endif
endif
next
endif

////////////////////////////////////////////////////////////////////////////////////////////////////////////////
//     Drawing
////////////////////////////////////////////////////////////////////////////////////////////////////////////////

if islastbarupdate then
//plot the Bearish boxes
if  plot>0 then //islastbarupdate and
for j = plot-1 downto 0 //0 to plot-1
if $left[j]>0 then
drawrectangle($left[j],$top[j],barindex,$bottom[j]) coloured("red",Transparency)bordercolor("red",Transparency)
endif
next
endif
//plot the Bullish boxes
if  plotbull>0 then //islastbarupdate and
for jbull = plotbull-1 downto 0 //0 to plotbull-1
if $leftbull[jbull]>0 then
drawrectangle($leftbull[jbull],$bottombull[jbull],barindex,$topbull[jbull]) coloured("green",Transparency)bordercolor("green",Transparency)
endif
next
endif
endif

return
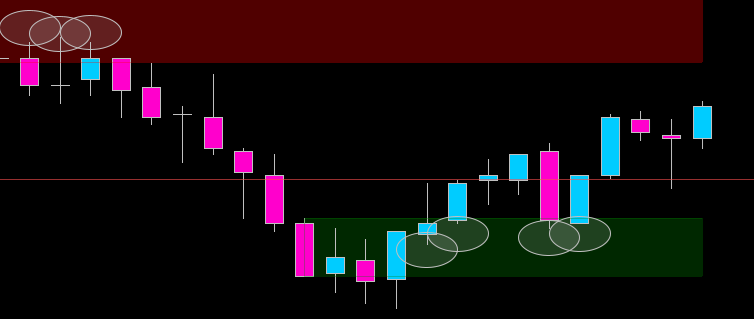
Pour illustrer ma demande, je vous adresse une image dans laquelle j’ai formé des cercles sur les plus hauts et plus bas de bougies se trouvant à l’intérieur d’order blocks.
plus haut dans Order block baissier,
Plus bas dans order block haussier.
L’histogramme demandé devrait réagir de la même manière.
J’espère que ma demande est assez claire.
Merci d’avance pour votre aide.
Hola
Aquí lo tienes:
// Sonarlabs - Order Block Finder
// converted from TradingView
// Lower the sensitivity to show more order blocks. A higher sensitivity will show less order blocks

defparam drawonlastbaronly=true

Transparency = 80

sens = 0

once obcreatedbear = 0
once obcreatedbull = 0
once crossindexbear = 0
once crossindexbull = 0


// Custom Rate of Change (ROC) calculation. This is to calculate high momentum moves in the market.
pc = ((open - open[4]) / open[4]) * 100


// -----------------
sens = sens/100 //ExponentialAverage[8](pc) //sens/100
OBBullMitigation = close[1]
OBBearMitigation = close[1]


// If the ROC crossover our Sensitivty input - Then create a Bearish Order Block
// Sensitivty is negative as this is a Bearish OB
if pc crosses under -sens then
obcreatedbear = 1
crossindexbear = barindex
endif


// If the ROC crossover our Sensitivty input - Then create a Bullish Order Block
if pc crosses over sens then
obcreatedbull = 1
crossindexbull = barindex
endif


////////////////////////////////////////////////////////////////////////////////////////////////////////////////
//      Calculation
////////////////////////////////////////////////////////////////////////////////////////////////////////////////

// -------------------------------
// Bearish OB Creation
// -------------------------------
// Check if we should create a OB. Also check if we haven't created an OB in the last 5 candles.
if obcreatedbear and (crossindexbear - crossindexbear[1]) > 5 then
lastgreen = 0
hhighest = 0
// Loop through the most recent candles and find the first GREEN (Bullish) candle. We will place our OB here.
for i = 4 to 15
if close[i] > open[i] then
lastgreen = i
//populate the arrays of order block to draw them later
$left[plot]= barindex[lastgreen]
$top[plot]=high[lastgreen]
$bottom[plot]=low[lastgreen]
$right[plot]=barindex[lastgreen]
plot=plot+1 //increase the array column for next data
break
endif
next
endif


// -------------------------------
// Bullish OB Creation
// -------------------------------
// Check if we should create a OB, Also check if we haven't created an OB in the last 5 candles.
if obcreatedbull and (crossindexbull - crossindexbull[1]) > 5 then
lastred = 0
hhighest = 0
// Loop through the most recent candles and find the first RED (Beaarish) candle. We will place our OB here.
for ibull = 4 to 15
if close[ibull] < open[ibull] then
lastred = ibull
//populate the arrays of order block to draw them later
$leftbull[plotbull]= barindex[lastred]
$topbull[plotbull]=high[lastred]
$bottombull[plotbull]=low[lastred]
$rightbull[plotbull]=barindex[lastred]
plotbull=plotbull+1 //increase the array column for next data
break
endif
next
endif


////////////////////////////////////////////////////////////////////////////////////////////////////////////////
//      Cleanup
////////////////////////////////////////////////////////////////////////////////////////////////////////////////

//Clean up Bearish OB boxes
if plot>0 then
for j = plot-1 downto 0 //0 to plot-1
// If the two last closes are above the high of the bearish OB - Remove the OB
if $left[j]>0 then //check if the zone still exist
itop = $top[j]
breakout = summation[max(1,barindex-$left[j])](OBBearMitigation>itop)>=1 //2
if breakout then
$left[j]=0
endif
endif
next
endif
//Clean up Bullish OB boxes
if plotbull>0 then
for jbull = plotbull-1 downto 0 //0 to plotbull-1
// If the two last closes are below the low of the bullish OB - Remove the OB
if $leftbull[jbull]>0 then //check if the zone still exist
ibot = $bottombull[jbull]
breakoutbull = summation[max(1,barindex-$leftbull[jbull])](OBBullMitigation<ibot)>=1
if breakoutbull then
$leftbull[jbull]=0
endif
endif
next
endif

////////////////////////////////////////////////////////////////////////////////////////////////////////////////
//     Drawing
////////////////////////////////////////////////////////////////////////////////////////////////////////////////
if islastbarupdate then
//plot the Bearish boxes
if  plot>0 then //islastbarupdate and
for j = plot-1 downto 0 //0 to plot-1
if $left[j]>0 then
//drawrectangle($left[j],$top[j],barindex,$bottom[max(0,j)]) coloured("red",Transparency)bordercolor("red",Transparency)
for k=0 to barindex do
if barindex[k]>$left[max(0,j)] and high[k] > $bottom[max(0,j)] and high[k]<$top[max(0,j)] then
drawrectangle(barindex[k],0,barindex[k],-1)coloured("red")
endif
next
endif
next
endif
//plot the Bullish boxes
if  plotbull>0 then //islastbarupdate and
for jbull = plotbull-1 downto 0 //0 to plotbull-1
if $leftbull[jbull]>0 then
//drawrectangle($leftbull[jbull],$bottombull[jbull],barindex,$topbull[jbull]) coloured("green",Transparency)bordercolor("green",Transparency)
for i=0 to barindex do
if barindex[i]>$leftbull[max(0,jbull)] and low[i] < $topbull[max(0,jbull)] and low[i]>$bottombull[max(0,jbull)] then
drawrectangle(barindex[i],0,barindex[i],1)coloured("green")
endif
next
endif
next
endif
endif

return
Ce qui serait intéressant ce serait de pouvoir mettre des alertes à chaque nouvel histogramme ☺
mais surtout à chaque nouveau block
@Arlequin49.
Un order block met plusieurs bougies à être confirmé. Il faut être prudent quand on veut entrer à la création… un OB peut parfaitement s’inverser et disparaître. Ceci dit on peut parfaitement paramétrer alertes et screeners avec cet indicateur
@Ivan
Super travail, merci beaucoup !
@ivan
suite à ton super travail sur le code, peux-tu me dire comment créer un screener de détection lorsque l’histogramme est = à 1 et =à-1 ?
comme ça:
sens = 0
once obcreatedbear = 0
once obcreatedbull = 0
once crossindexbear = 0
once crossindexbull = 0
// Custom Rate of Change (ROC) calculation. This is to calculate high momentum moves in the market.
pc = ((open - open[4]) / open[4]) * 100
// -----------------
sens = sens/100 //ExponentialAverage[8](pc) //sens/100
OBBullMitigation = close[1]
OBBearMitigation = close[1]
// If the ROC crossover our Sensitivty input - Then create a Bearish Order Block
// Sensitivty is negative as this is a Bearish OB
if pc crosses under -sens then
obcreatedbear = 1
crossindexbear = barindex
endif
// If the ROC crossover our Sensitivty input - Then create a Bullish Order Block
if pc crosses over sens then
obcreatedbull = 1
crossindexbull = barindex
endif
////////////////////////////////////////////////////////////////////////////////////////////////////////////////
//      Calculation
////////////////////////////////////////////////////////////////////////////////////////////////////////////////
// -------------------------------
// Bearish OB Creation
// -------------------------------
// Check if we should create a OB. Also check if we haven't created an OB in the last 5 candles.
if obcreatedbear and (crossindexbear - crossindexbear[1]) > 5 then
lastgreen = 0
// Loop through the most recent candles and find the first GREEN (Bullish) candle. We will place our OB here.
for i = 4 to 15
if close[i] > open[i] then
lastgreen = i
//populate the arrays of order block to draw them later
$left[plot]= barindex[lastgreen]
$top[plot]=high[lastgreen]
$bottom[plot]=low[lastgreen]
$right[plot]=barindex[lastgreen]
plot=plot+1 //increase the array column for next data
break
endif
next
endif
// -------------------------------
// Bullish OB Creation
// -------------------------------
// Check if we should create a OB, Also check if we haven't created an OB in the last 5 candles.
if obcreatedbull and (crossindexbull - crossindexbull[1]) > 5 then
lastred = 0
// Loop through the most recent candles and find the first RED (Beaarish) candle. We will place our OB here.
for ibull = 4 to 15
if close[ibull] < open[ibull] then
lastred = ibull
//populate the arrays of order block to draw them later
$leftbull[plotbull]= barindex[lastred]
$topbull[plotbull]=high[lastred]
$bottombull[plotbull]=low[lastred]
$rightbull[plotbull]=barindex[lastred]
plotbull=plotbull+1 //increase the array column for next data
break
endif
next
endif
////////////////////////////////////////////////////////////////////////////////////////////////////////////////
//      Cleanup
////////////////////////////////////////////////////////////////////////////////////////////////////////////////
//Clean up Bearish OB boxes
if plot>0 then
for j = plot-1 downto 0 //0 to plot-1
// If the two last closes are above the high of the bearish OB - Remove the OB
if $left[j]>0 then //check if the zone still exist
itop = $top[j]
breakout = summation[max(1,barindex-$left[j])](OBBearMitigation>itop)>=1 //2
if breakout then
$left[j]=0
endif
endif
next
endif
//Clean up Bullish OB boxes
if plotbull>0 then
for jbull = plotbull-1 downto 0 //0 to plotbull-1
// If the two last closes are below the low of the bullish OB - Remove the OB
if $leftbull[jbull]>0 then //check if the zone still exist
ibot = $bottombull[jbull]
breakoutbull = summation[max(1,barindex-$leftbull[jbull])](OBBullMitigation<ibot)>=1
if breakoutbull then
$leftbull[jbull]=0
endif
endif
next
endif
////////////////////////////////////////////////////////////////////////////////////////////////////////////////
//     Drawing
////////////////////////////////////////////////////////////////////////////////////////////////////////////////
if islastbarupdate then
//plot the Bearish boxes
if  plot>0 then //islastbarupdate and
for j = plot-1 downto 0 //0 to plot-1
if $left[j]>0 then
//drawrectangle($left[j],$top[j],barindex,$bottom[max(0,j)]) coloured("red",Transparency)bordercolor("red",Transparency)
if barindex>$left[max(0,j)] and high > $bottom[max(0,j)] and high<$top[max(0,j)] then
signal=-1
else
signal=0
endif
endif
next
endif
//plot the Bullish boxes
if  plotbull>0 then //islastbarupdate and
for jbull = plotbull-1 downto 0 //0 to plotbull-1
if $leftbull[jbull]>0 then
if barindex>$leftbull[max(0,jbull)] and low < $topbull[max(0,jbull)] and low>$bottombull[max(0,jbull)] then
signalbull=1
else
signalbull=0
endif
endif
next
endif
endif

screener[signal or signalbull](signal as "SignalBear",signalbull as "SignalBull")
Bonjour @Ivan,
Je regarde ce screener ainsi que l’indicateur que tu as créé plus tôt. J’essaye de créer une version de l’indicateur avec un format histogramme.. afin de pouvoir créer des alertes.
Mais en version histogramme, j’obtiens un indicateur qui ne commence à fonctionner que sur la bar actuelle, avant c’est à0.
Bref, saurais-tu modificer l’indicateur, le mettre en format histogramme renvoyant une valeur +1 / -1 / 0… et lorsqu’on ajoute l’indicateur on voit son comportement dans le passé immédiatement…
Je parle de transformer cet indicateur (ci-dessous)
// Sonarlabs - Order Block Finder
// converted from TradingView
// Lower the sensitivity to show more order blocks. A higher sensitivity will show less order blocks

defparam drawonlastbaronly=true

Transparency = 80

sens = 0

once obcreatedbear = 0
once obcreatedbull = 0
once crossindexbear = 0
once crossindexbull = 0


// Custom Rate of Change (ROC) calculation. This is to calculate high momentum moves in the market.
pc = ((open - open[4]) / open[4]) * 100


// -----------------
sens = sens/100 //ExponentialAverage[8](pc) //sens/100
OBBullMitigation = close[1]
OBBearMitigation = close[1]


// If the ROC crossover our Sensitivty input - Then create a Bearish Order Block
// Sensitivty is negative as this is a Bearish OB
if pc crosses under -sens then
obcreatedbear = 1
crossindexbear = barindex
endif


// If the ROC crossover our Sensitivty input - Then create a Bullish Order Block
if pc crosses over sens then
obcreatedbull = 1
crossindexbull = barindex
endif


////////////////////////////////////////////////////////////////////////////////////////////////////////////////
//      Calculation
////////////////////////////////////////////////////////////////////////////////////////////////////////////////

// -------------------------------
// Bearish OB Creation
// -------------------------------
// Check if we should create a OB. Also check if we haven't created an OB in the last 5 candles.
if obcreatedbear and (crossindexbear - crossindexbear[1]) > 5 then
lastgreen = 0
hhighest = 0
// Loop through the most recent candles and find the first GREEN (Bullish) candle. We will place our OB here.
for i = 4 to 15
if close[i] > open[i] then
lastgreen = i
//populate the arrays of order block to draw them later
$left[plot]= barindex[lastgreen]
$top[plot]=high[lastgreen]
$bottom[plot]=low[lastgreen]
$right[plot]=barindex[lastgreen]
plot=plot+1 //increase the array column for next data
break
endif
next
endif


// -------------------------------
// Bullish OB Creation
// -------------------------------
// Check if we should create a OB, Also check if we haven't created an OB in the last 5 candles.
if obcreatedbull and (crossindexbull - crossindexbull[1]) > 5 then
lastred = 0
hhighest = 0
// Loop through the most recent candles and find the first RED (Beaarish) candle. We will place our OB here.
for ibull = 4 to 15
if close[ibull] < open[ibull] then
lastred = ibull
//populate the arrays of order block to draw them later
$leftbull[plotbull]= barindex[lastred]
$topbull[plotbull]=high[lastred]
$bottombull[plotbull]=low[lastred]
$rightbull[plotbull]=barindex[lastred]
plotbull=plotbull+1 //increase the array column for next data
break
endif
next
endif


////////////////////////////////////////////////////////////////////////////////////////////////////////////////
//      Cleanup
////////////////////////////////////////////////////////////////////////////////////////////////////////////////

//Clean up Bearish OB boxes
if plot>0 then
for j = plot-1 downto 0 //0 to plot-1
// If the two last closes are above the high of the bearish OB - Remove the OB
if $left[j]>0 then //check if the zone still exist
itop = $top[j]
breakout = summation[max(1,barindex-$left[j])](OBBearMitigation>itop)>=1 //2
if breakout then
$left[j]=0
endif
endif
next
endif
//Clean up Bullish OB boxes
if plotbull>0 then
for jbull = plotbull-1 downto 0 //0 to plotbull-1
// If the two last closes are below the low of the bullish OB - Remove the OB
if $leftbull[jbull]>0 then //check if the zone still exist
ibot = $bottombull[jbull]
breakoutbull = summation[max(1,barindex-$leftbull[jbull])](OBBullMitigation<ibot)>=1
if breakoutbull then
$leftbull[jbull]=0
endif
endif
next
endif

////////////////////////////////////////////////////////////////////////////////////////////////////////////////
//     Drawing
////////////////////////////////////////////////////////////////////////////////////////////////////////////////
if islastbarupdate then
//plot the Bearish boxes
if  plot>0 then //islastbarupdate and
for j = plot-1 downto 0 //0 to plot-1
if $left[j]>0 then
//drawrectangle($left[j],$top[j],barindex,$bottom[max(0,j)]) coloured("red",Transparency)bordercolor("red",Transparency)
for k=0 to barindex do
if barindex[k]>$left[max(0,j)] and high[k] > $bottom[max(0,j)] and high[k]<$top[max(0,j)] then
drawrectangle(barindex[k],0,barindex[k],-1)coloured("red")
endif
next
endif
next
endif
//plot the Bullish boxes
if  plotbull>0 then //islastbarupdate and
for jbull = plotbull-1 downto 0 //0 to plotbull-1
if $leftbull[jbull]>0 then
//drawrectangle($leftbull[jbull],$bottombull[jbull],barindex,$topbull[jbull]) coloured("green",Transparency)bordercolor("green",Transparency)
for i=0 to barindex do
if barindex[i]>$leftbull[max(0,jbull)] and low[i] < $topbull[max(0,jbull)] and low[i]>$bottombull[max(0,jbull)] then
drawrectangle(barindex[i],0,barindex[i],1)coloured("green")
endif
next
endif
next
endif
endif

return
Bonjour. Il faut prendre en compte la ligne suivante : defparam drawonlastbaronly=true Et la partie du code avec le if islastbarupdate then