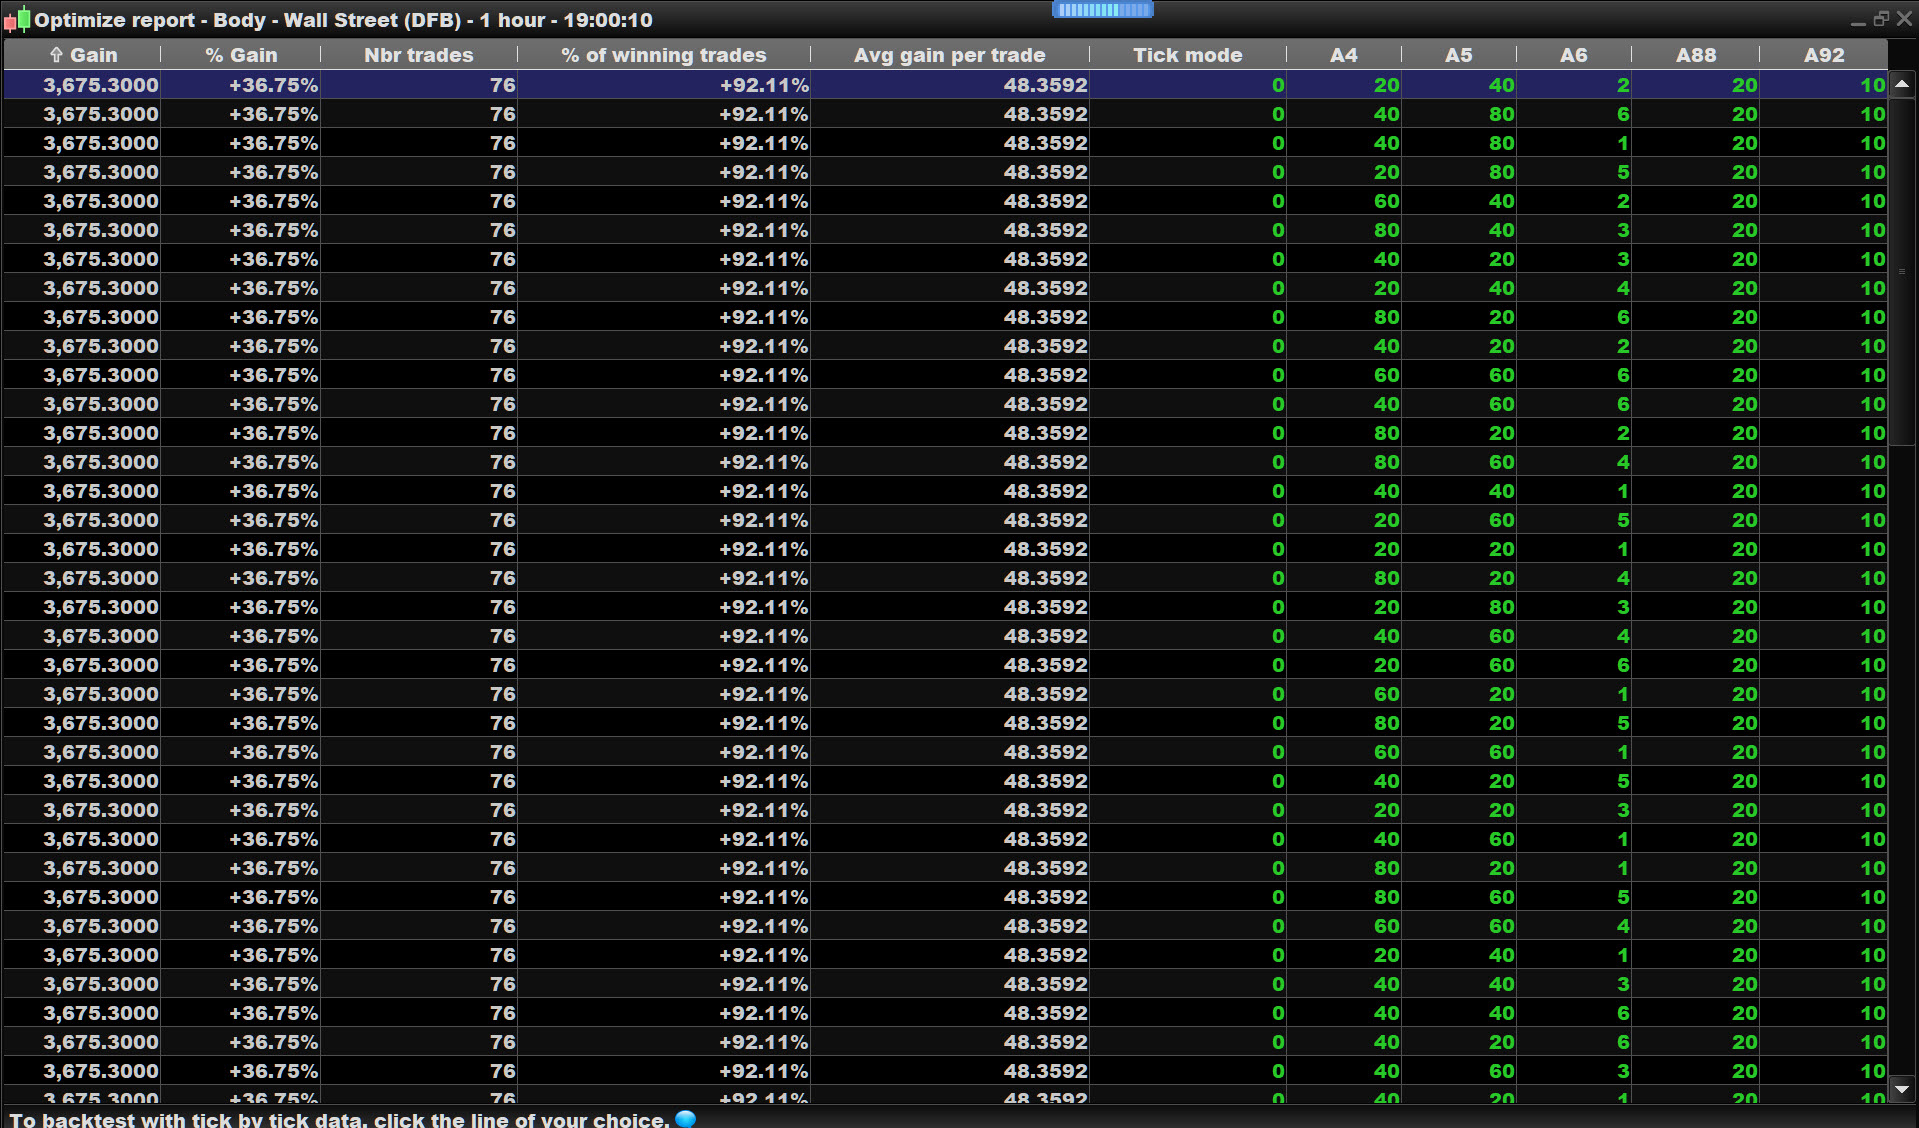
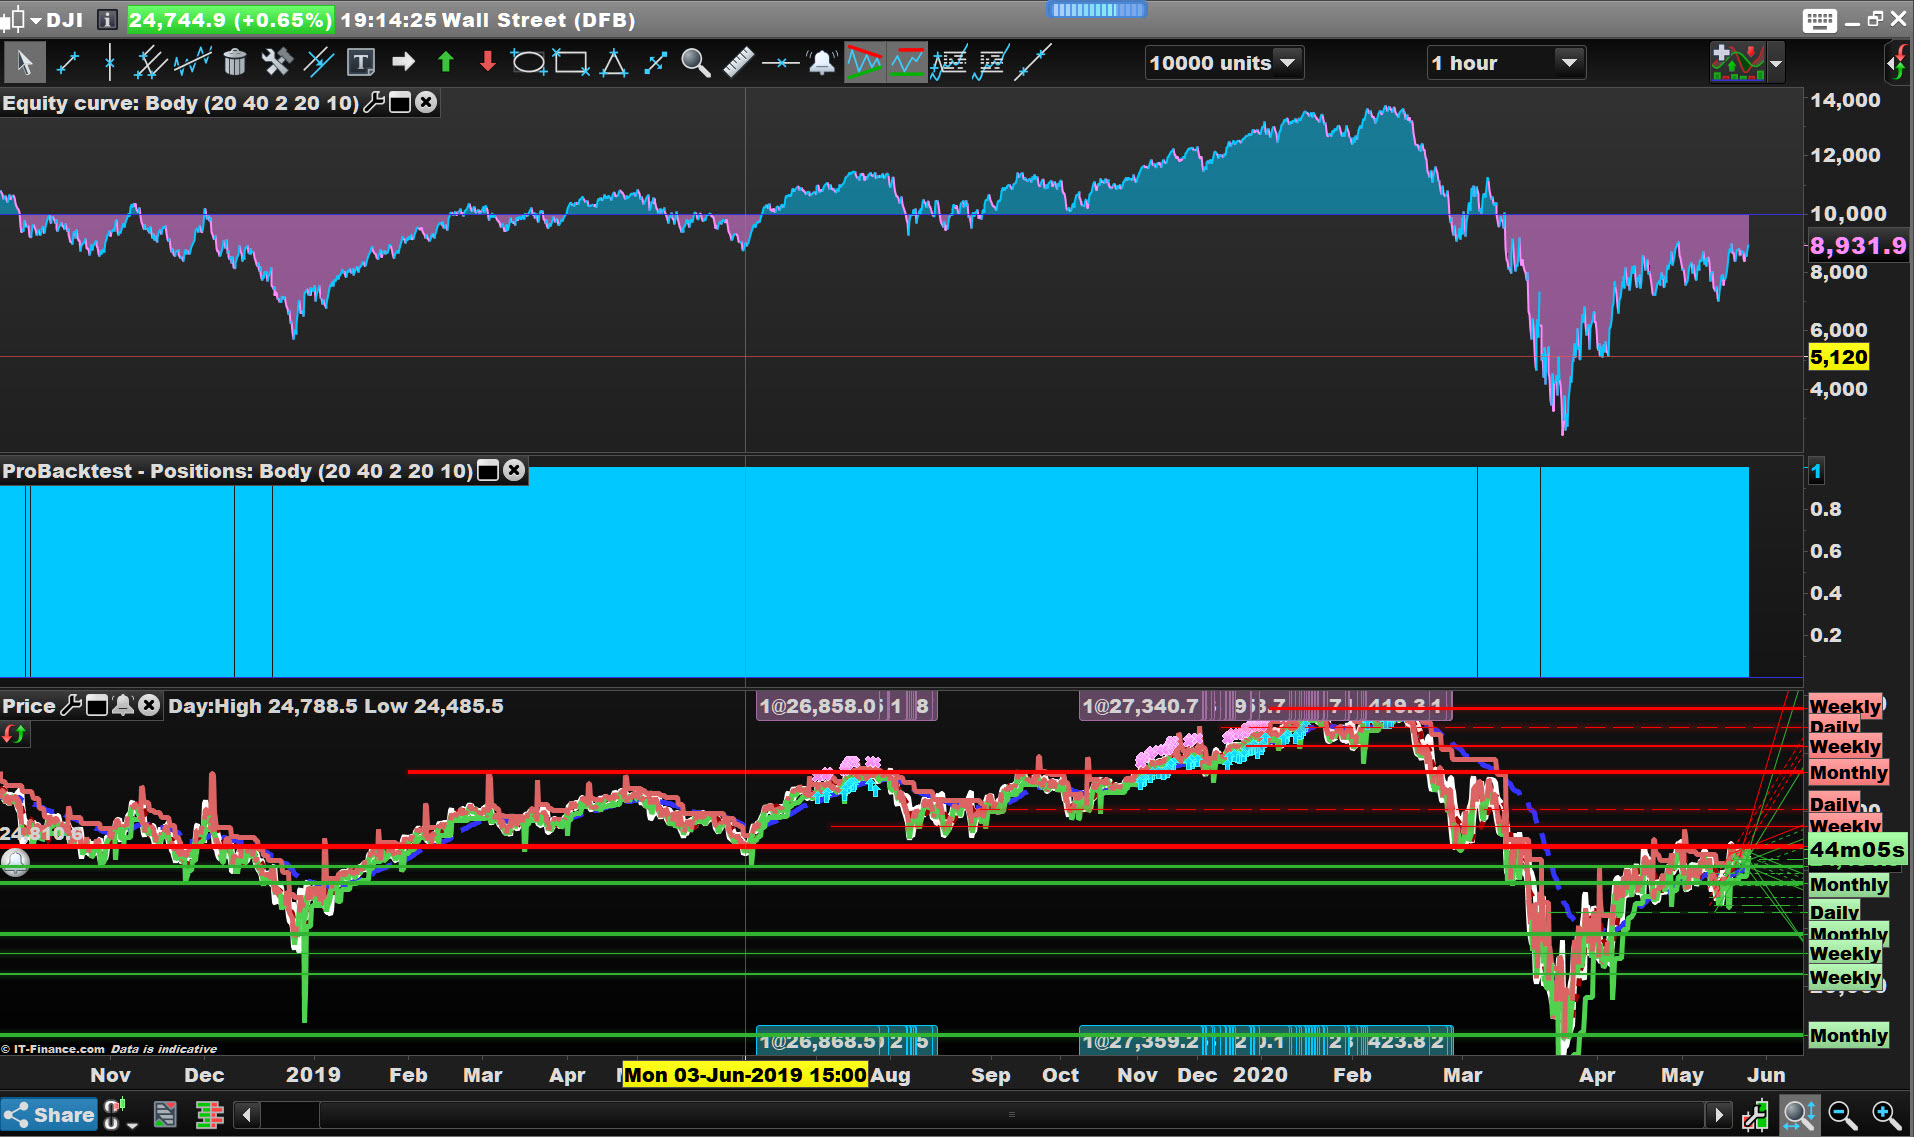
Anybody any ideas how / why the attached backtest results and Detailed Report bear no resemblance to the equity curve attached when I click on a row in the Backtest results Table??
Spread = 4
DEFPARAM CUMULATEORDERS = False
//CandleStick Analysis Tool
//
CloseLevel = A4 //Close price as % of Range
BodyLevel = A5 //Total body size as % of Range
ATRPeriod = A6 //Period to be used for ATR Rising filter
Spread = 4 //Spread for market being analysed
ATROn = 0 //Tick to apply ATRRising filter within analyse
//
//CandleStick Analysis Tool can be used to analyse the effect that candlestick bodysize and close position within range has on the next candle closing in the same direction. An AverageTrue Range filter can also be applied to analyse the benefits or disadvantage of this. The Equity +/- is calculated on close of position after one candle. Spread is deducted from each position.

//Average True Range Calculation
ATR = AveragetrueRange[ATRPeriod]
ATRRising = ATR[1] < ATR

//Body % Calculation
BodyPerc = ((ABS(close[1] - open[1]))/(High[1]-Low[1]))*100

//Close % Calculation
IF close[1] > Open[1] THEN
ClosePerc = ((Close[1] - Low[1])/(High[1] - Low[1]))*100
ENDIF

IF close[1] < Open[1] THEN
ClosePerc = ((High[1] - Close[1])/(High[1] - Low[1]))*100
ENDIF

//Analysis including ATR Filter
IF ATROn THEN
//Up Candle followed by Up Candle
IF BodyPerc > BodyLevel and close[1] > open[1] and close > close[1] and ClosePerc > CloseLevel and ATRRising THEN
Win = Win + 1
Count = Count + 1
Amount = Amount + ((Close - close[1])-Spread)
ENDIF

//Up Candle followed by Down Candle
IF BodyPerc > BodyLevel and close[1] > open[1] and close < close[1] and ClosePerc > CloseLevel and ATRRising THEN
Count = Count + 1
Amount = Amount - ((Close[1] - close)+Spread)
ENDIF

//Down Candle followed by Down Candle
IF BodyPerc > BodyLevel and close[1] < open[1] and close < close[1] and ClosePerc > CloseLevel and ATRRising THEN
Win = Win + 1
Count = Count + 1
Amount = Amount + ((Close[1] - close)-Spread)
ENDIF

//Down Candle followed by Up Candle
IF BodyPerc > BodyLevel and close[1] < open[1] and close > close[1] and ClosePerc > CloseLevel and ATRRising THEN
Count = Count + 1
Amount = Amount - ((Close - close[1])+Spread)
ENDIF

//Analysis without ATR Filter
ELSE
//Up Candle followed by Up Candle
IF BodyPerc > BodyLevel and close[1] > open[1] and close > close[1] and ClosePerc > CloseLevel THEN
Win = Win + 1
Count = Count + 1
Amount = Amount + ((Close - close[1])-Spread)
ENDIF

//Up Candle followed by Down Candle
IF BodyPerc > BodyLevel and close[1] > open[1] and close < close[1] and ClosePerc > CloseLevel THEN
Count = Count + 1
Amount = Amount - ((Close[1] - close)+Spread)
ENDIF

//Down Candle followed by Down Candle
IF BodyPerc > BodyLevel and close[1] < open[1] and close < close[1] and ClosePerc > CloseLevel THEN
Win = Win + 1
Count = Count + 1
Amount = Amount + ((Close[1] - close)-Spread)
ENDIF

//Down Candle followed by Up Candle
IF BodyPerc > BodyLevel and close[1] < open[1] and close > close[1] and ClosePerc > CloseLevel THEN
Count = Count + 1
Amount = Amount - ((Close - close[1])+Spread)
ENDIF
ENDIF

//Win Rate as %
WinRate = (Win/Count) * 100

If WinRate > A88 Then
Buy at Market
Endif

If longonmarket and barindex > Tradeindex + A92 and positionperf > 0 Then
Sell at market
endif

//Return WinRate coloured (0,0,0) Style(Line,2) as "Win Rate", Win coloured (0,255,0) Style(Line,1) as "Wins", Count coloured (255,0,0) Style(Line,1) as "Bets", Amount coloured (0,0,255) Style(Line,1) as "Equity +/-"
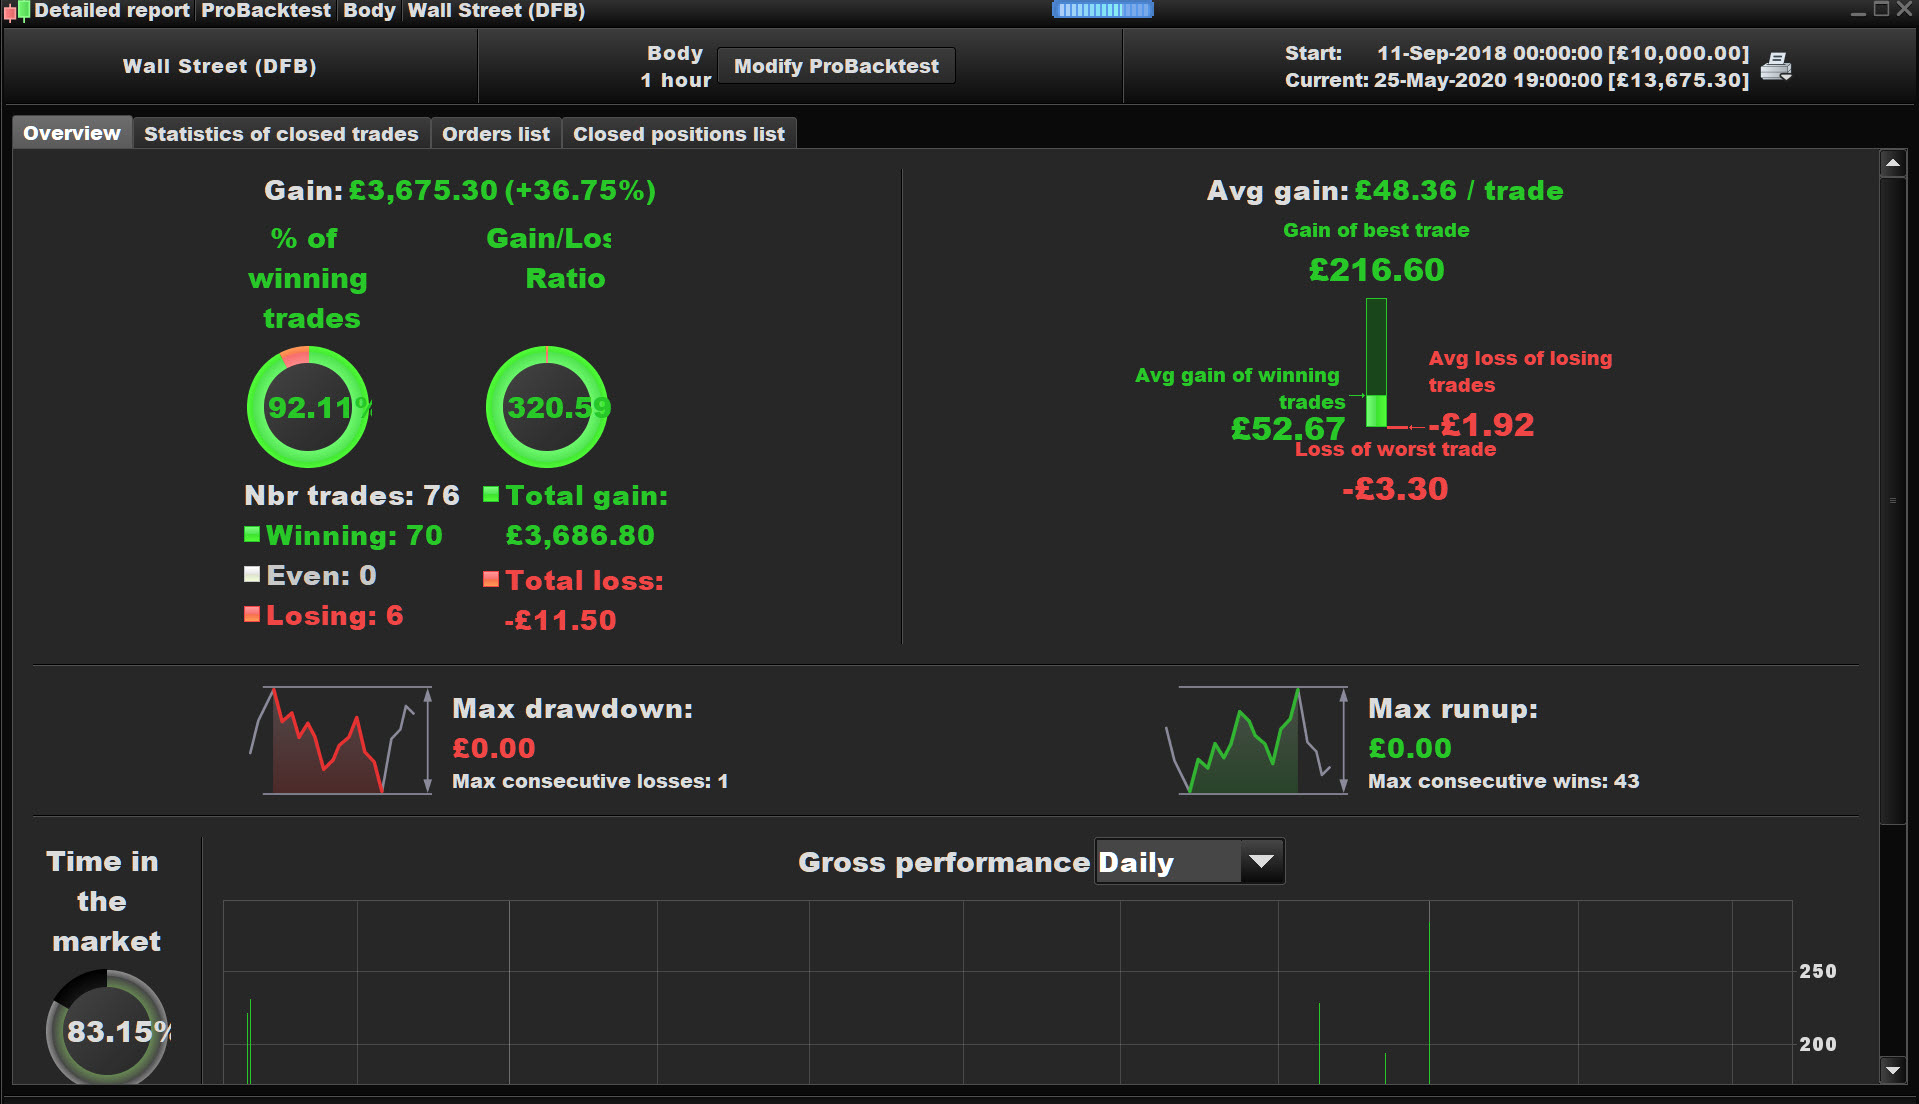
In what way different? If there is a trade still open then the equity curve will be different to the results report as that trade is not included in the results report but is shown on the equity curve.
Just testing!! 🙂 🙂
I thought you might come up with the answer!!
Cheers
Is it a tick by tick issue? How can the total loss be £11.50 but in April the equity dips below £4000?
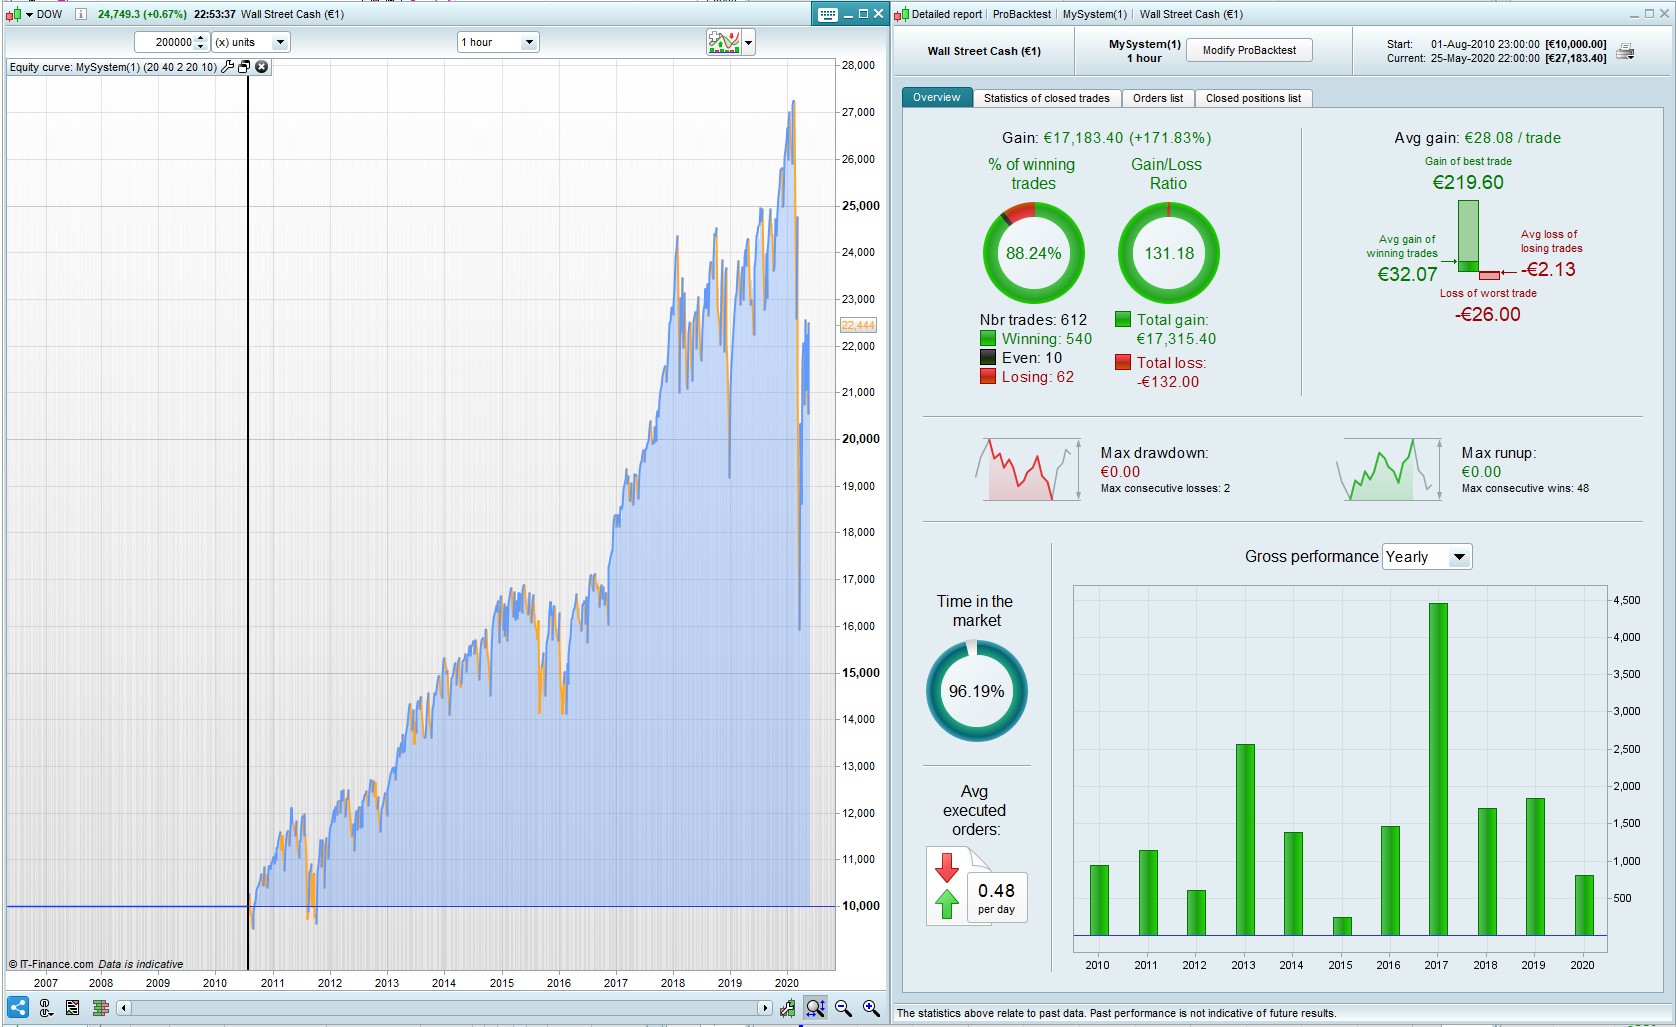
This is what I get with those values.
Is it a tick by tick issue?
No it wasn’t tick by tick not enabled.
Your test was over 200k bars and so your equity curve looks well different to mine.
Sort trades by max Number of bars and check the MAE … just shows that if we have deep enough pockets and sit it out … then we could be Warren Buffet also!!?? 🙂
(I was feeling a bit rough yesterday, hence me putting the conundrum on here rather than thinking it out, but after Vonasi gave the reason I recalled that the same scenario had tripped me up in the past!
Note to Self – a Live Trade does NOT show in backtest results but live trades DO show on the equity curve)