Hey guys!
Would be fun to see your guys detail report on ur live strategies, or from ur demos, in total so it’s nice to compare and see how active ur guys strategies are when combined, etc.
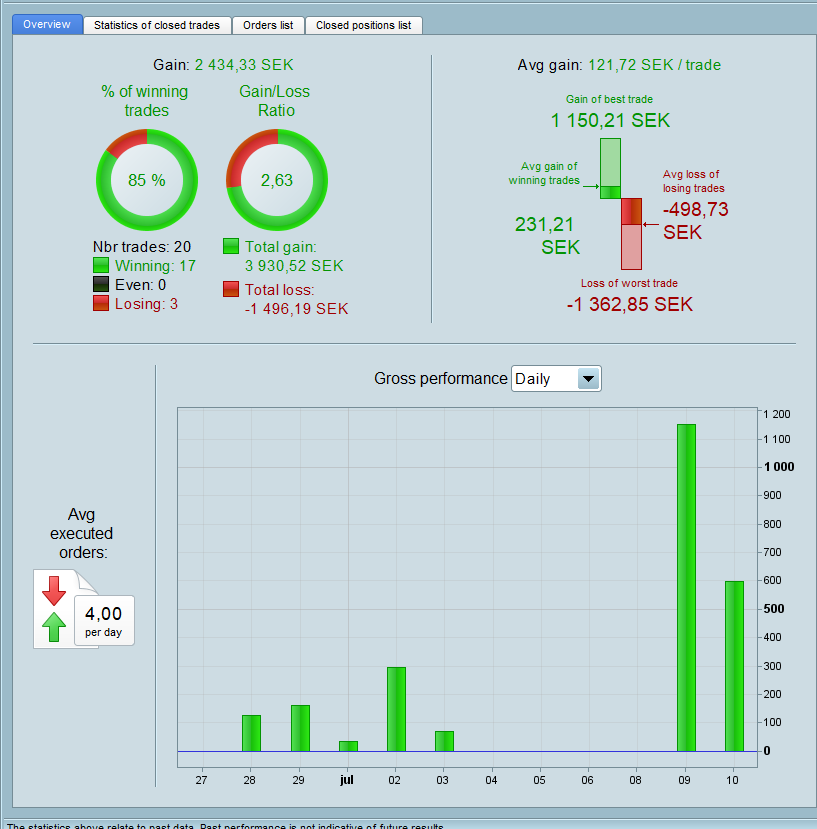
Here are my results that have been going for a few weeks 🙂
Looks good and a good idea!
How many Systems are your results for?
I take it your results are from 27 June?
For meaningful comparison I guess we should all use the same period … from 27 June … although the options to select are 1 day, 1 week, 1 month, 1 year??
One of my demo accounts doesn’t seem to understand the rule ‘Sell in May and go away’.
[attachment file=75761]
Ha nice one Vonasi, what Lot size is that for?
You could of course share the code and then I can also see if … Sell in May and Go Away, Come back on St Ledger Day … really is old fashioned bunkum!!?? 🙂
Ha nice one Vonasi, what Lot size is that for?
You could of course share the code and then I can also see if … Sell in May and Go Away, Come back on St Ledger Day … really is old fashioned bunkum!!?? 
That is for 25 strategies running in demo all starting with 0.5 or 1 or whatever the minimum for the instrument is. One or two have money management turned on but positions size has only been increased by about 1% so far on those. Mainly daily end of day strategies, the odd weekly and one or two on 1 hr or 15 min. There has not been 25 running all the time and slowly the bad ones have been killed off and the good ones allowed to continue trading. So hopefully the graph tells me I might actually be heading in the right direction with my ideas – so I guess it is more about me than going away in May!
This is 8 systems running 🙂
I have been concentrating a lot on the DJI this year so thought I would see how my demo strategies have been doing on just that index. Looking pretty good even if I do say so myself…. and there is some more small profit on another account to add to the total that is not included in this graph. Time to sift through and maybe put some of them live I think.
[attachment file=75851]
Looking Good Vonasi!
Well Done, bet you’re chuffed with Yourself!?
You’ll be looking at bigger Yachts at this rate!! 🙂
If you log into your ‘My IG’ then you can click on ‘History’ and then change the transactions type to ‘P&L Breakdown(DFB’s)’ and then click download and you can get an Excel report of the true profit and loss of each trade including fees over any chosen period. A quick ‘autosum’ and you can see how you have been truly performing rather than the PRT results which do not include any fees.
I have attached my results from the last 90 days on two of my demo accounts. I cut and pasted the two reports together to see the combined totals.
This is up to 50 strategies running at any one time – but not all of them have opened positions yet. Strategies have been removed and replaced with others as time has gone on if they failed to perform as expected but the results of the failed strategies are still in this report. At a couple of points I put in the odd strategy coded by someone else on this forum but only one remains now and that has only broken even!
I’m quite happy with the £9979.60 overall profit after fees in 90 days on 413 trades with an average position size of 1.18. I’m mainly a daily and weekly strategy trader now and so the -£3.46 average per trade for fees is quite reasonable I think.
Some of the strategies are what I would classify as high risk strategies that I would hesitate to put live without a very big starting capital but in amongst them are some medium risk gems that have now had a couple of months of forward testing and may be going live soon after a final check over.
Here is the complete report if anyone is interested (I removed any of the columns with zero values or buy and sell prices etc to make it more readable):
[attachment file=”TradeBreakDown-(29-04-2018_0944)-(28-07-2018_0944).xlsx”]
Edit: I just checked and there were 286 winning trades and 127 losing trades and so the win rate was 69.25% over the 90 days.
thats some gg results vonasi