Bonjour,
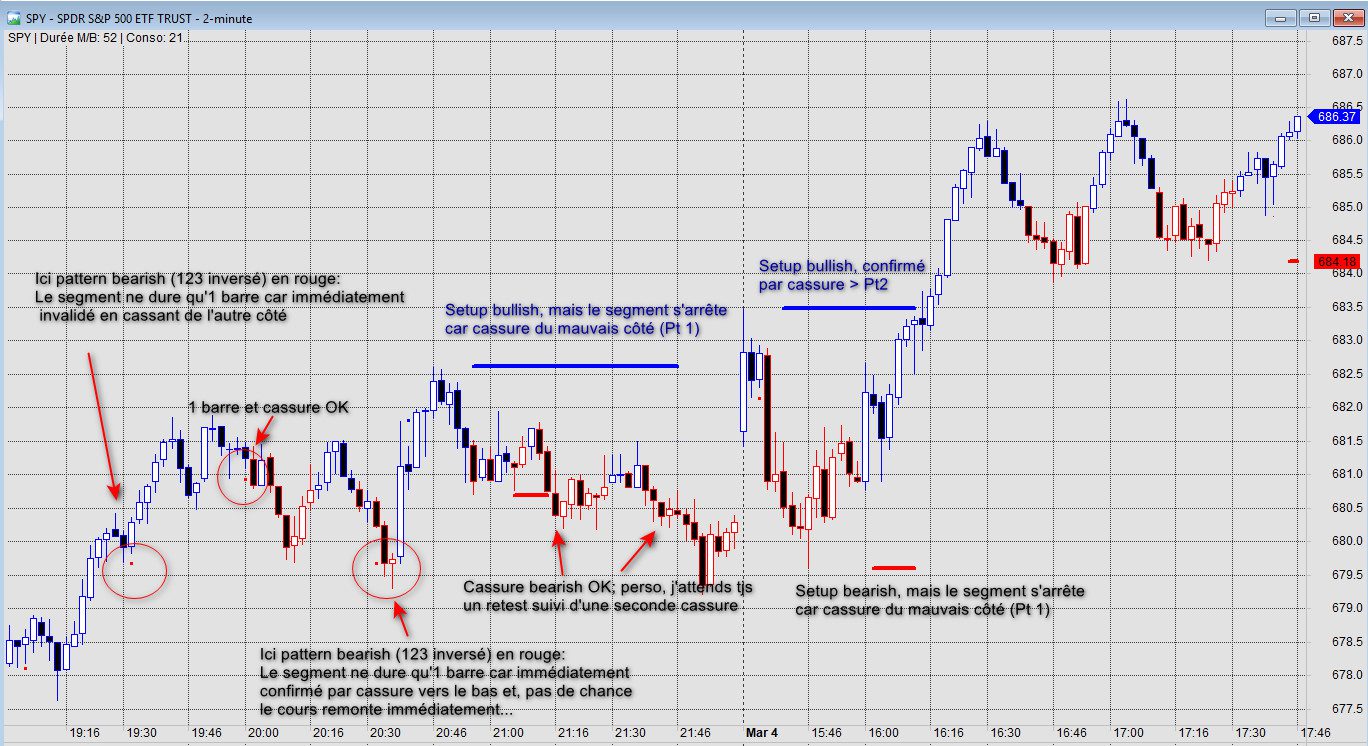
J’ai créé un indicateur sur AFL (Amibroker) pour m’aider à voir immédiatement sur mon graphique une formation que j’utilise très souvent, mais après de multiples essais, impossible de convertir vers prorealcode. La formation de base est le très connu “123” qui, dans mon exemple, part d’un Low local. Mais qui a une condition particulière qui m’a personnellement permis de filtrer les 123 moins intéressant: le nombre de barres entre le point 2 (Pt2) de la formation (donc le high après le Low Pt1), et la cassure du high du cours au-dessus du high du Pt2 doit comporter au moins autant de barres qu’entre le Pt1 et le Pt2. Attention que le Pt3 (low après Pt2) n’intervient pas, on parle du nombre de barres depuis Pt2 jusqu’à cassure au-dessus de Pt2.
Que voit-on sur le graphique SI les conditions sont remplies?
1. Un segment horizontal démarre au High du Pt2
2. Ce segment, devenu inutile, s’arrête si cassure il y a (High > High de Pt 2) pour ne pas encombrer le graphique
Ces conditions permettent de voir immédiatement les formations à suivre sur le chart; on pourrait facilement y assortir une alerte.
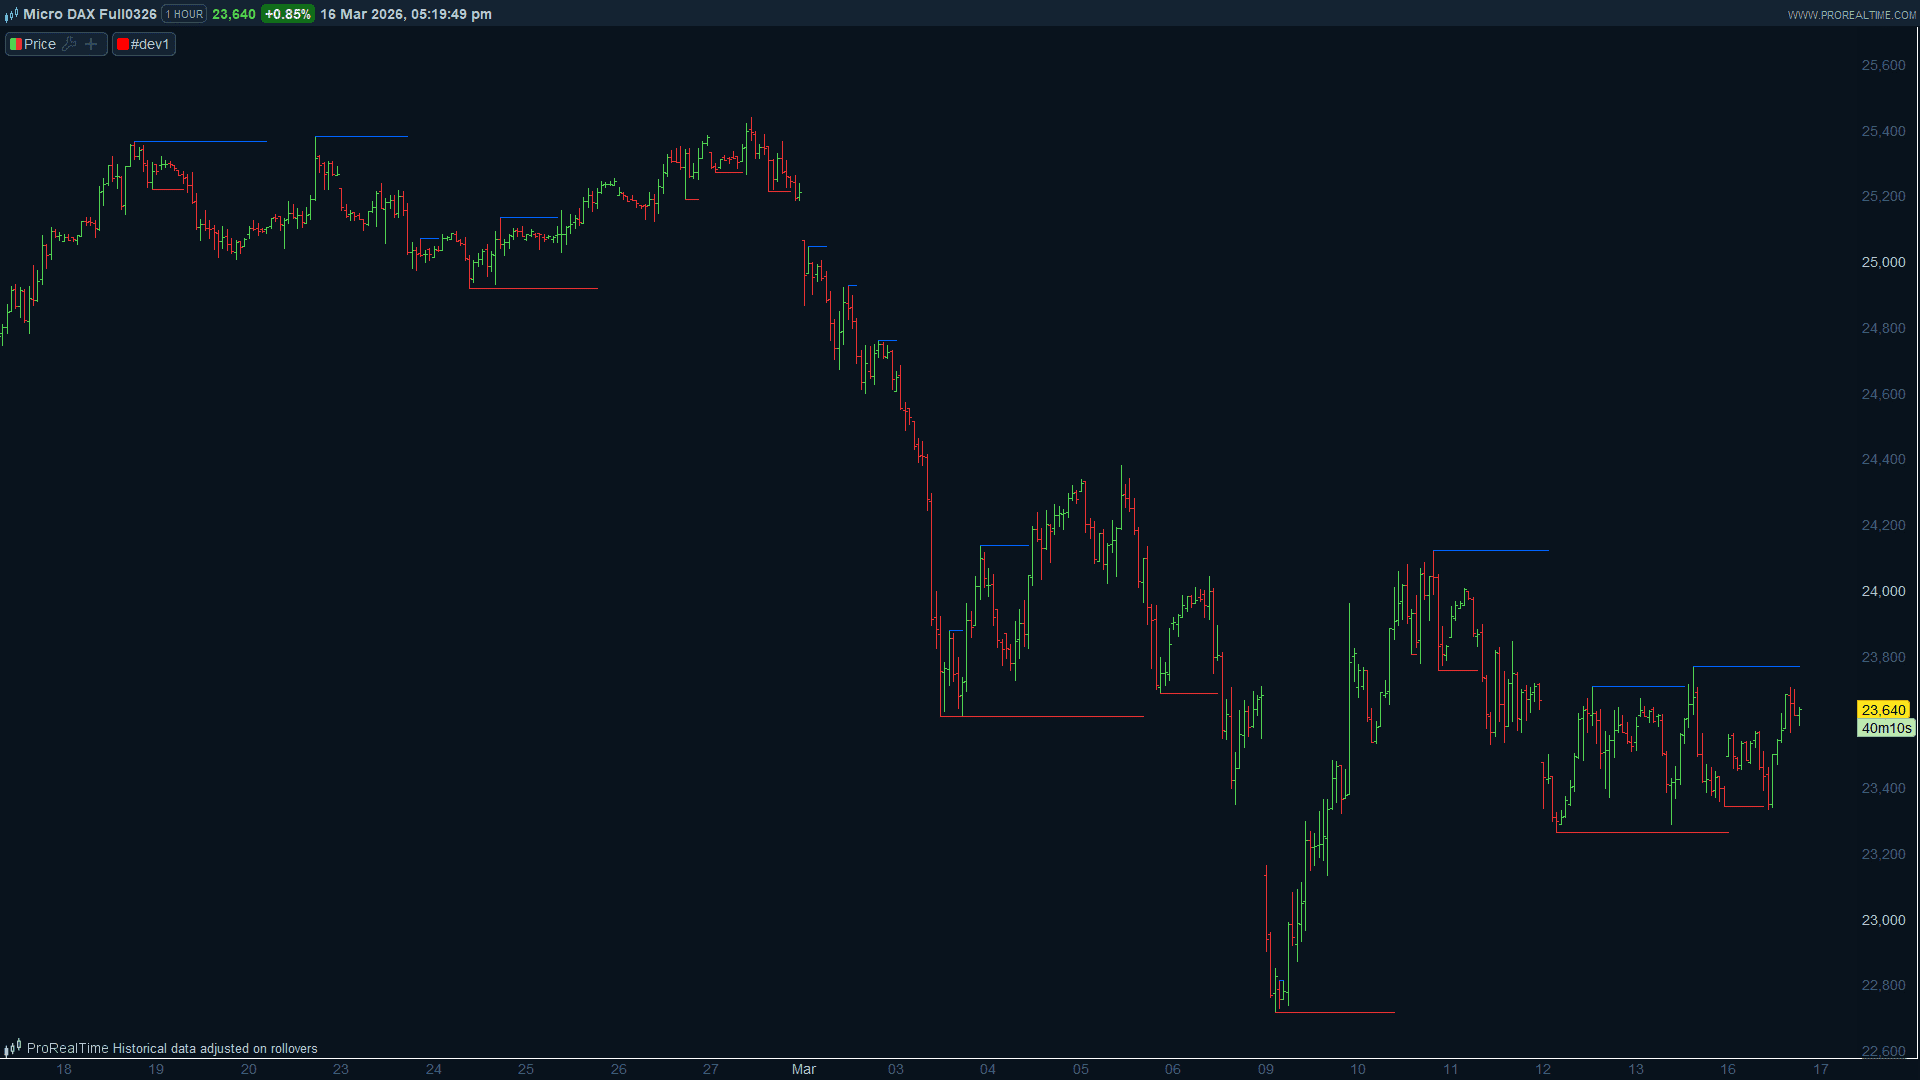
Souci1: mon code ne définit pas TOUS les 123: je suis obligé de le charger 2-3 fois sur le chart en faisant varier la période “lookback”. Je n’ai pas trouvé mieux pour le moment mais, avec 2-3 instances de l’indicateur et en faisant varier l’épaisseur des lignes suivnant le paramètre lookback, ça parle assez bien (voir chart attaché)
Souci2: j’aurais préféré voir le segment horizontal démarrer sur le Pt2, mais dans mon code il ne démarre qu’à la barre où les conditions remplies; mais c’est un souci plus esthétique car le code remplit malgré tout sa mission.
Par contre, j’ai essayé pendant 3 jours complets de le convertir sur PRT, sans succès, et ce, je précise, après avoir requis l’aide de Gemini puis Grok, mais ils se sont plantés…
Toute aide ici sera vraiment très appréciée, et j’espère qu’en retour mon indicateur vous sera utile.
Grand merci d’avance à Nicolas, ou tout autre codeur ingénieux:-)
Carl
Voici le code AFL:
_SECTION_BEGIN(“Setup 123 BRG Long”);
// — 1. PARAMÈTRES DE CONTRÔLE —
Lookback = Param(“Période de recherche (P1)”, 50, 5, 50, 1);
Ratio = Param(“Ratio Temps Conso/Poussée”, 1.0, 0.5, 2.0, 0.1);
// ============================================================================
// LOGIQUE BULLISH (ACHAT) – Recherche d’un creux vers un sommet
// ============================================================================
// A. Détection du Point 1 (Le plus bas sur la période)
P1_Bar_L = L == LLV(L, Lookback);
P1_Price_L = ValueWhen(P1_Bar_L, L);
P1_Idx_L = ValueWhen(P1_Bar_L, BarIndex());
// B. Détection du Point 2 (Le sommet qui suit le P1)
BarsSinceP1_L = BarIndex() – P1_Idx_L;
P2_Price_L = HHV(H, Max(1, BarsSinceP1_L));
P2_Idx_L = ValueWhen(H == P2_Price_L AND BarsSinceP1_L > 0, BarIndex());
// C. Détection du Point 3 (Le creux qui suit le P2)
BarsSinceP2_L = BarIndex() – P2_Idx_L;
P3_Low_L = LLV(L, Max(1, BarsSinceP2_L));
// D. Calcul des Durées
DurMontee_L = P2_Idx_L – P1_Idx_L;
DurConso_L = BarIndex() – P2_Idx_L;
// E. Validation des 3 conditions Bullish
CondP3_L = P3_Low_L > P1_Price_L AND P3_Low_L < P2_Price_L; // P3 doit être entre P1 et P2
CondT_L = DurConso_L >= (Ratio * DurMontee_L) AND DurMontee_L > 0; // Respect du temps de conso
CondInv_L = LLV(L, Max(1, DurConso_L)) >= P1_Price_L AND HHV(H, Max(1, DurConso_L)) <= P2_Price_L; // Pas de cassure prématurée
// F. Affichage Bullish (Bleu)
LigneActive_L = P2_Idx_L > P1_Idx_L AND CondP3_L AND CondT_L AND CondInv_L;
Plot(IIf(LigneActive_L, P2_Price_L, Null), “Résistance P2”, colorBlue, styleLine | styleThick | styleNoRescale,0,0,0,0,3);
// ============================================================================
// LOGIQUE BEARISH (VENTE) – Recherche d’un sommet vers un creux
// ============================================================================
// A. Détection du Point 1 (Le plus haut sur la période)
P1_Bar_S = H == HHV(H, Lookback);
P1_Price_S = ValueWhen(P1_Bar_S, H);
P1_Idx_S = ValueWhen(P1_Bar_S, BarIndex());
// B. Détection du Point 2 (Le creux qui suit le P1)
BarsSinceP1_S = BarIndex() – P1_Idx_S;
P2_Price_S = LLV(L, Max(1, BarsSinceP1_S));
P2_Idx_S = ValueWhen(L == P2_Price_S AND BarsSinceP1_S > 0, BarIndex());
// C. Détection du Point 3 (Le sommet qui suit le P2)
BarsSinceP2_S = BarIndex() – P2_Idx_S;
P3_High_S = HHV(H, Max(1, BarsSinceP2_S));
// D. Calcul des Durées
DurBaisse_S = P2_Idx_S – P1_Idx_S;
DurConso_S = BarIndex() – P2_Idx_S;
// E. Validation des 3 conditions Bearish
CondP3_S = P3_High_S < P1_Price_S AND P3_High_S > P2_Price_S; // P3 doit être entre P1 et P2 (inverse)
CondT_S = DurConso_S >= (Ratio * DurBaisse_S) AND DurBaisse_S > 0;
CondInv_S = HHV(H, Max(1, DurConso_S)) <= P1_Price_S AND LLV(L, Max(1, DurConso_S)) >= P2_Price_S; // Pas d’invalidation
// F. Affichage Bearish (Rouge)
LigneActive_S = P2_Idx_S > P1_Idx_S AND CondP3_S AND CondT_S AND CondInv_S;
Plot(IIf(LigneActive_S, P2_Price_S, Null), “Support P2 (Short)”, colorRed, styleLine | styleThick | styleNoRescale,0,0,0,0,3);
// — Diagnostic Titre —
Title = Name() + ” | Durée M/B: ” + Max(DurMontee_L, DurBaisse_S) + ” | Conso: ” + Max(DurConso_L, DurConso_S);
_SECTION_END();