Deduction price for simple moving average

Viewing 8 posts - 1 through 8 (of 8 total)
  • Author
    Posts
  • #167780 quote
    CHEN CHENCHEN CHEN
    Participant
    New

    Hi:

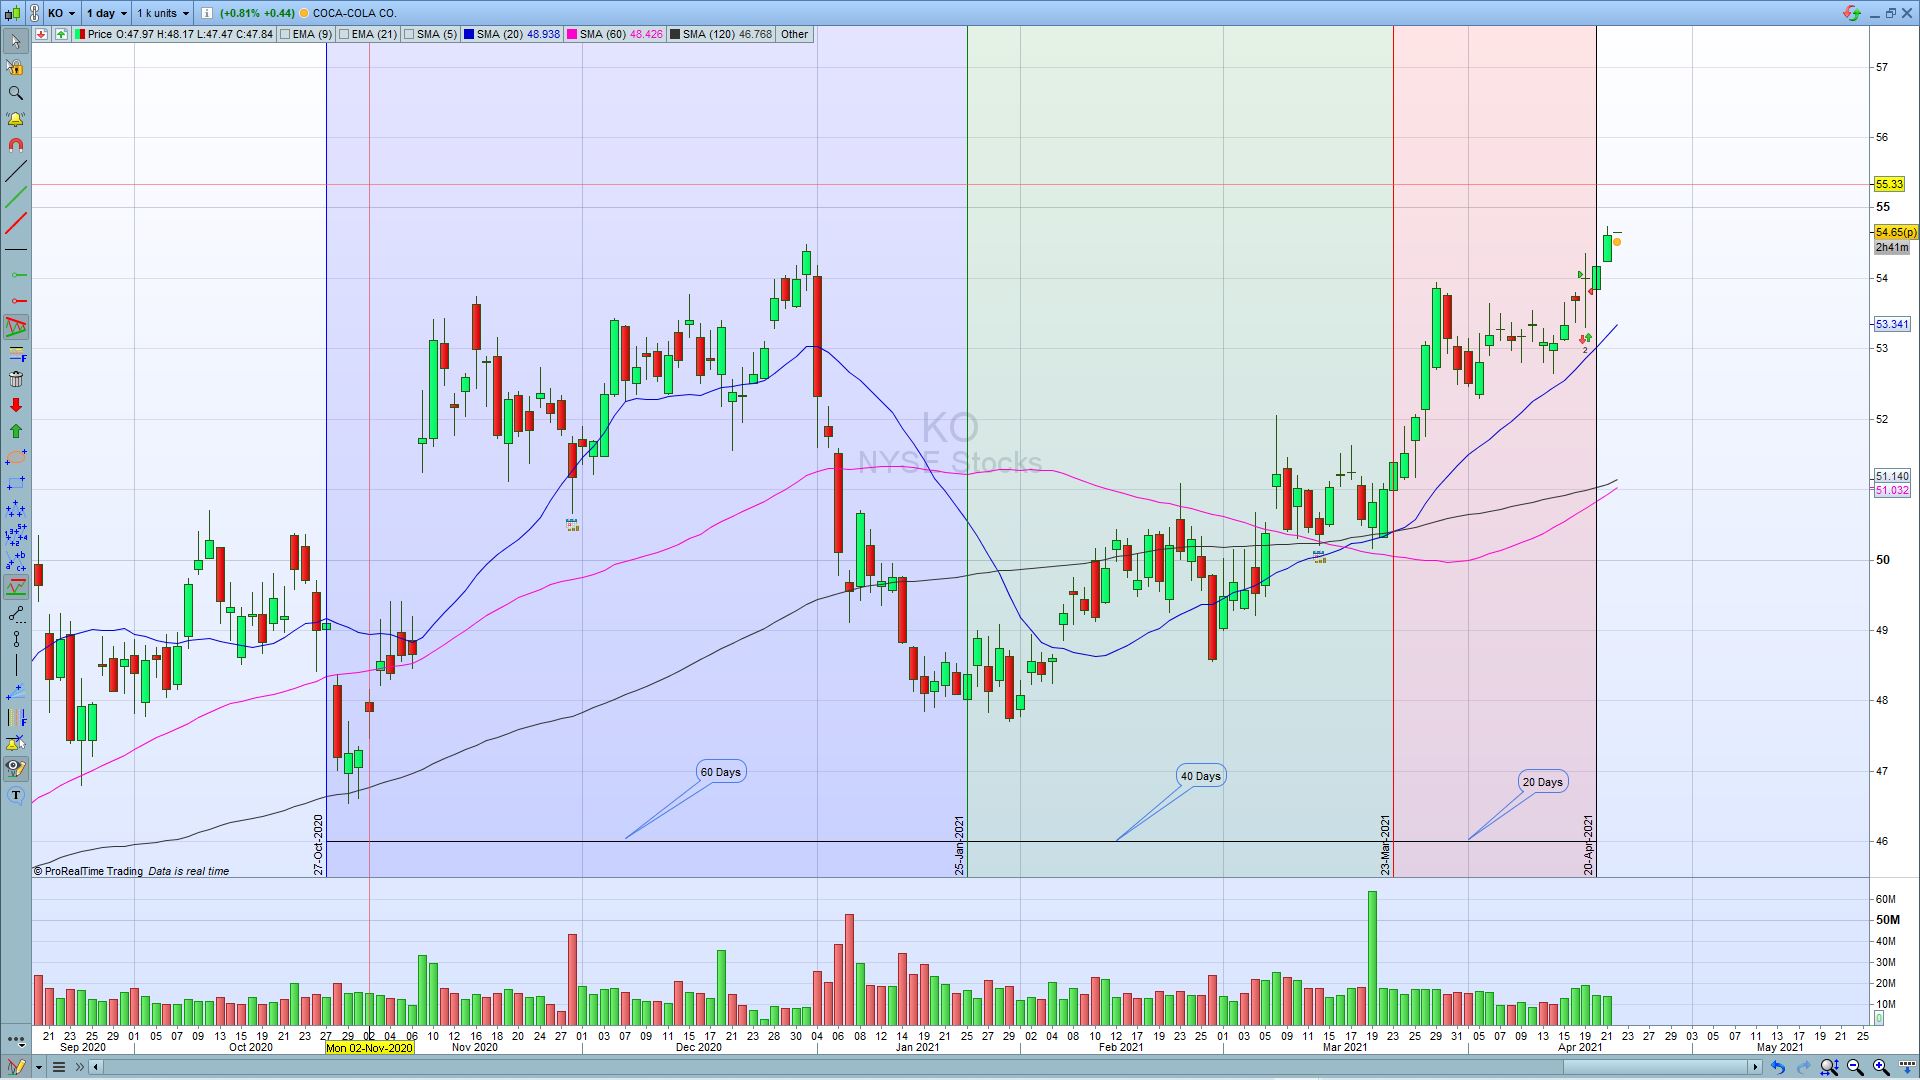
    please see attached, I wonder if anyone can help me to create the tool could be use from tool bar. the principle is to find the deduction price date of the 20, 60, 120 day simple moving average.

    I used the Fibonacci time zone tool to create the one I could use, but once I change the instruments I have to reset it. ideally if can create one tool and add in the tool bar, each time to use it just put it on the chart.

    it is very simple idea, four vertical lines, from first to second 20 days distance, from second to third 40 days distance, and from third to fourth 60 days distance.

    ideally if can create a tool not a indicator, as a tool I could move it to different start date with same period on the chart to help me to predict how the simple moving average to go in the certain time period.

    but if the platform not allow to add tools in the tool bar, then a indicator can do the same job is ok too.

    I hope I have explained clear, hopefully someone can help to create the tool or indicator for me, really appreciate it

    Thanks

    Andy

    days.jpg days.jpg
    #167782 quote
    robertogozzirobertogozzi
    Moderator
    Legend

    Tools cannot be created by users.

    #167918 quote
    CHEN CHENCHEN CHEN
    Participant
    New

    Thanks Robertogozzi, what about indicator? I believe that can be done, as I use the indicator in different platform.

    Please see the code I use in different platform attached, but I don’t know how to  translate it in pro-realtime

    MA1.docx
    #167929 quote
    robertogozzirobertogozzi
    Moderator
    Legend

    Sorry, I don’t know that language.

    I can see it’s about a group om MA’s, but nothing else.

    #167960 quote
    NicolasNicolas
    Keymaster
    Legend

    Do you have pictures of what is doing this indicator visually please?

    #168040 quote
    CHEN CHENCHEN CHEN
    Participant
    New

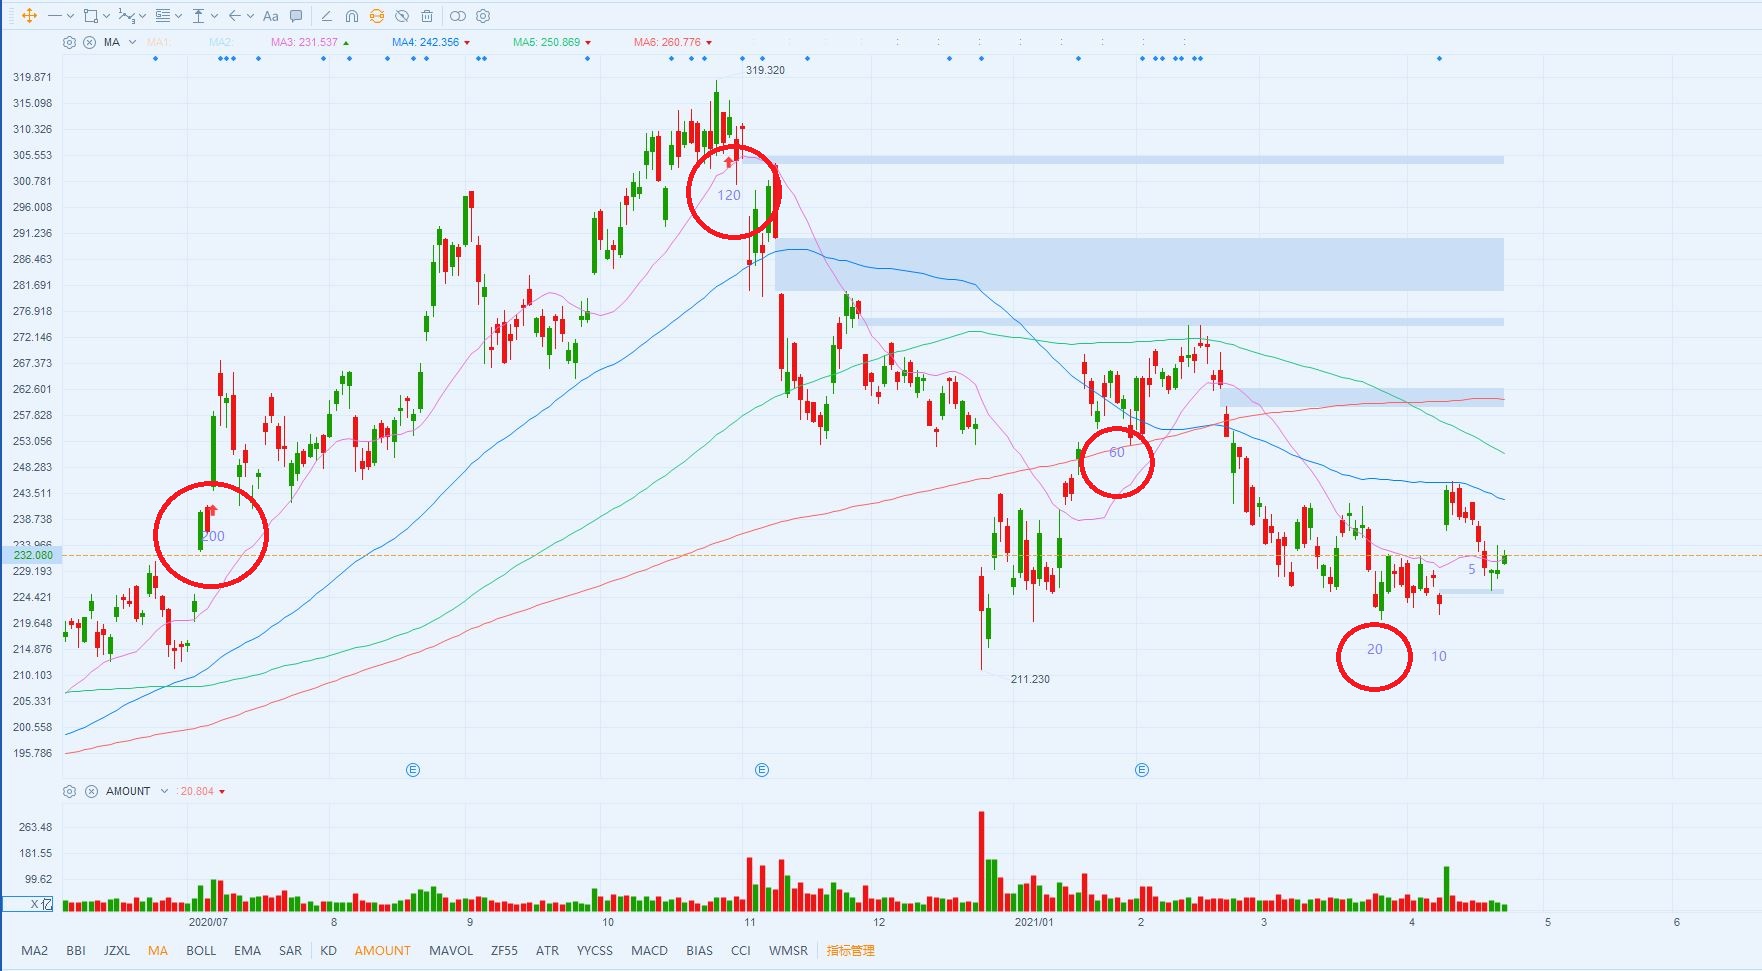
    Please see the attachment, pink line is 20 ma, blue line is 60 ma, green line is 120 ma, and red is 200 ma.

    the numbers 20, 60, 120, 200 in the red circle means those days before today’s date.

    it can help me to predict how the MA moving average is going to do in following days, for example 60 ma 60days ago price is above current price in next 25+ days,

    if current price stay same level, the 60 ma should trend down in next 25-30 days, it will put pressure on the current price

    not sure my explanation is clear enough ? let me know

    Thanks

    Andy

    Baba.jpg Baba.jpg
    #168046 quote
    NicolasNicolas
    Keymaster
    Legend

    So that code should do what you require:

    defparam drawonlastbaronly=true
    
    drawtext("20",barindex-20,low[20]-averagetruerange[14][20],dialog,bold,20)
    drawtext("60",barindex-60,low[60]-averagetruerange[14][60],dialog,bold,20)
    drawtext("120",barindex-120,low[120]-averagetruerange[14][120],dialog,bold,20)
    drawtext("200",barindex-200,low[200]-averagetruerange[14][200],dialog,bold,20)
    return
    #168052 quote
    CHEN CHENCHEN CHEN
    Participant
    New

    Hi Nicolas:

    That is perfect, really appreciate it

    Best Regards

    Andy

Viewing 8 posts - 1 through 8 (of 8 total)
  • You must be logged in to reply to this topic.

ProRealAI ProRealAI New

Stuck on this ProBuilder code?

Describe what this topic is trying to build, in plain English, and ProRealAI writes the ProRealTime™ indicator, screener or system for you.

Available in 7 languages
Try ProRealAI

Deduction price for simple moving average


ProBuilder: Indicators & Custom Tools

New Reply
Author
author-avatar
CHEN CHEN @chen-chen Participant
Summary

This topic contains 7 replies,
has 3 voices, and was last updated by CHEN CHENCHEN CHEN
5 years, 5 months ago.

Topic Details
Forum: ProBuilder: Indicators & Custom Tools
Language: English
Started: 04/22/2021
Status: Active
Attachments: 3 files
ProRealCode ProRealCode
Loading...