ProRealCode - Trading & Coding with ProRealTime™
The idea comes from Andreas Unger on Better system trader episode 45. He talks about his trend-systems, he likes to check the previous daily candle, if its body is above or below 50% of the high-low range.
Im testing it on my trend systems and the results are very interesting. Bodyp = 0.5 (or another % if you feel like optimizing/testing it.)
if dclose(0) > dopen(0) then
a = dhigh(0) - dlow(0)
b = a*bodyp
c = b > dclose(0) - dopen(0)
elsif dclose(0) < dopen(0) then
a = dhigh(0)-dlow(0)
b = a*bodyp
c = b > dopen(0) - dclose(0)
endif
k = 0
if c then
k = 1
endif
return k
When i test them in my systems i use the following code:
timeframe(daily,updateonclose)
dailydoji = CALL "Daily Doji"[0.5]
C1 = (dailydoji[1] = 1)
timeframe(default)
Im seeing some very interesting results from using this on my 1h systems. You can optimize the % of the body and you can check for = 0 as well as = 1.
Edit: Am i doing something wrong using dopen(0) etc, then calling it with [1]? or will it work as its suppose to?
It’s always interesting to see how different people code the same thing! This is how I would code it:
bodytop = max(open,close)
bodybottom = min(open,close)
midpoint = ((range/2)+low)
result = 0
if bodybottom > midpoint and bodytop > midpoint then
result = 1
endif
if bodybottom < midpoint and bodytop < midpoint then
result = -1
endif
return result
When you CALL an indicator it just applies the result to each candle that it is called on so it is perfectly normal to use [1] to find out what the called result was for the previous candle.
I always like to try to analyse things that someone says gives an edge so here I have two indicators that will check through history on the daily chart and see what happened the next day whenever a doji type candle appeared.
The first one just records whether the next candle was a green or a red one after a low doji or a green or a red one after a high doji and the second one records whether there was a break of the doji high or a break of the doji low on the next candle for both high and low doji types.
Both indicators also calculate a datum so we can directly compare to the market norm.
So it would seem that on the EURUSD a high doji day has been followed by a green day 55% of the time rather than a red day just 44% of the time – and is 70% likely to see a break of the doji high compared to only 30% a break of the low.
A low doji day has been followed by a red candle 55% of the time and by a green 44% of the time and the doji high has been broken only 30% of the time but the low broken 70% of the time.
The norm for any candle is 50% of the time the next candle is green and 49% it is red with 1% of candles having no change in value. 47% of candles are normally followed by a break of the high and 47% a break of the low. 14% of candles neither break the high or the low.
(All %’s have been rounded in this example)
So there might be an edge to looking for dojis on the EURUSD at least.
//Doji then Red or Green Tester
//By Vonasi
//Date: 20200421
bodytop = max(open,close)
bodybottom = min(open,close)
midpoint = ((range/2)+low)
result = 0
if bodybottom > midpoint and bodytop > midpoint then
result = 1
endif
if bodybottom < midpoint and bodytop < midpoint then
result = -1
endif
green = close>open
red = close<open
null = close = open
count = count + 1
if green then
datumgreen = datumgreen + 1
endif
if red then
datumred = datumred + 1
endif
if null then
datumnull = datumnull + 1
endif
if result[1] = 1 then
updojis = updojis + 1
if green then
gup = gup + 1
endif
if red then
rup = rup + 1
endif
endif
if result[1] = -1 then
downdojis = downdojis + 1
if green then
gdown = gdown + 1
endif
if red then
rdown = rdown + 1
endif
endif
updojigreen = (gup/updojis)*100
updojired = (rup/updojis)*100
downdojigreen = (gdown/downdojis)*100
downdojired = (rdown/downdojis)*100
gdatum = (datumgreen/count)*100
rdatum = (datumred/count)*100
ndatum = (datumnull/count)*100
return updojigreen as "high doji then green", updojired as "high doji then red", downdojigreen as "low doji then green", downdojired as "low doji then red", gdatum as "green datum", rdatum as "red datum", ndatum as "null datum"
//Doji Then Break of High or Low Tester
//By Vonasi
//Date:20200421
bodytop = max(open,close)
bodybottom = min(open,close)
midpoint = ((range/2)+low)
result = 0
if bodybottom > midpoint and bodytop > midpoint then
result = 1
endif
if bodybottom < midpoint and bodytop < midpoint then
result = -1
endif
green = high > high[1]
red = low < low[1]
null = high < high[1] and low > low[1]
count = count + 1
if green then
datumgreen = datumgreen + 1
endif
if red then
datumred = datumred + 1
endif
if null then
datumnull = datumnull + 1
endif
if result[1] = 1 then
updojis = updojis + 1
if green then
gup = gup + 1
endif
if red then
rup = rup + 1
endif
endif
if result[1] = -1 then
downdojis = downdojis + 1
if green then
gdown = gdown + 1
endif
if red then
rdown = rdown + 1
endif
endif
updojigreen = (gup/updojis)*100
updojired = (rup/updojis)*100
downdojigreen = (gdown/downdojis)*100
downdojired = (rdown/downdojis)*100
gdatum = (datumgreen/count)*100
rdatum = (datumred/count)*100
ndatum = (datumnull/count)*100
return updojigreen as "high doji then high break", updojired as "high doji then low break", downdojigreen as "low doji then high break", downdojired as "low doji then low break", gdatum as "high break datum", rdatum as "low break datum", ndatum as "no break datum"
Here is a third version that analyses after each doji whether the close was above the doji high or below the doji low or an inside close.
On the EURUSD it seems that the normal datum is that 50% of candles close inside and 25% close above and 25% close below the previous candle.
If we look at just high dojis then 45% close inside and 40% close above the doji high and just 15% close below the doji low the next day.
For low dojis then 43% close inside and 16% close above the doji high and 40% close below the doji low.
//Doji Close Above Or Below Tester
//By Vonasi
//Date: 20200421
bodytop = max(open,close)
bodybottom = min(open,close)
midpoint = ((range/2)+low)
result = 0
if bodybottom > midpoint and bodytop > midpoint then
result = 1
endif
if bodybottom < midpoint and bodytop < midpoint then
result = -1
endif
green = close > high[1]
red = close < low[1]
null = close < high[1] and close > low[1]
count = count + 1
if green then
datumgreen = datumgreen + 1
endif
if red then
datumred = datumred + 1
endif
if null then
datumnull = datumnull + 1
endif
if result[1] = 1 then
updojis = updojis + 1
if green then
gup = gup + 1
endif
if red then
rup = rup + 1
endif
if null then
nup = nup + 1
endif
endif
if result[1] = -1 then
downdojis = downdojis + 1
if green then
gdown = gdown + 1
endif
if red then
rdown = rdown + 1
endif
if null then
ndown = ndown + 1
endif
endif
updojigreen = (gup/updojis)*100
updojired = (rup/updojis)*100
downdojigreen = (gdown/downdojis)*100
downdojired = (rdown/downdojis)*100
gdatum = (datumgreen/count)*100
rdatum = (datumred/count)*100
ndatum = (datumnull/count)*100
updojinull = (nup/updojis)*100
downdojinull = (ndown/downdojis)*100
return updojigreen as "high doji then close above high", updojired as "high doji then close below low", downdojigreen as "low doji then close above high", downdojired as "low doji then close below low", gdatum as "close above high datum", rdatum as "close below low datum", ndatum as "close inside datum", updojinull as "high doji then close inside", downdojinull as "low doji then close inside"
@Vonasi thanks for the tools! Very interesting findings:
“So it would seem that on the EURUSD a high doji day has been followed by a green day 55% of the time rather than a red day just 44% of the time – and is 70% likely to see a break of the doji high compared to only 30% a break of the low.
A low doji day has been followed by a red candle 55% of the time and by a green 44% of the time and the doji high has been broken only 30% of the time but the low broken 70% of the time.”
Ungar uses this as a filter for his trend/swing systems, so expecting a green day that exceeds the doji-high the next day would make sense that there is actually an edge (if not he must be lying lol)
Big thanks for the good work 🙂
Edit: This is why sharing is caring on the forum, one guys reads something in a book, another guy takes the idea and runs with it 🙂
I ran a bit further with it.
I decided to try to rate each doji by how close the open and close were to the extreme of the candle – so for a high doji the closer both the open and close are to the candle high the higher that doji scored and the opposite for low dojis so the closer both the open and close are to the candle low the higher the score. The scores are between zero and 100.
Then thanks to v11 arrays I was able to split the results up into 80 buckets – so high dojis that were followed by a green candle and that scored 0 to 5 then >5 and <=10 then >10 and <=15 and so on – and the same for if a red candle followed and also the same for low dojis.
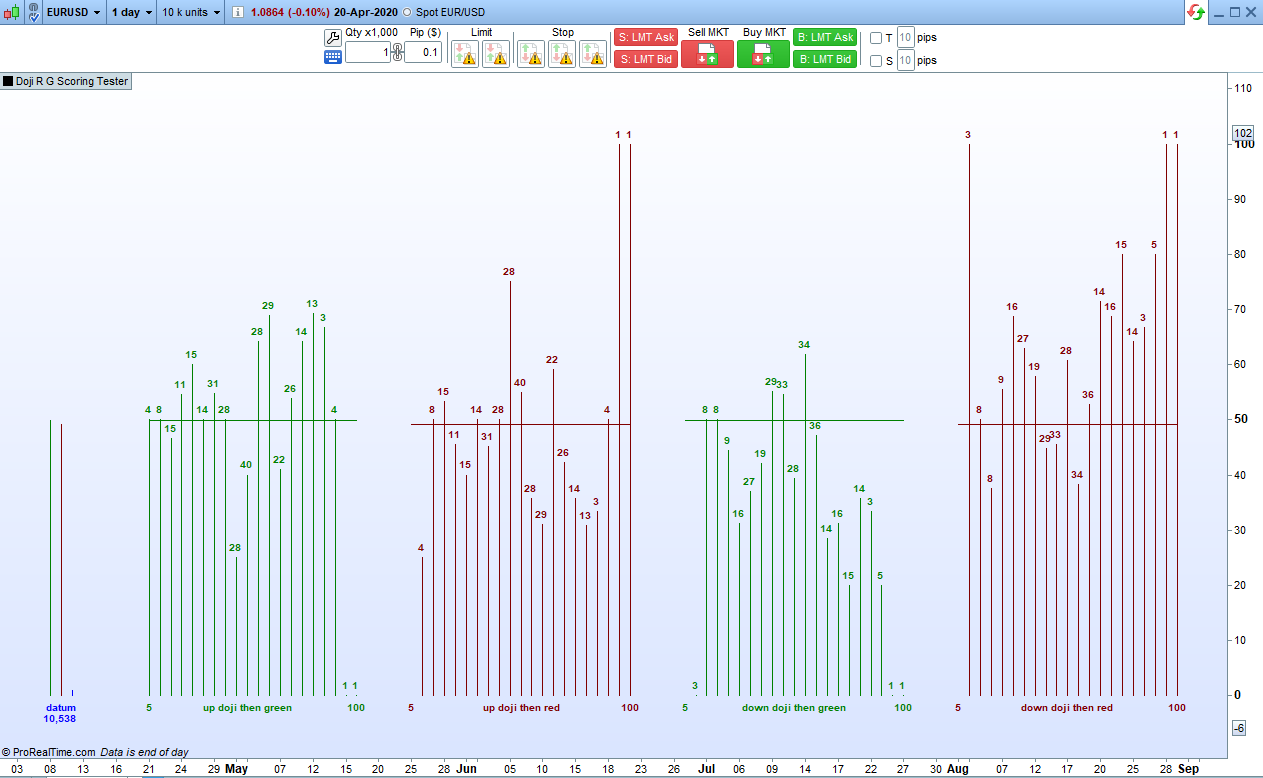
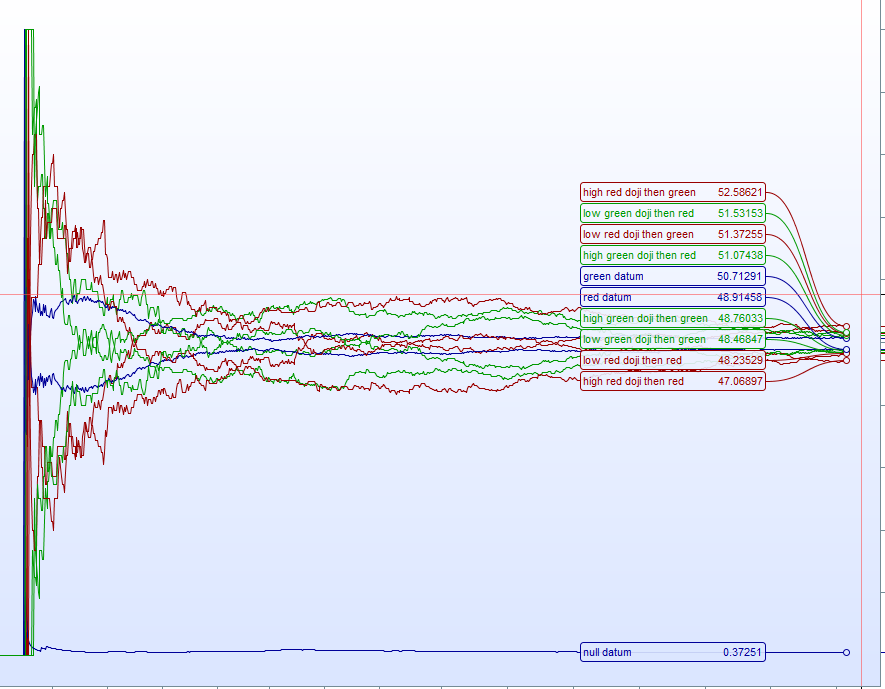
I then plotted the results in four charts and put the green and red datum values across them all to see if the score of a doji effects the likely hood of the next candle being a red or green one.
The numbers above the lines are the number of low dojis or high dojis with that score that were tested . The lines are scaled 0 to 100% on the y axis.
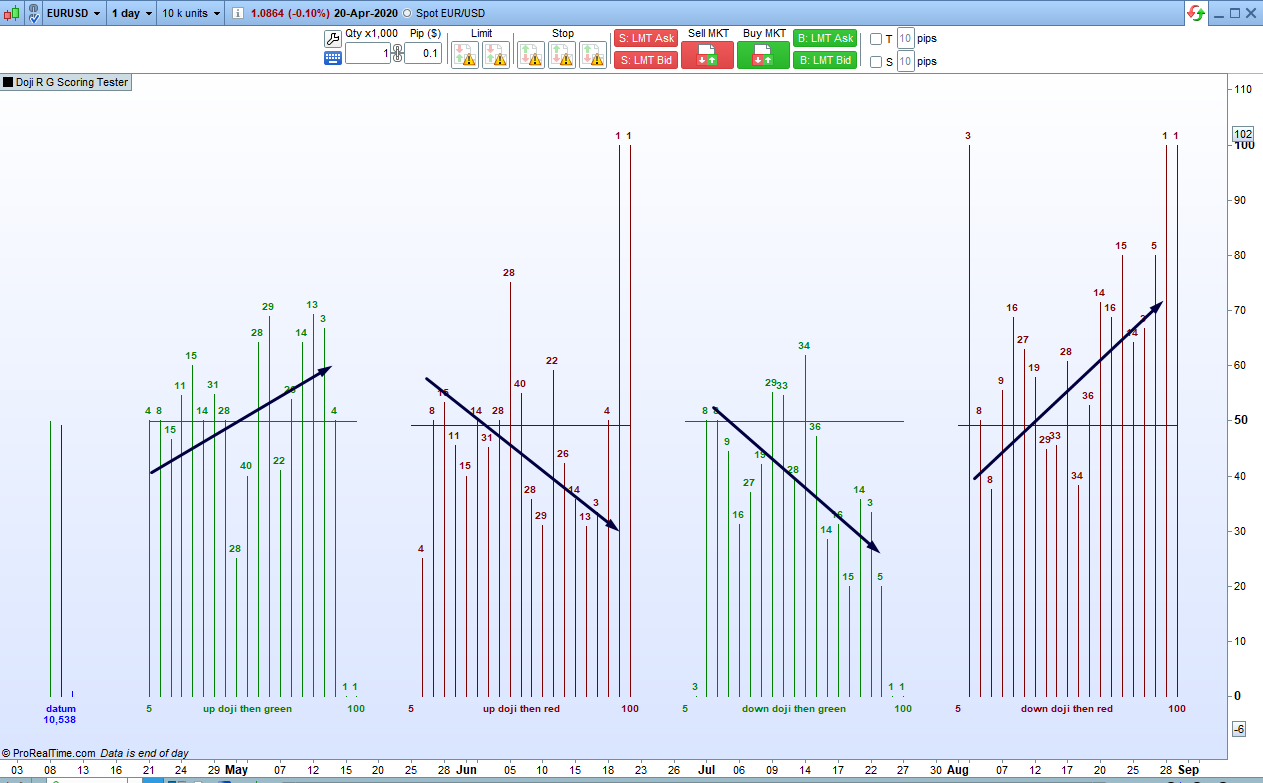
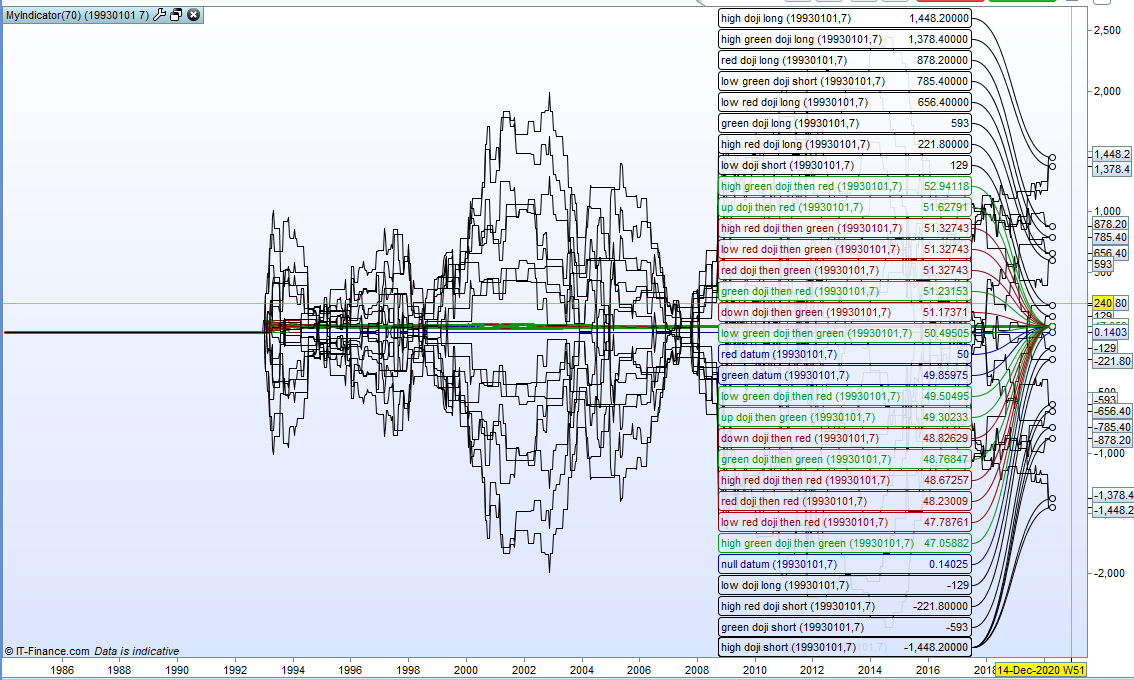
The results on the EURUSD were a little inconclusive and this is perhaps to the limited amount of data in each bucket. Perhaps in hind sight bigger buckets would have been better. However I have drawn arrows on the second image showing what looks like the general trend for each chart and it would seem that the higher a doji scores the more likely the next candle is to continue in the same direction – that is up for high dojis and down for low dojis.
//Doji R G Scoring Tester
//PRTv11
//By Vonasi
//Date: 20200421
bodytop = max(open,close)
bodybottom = min(open,close)
midpoint = ((range/2)+low)
result = 0
if bodybottom > midpoint and bodytop > midpoint then
result = round((((((bodytop-midpoint)/(range/2))*100) + (((bodybottom-midpoint)/(range/2)))*100))/2)
endif
if bodybottom < midpoint and bodytop < midpoint then
result = -round((((((midpoint-bodytop)/(range/2))*100) + (((midpoint-bodybottom)/(range/2)))*100))/2)
endif
green = close>open
red = close<open
null = close = open
count = count + 1
if green then
datumgreen = datumgreen + 1
endif
if red then
datumred = datumred + 1
endif
if null then
datumnull = datumnull + 1
endif
if result[1] > 0 then
for a = 1 to 20
b = a*5
if result[1] = b then
$updojis[b] = $updojis[b] + 1
if green then
$gup[b] = $gup[b] + 1
endif
if red then
$rup[b] = $rup[b] + 1
endif
break
endif
next
endif
if result[1] < 0 then
for a = 1 to 20
b = a*5
if result[1] = -b then
$downdojis[b] = $downdojis[b] + 1
if green then
$gdown[b] = $gdown[b] + 1
endif
if red then
$rdown[b] = $rdown[b] + 1
endif
break
endif
next
endif
if islastbarupdate then
for a = 1 to 20
b = a*5
$updojigreen[b] = ($gup[b]/$updojis[b])*100
drawsegment(barindex+a,0,barindex+a,$updojigreen[b])coloured(0,128,0)
text = $updojis[b]
drawtext("#text#",barindex+a,$updojigreen[b]+2,sansserif,bold,10)coloured(0,128,0)
$updojired[b] = ($rup[b]/$updojis[b])*100
drawsegment(barindex+a+25,0,barindex+a+25,$updojired[b])coloured(128,0,0)
drawtext("#text#",barindex+a+25,$updojired[b]+2,sansserif,bold,10)coloured(128,0,0)
$downdojigreen[b] = ($gdown[b]/$downdojis[b])*100
drawsegment(barindex+a+50,0,barindex+a+50,$downdojigreen[b])coloured(0,128,0)
text = $downdojis[b]
drawtext("#text#",barindex+a+50,$downdojigreen[b]+2,sansserif,bold,10)coloured(0,128,0)
$downdojired[b] = ($rdown[b]/$downdojis[b])*100
drawsegment(barindex+a+75,0,barindex+a+75,$downdojired[b])coloured(128,0,0)
drawtext("#text#",barindex+a+75,$downdojired[b]+2,sansserif,bold,10)coloured(128,0,0)
next
drawtext("up doji then green",barindex+10,-2,sansserif,bold,10)coloured(0,128,0)
drawtext("up doji then red",barindex+35,-2,sansserif,bold,10)coloured(128,0,0)
drawtext("down doji then green",barindex+60,-2,sansserif,bold,10)coloured(0,128,0)
drawtext("down doji then red",barindex+85,-2,sansserif,bold,10)coloured(128,0,0)
gdatum = (datumgreen/count)*100
drawsegment(barindex-8,0,barindex-8,gdatum)coloured(0,128,0)
drawtext("#count#",barindex-7,-4,sansserif,bold,10)coloured(0,0,255)
rdatum = (datumred/count)*100
drawsegment(barindex-7,0,barindex-7,rdatum)coloured(128,0,0)
ndatum = (datumnull/count)*100
drawsegment(barindex-6,0,barindex-6,ndatum)coloured(0,0,255)
drawtext("datum",barindex-7,-2,sansserif,bold,10)coloured(0,0,255)
drawsegment(barindex+1,gdatum,barindex+20,gdatum)coloured(0,128,0)
drawsegment(barindex+25,rdatum,barindex+45,rdatum)coloured(128,0,0)
drawsegment(barindex+50,gdatum,barindex+70,gdatum)coloured(0,128,0)
drawsegment(barindex+75,rdatum,barindex+95,rdatum)coloured(128,0,0)
drawtext("5",barindex+1,-2,sansserif,bold,10)coloured(0,128,0)
drawtext("100",barindex+20,-2,sansserif,bold,10)coloured(0,128,0)
drawtext("5",barindex+25,-2,sansserif,bold,10)coloured(128,0,0)
drawtext("100",barindex+45,-2,sansserif,bold,10)coloured(128,0,0)
drawtext("5",barindex+50,-2,sansserif,bold,10)coloured(0,128,0)
drawtext("100",barindex+70,-2,sansserif,bold,10)coloured(0,128,0)
drawtext("5",barindex+75,-2,sansserif,bold,10)coloured(128,0,0)
drawtext("100",barindex+95,-2,sansserif,bold,10)coloured(128,0,0)
endif
return -6 coloured(0,0,0,0),102 coloured(0,0,0,0)
Sometimes we have to take a step back and look at the bigger picture.
The attached image is an equity curve of a strategy on the EURUSD that simple goes long on a high doji and short on a low doji and then exits the next day.
We can clearly see that up to the beginning of 1993 the strategy worked very well indeed but since then the edge disappeared. I think we can blame all those pesky computers that people started trading with again. It seems that dojis are perhaps no longer a trading edge.
Holy shit that strategy…. Lol…
And another big thx to you Vonasi.
It is like someone just threw a switch at the start of 1993 and the doji edge just totally disappeared!
It’s lucky I shared these codes here as my laptop just crash closed for some strange reason – perhaps because it is a rather warm day here in Greece and I haven’t got round to fitting the new cooling fan I bought for it yet! If I hadn’t shared them then they would have all been lost because I hadn’t hit CTRL+S yet today or exported them yet.
So I decided to run the same tests but exclude pre 1993 data. The results are very different.
The doji seems to have no effect on the colour of the following candle.
However when we compare to the high break and low break datums there is perhaps still something to see:
The datum is that 48% of all candles are followed by a break of the high and 48% a break of the low
After a high doji 70% of candles break the high and only break the low 33% of the time.
After a low doji 68% of candles break the low and only break the high 34% of the time.
When we study if the next candle closes above the doji high or below the doji low we can also see something:
The datum is that 51% of candles close inside and 24% close above and 24% close below.
After a high doji 35% close above and only 15% close below.
After a low doji 34% close below and 19% close above.
Here is another doji tester. This one splits the data down into high green dojis, high red dojis, low green dojis and low red dojis so we can see if the coulour of the doji has any influence on what happens next.
It would appear that on the EURUSD daily since the beginning of 1993 green dojis whether high or low dojis are ever so slightly more often followed by red candles and red dojis whether high or low dojis are ever so slightly more often followed by green candles. It might be a 1 or 2% edge!
//Red or Green Doji then Red or Green Tester
//By Vonasi
//Date: 20200422
//StartDate = 19930101
if date >= StartDate then
bodytop = max(open,close)
bodybottom = min(open,close)
midpoint = ((range/2)+low)
result = 0
if bodybottom > midpoint and bodytop > midpoint then
result = 1
endif
if bodybottom < midpoint and bodytop < midpoint then
result = -1
endif
green = close>open
red = close<open
null = close = open
count = count + 1
if green then
datumgreen = datumgreen + 1
endif
if red then
datumred = datumred + 1
endif
if null then
datumnull = datumnull + 1
endif
if result[1] = 1 then
if green[1] then
updojisgreen = updojisgreen + 1
endif
if red[1] then
updojisred = updojisred + 1
endif
if green and green[1] then
ggup = ggup + 1
endif
if red and red[1] then
rrup = rrup + 1
endif
if green and red[1] then
rgup = rgup + 1
endif
if red and green[1] then
grup = grup + 1
endif
endif
if result[1] = -1 then
if green[1] then
downdojisgreen = downdojisgreen + 1
endif
if red[1] then
downdojisred = downdojisred + 1
endif
if green and green[1] then
ggdown = ggdown + 1
endif
if red and red[1] then
rrdown = rrdown + 1
endif
if green and red[1] then
rgdown = rgdown + 1
endif
if red and green[1] then
grdown = grdown + 1
endif
endif
updojigreengreen = (ggup/updojisgreen)*100
updojiredred = (rrup/updojisred)*100
updojiredgreen = (rgup/updojisred)*100
updojigreenred = (grup/updojisgreen)*100
downdojigreengreen = (ggdown/downdojisgreen)*100
downdojiredred = (rrdown/downdojisred)*100
downdojiredgreen = (rgdown/downdojisred)*100
downdojigreenred = (grdown/downdojisgreen)*100
gdatum = (datumgreen/count)*100
rdatum = (datumred/count)*100
ndatum = (datumnull/count)*100
endif
return updojigreengreen as "high green doji then green", updojiredred as "high red doji then red", downdojigreengreen as "low green doji then green", downdojiredred as "low red doji then red", gdatum as "green datum", rdatum as "red datum", ndatum as "null datum",updojiredgreen as "high red doji then green", updojigreenred as "high green doji then red", downdojiredgreen as "low red doji then green", downdojigreenred as "low green doji then red"
I got bored and so added even more doji analysis to the indicator. Now it analyses all types of doji, high, low, green ones and red ones and every combination of them. It also creates equity curves for if you had traded each type and then closed one candle later for both long and short directions.
You can set a start date and also subtract a spread value from each trade if you want.
I find the easiest way to view the equity curves is to make the one you want to see a thicker line in the indicator configure window so that it stands out.
//Red or Green Doji then Red or Green Tester
//By Vonasi
//Date: 20200422
StartDate = 19930101 //Set to zero for analysis of all data.
Spread = 0
if date >= StartDate then
bodytop = max(open,close)
bodybottom = min(open,close)
midpoint = ((range/2)+low)
result = 0
if bodybottom > midpoint and bodytop > midpoint then
result = 1
endif
if bodybottom < midpoint and bodytop < midpoint then
result = -1
endif
green = close>open
red = close<open
null = close = open
count = count + 1
if green then
datumgreen = datumgreen + 1
endif
if red then
datumred = datumred + 1
endif
if null then
datumnull = datumnull + 1
endif
if result[1] = 1 then
uplong = uplong + (close-open) - spread
upshort = upshort + (open-close) - spread
if green[1] then
greendoji = greendoji+1
updojisgreen = updojisgreen + 1
guplong = guplong + (close-open) - spread
gupshort = gupshort + (open-close) - spread
glong = glong + (close-open) - spread
gshort = gshort + (open-close) - spread
endif
if red[1] then
reddoji = reddoji+1
updojisred = updojisred + 1
ruplong = ruplong + (close-open) - spread
rupshort = rupshort + (open-close) - spread
rlong = rlong + (close-open) - spread
rshort = rshort + (open-close) - spread
endif
if green and green[1] then
ggup = ggup + 1
endif
if red and red[1] then
rrup = rrup + 1
endif
if green and red[1] then
rgup = rgup + 1
endif
if red and green[1] then
grup = grup + 1
endif
updojis = ggup+rrup+rgup+grup
if green then
upg = upg + 1
endif
if red then
upr = upr + 1
endif
endif
if result[1] = -1 then
downlong = downlong + (close-open) - spread
downshort = downshort + (open-close) - spread
if green[1] then
greendoji = greendoji+1
downdojisgreen = downdojisgreen + 1
gdownlong = gdownlong + (close-open) - spread
gdownshort = gdownshort + (open-close) - spread
glong = glong + (close-open) - spread
gshort = gshort + (open-close) - spread
endif
if red[1] then
reddoji = reddoji+1
downdojisred = downdojisred + 1
rdownlong = rdownlong + (close-open) - spread
rdownshort = rdownshort + (open-close) - spread
rlong = rlong + (close-open) - spread
rshort = rshort + (open-close) - spread
endif
if green and green[1] then
ggdown = ggdown + 1
endif
if red and red[1] then
rrdown = rrdown + 1
endif
if green and red[1] then
rgdown = rgdown + 1
endif
if red and green[1] then
grdown = grdown + 1
endif
downdojis = ggdown+rrdown+rgdown+grdown
if green then
downg = downg + 1
endif
if red then
downr = downr + 1
endif
endif
rr = rrup + rrdown
gg = ggup + ggdown
rg = rgup + rgdown
gr = grup + grdown
updojigreengreen = (ggup/updojisgreen)*100
updojiredred = (rrup/updojisred)*100
updojiredgreen = (rgup/updojisred)*100
updojigreenred = (grup/updojisgreen)*100
updojigreen = (upg/updojis)*100
updojired = (upr/updojis)*100
downdojigreengreen = (ggdown/downdojisgreen)*100
downdojiredred = (rrdown/downdojisred)*100
downdojiredgreen = (rgdown/downdojisred)*100
downdojigreenred = (grdown/downdojisgreen)*100
downdojigreen = (downg/downdojis)*100
downdojired = (downr/downdojis)*100
reddojired = (rr/reddoji)*100
reddojigreen = (rg/reddoji)*100
greendojired = (gr/greendoji)*100
greendojigreen = (gg/greendoji)*100
gdatum = (datumgreen/count)*100
rdatum = (datumred/count)*100
ndatum = (datumnull/count)*100
endif
return updojigreengreen as "high green doji then green%", updojiredred as "high red doji then red%", downdojigreengreen as "low green doji then green%", downdojiredred as "low red doji then red%", gdatum as "green datum%", rdatum as "red datum%", ndatum as "null datum%",updojiredgreen as "high red doji then green%", updojigreenred as "high green doji then red%", downdojiredgreen as "low red doji then green%", downdojigreenred as "low green doji then red%",updojigreen as "up doji then green%",updojired as "up doji then red%",downdojigreen as "down doji then green%",downdojired as "down doji then red%",reddojired as "red doji then red%",reddojigreen as "red doji then green%",greendojired as "green doji then red%",greendojigreen as "green doji then green%", guplong as "high green doji long", ruplong as "high red doji long", gdownlong as "low green doji long", rdownlong as "low red doji long", gupshort as "high green doji short", rupshort as "high red doji short", gdownshort as "low green doji short", rdownshort as "low red doji short",uplong as "high doji long",upshort as "high doji short",downlong as "low doji long",downshort as "low doji short",glong as "green doji long",gshort as "green doji short",rlong as "red doji long",rshort as "red doji short"
DD – Daily Doji
This topic contains 11 replies,
has 2 voices, and was last updated by Vonasi
5 years, 9 months ago.
| Forum: | ProBuilder: Indicators & Custom Tools |
| Language: | English |
| Started: | 04/20/2020 |
| Status: | Active |
| Attachments: | 6 files |
The information collected on this form is stored in a computer file by ProRealCode to create and access your ProRealCode profile. This data is kept in a secure database for the duration of the member's membership. They will be kept as long as you use our services and will be automatically deleted after 3 years of inactivity. Your personal data is used to create your private profile on ProRealCode. This data is maintained by SAS ProRealCode, 407 rue Freycinet, 59151 Arleux, France. If you subscribe to our newsletters, your email address is provided to our service provider "MailChimp" located in the United States, with whom we have signed a confidentiality agreement. This company is also compliant with the EU/Swiss Privacy Shield, and the GDPR. For any request for correction or deletion concerning your data, you can directly contact the ProRealCode team by email at privacy@prorealcode.com If you would like to lodge a complaint regarding the use of your personal data, you can contact your data protection supervisory authority.