🧠 Trading Logic
This strategy is a simple, mechanical long/short system built around moving averages, RSI, and ATR-based exits. On the long side, it stays flat until there is no existing long position and the close moves above a smoothed average of price (a custom average using 38 and 8 periods). In other words, longs are only taken when price is trading above a short‑term trend filter, suggesting some upside momentum or a move into a bullish regime. Once a long is opened, both stop loss and take profit are dynamic and based on the Average True Range: the stop is set at 2.7 times the 11‑period ATR, and the profit target at 2.9 times the 17‑period ATR. That makes the long side adapt to volatility rather than using fixed price distances.
The short side works differently and is more signal‑driven. New short trades are only taken when there is no existing short position and a faster average of price (21, 3) crosses below a slower average (61, 2), which acts like a short‑term trend reversal or momentum shift to the downside. This bearish cross must also be confirmed by a relatively strong RSI(7) value above 51, implying that the system looks to fade strength that is rolling over, rather than shorting already oversold markets. Exits on shorts are simpler and fixed: a 1.7% stop and 3.4% profit target, giving a predefined risk‑reward ratio. Overall, the code suggests a system that may be better suited to instruments with decent volatility and some trend or swing behavior. It separates logic and parameters for longs and shorts, uses a flat (no pyramiding) position model, and is likely to behave differently in strong trends versus choppy, sideways markets where the moving average crossovers and RSI conditions may give more false signals.
📊 Performance Metrics
| Metric |
Value |
Metric |
Value |
| Score (SQN) | 1.19 | Sharpe Ratio | 1.05 |
| Profit Factor | 1.33 | Max Drawdown | 17.80% |
| Ulcer Index | 0.029 | Stability (R²) | 0.924 |
| Trades | 116 | PnL ($) | 21,185 |
| Time in Market | 40.70% | MC Score | 50.0 |
📈 Backtest Context
| Instrument | DAX P (^GDAXI) |
Timeframe | 1d |
| Period | 2010-01-13 → 2026-03-03 |
Seed | 217126686 |
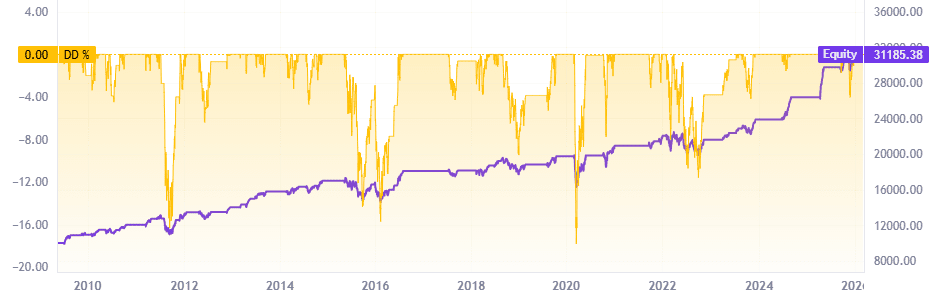
📉 Equity Curve
⚠️ Community-generated strategy — please read before trading
This strategy was automatically generated by a community member using
ProRealQuant, a free tool for automated strategy generation on ProRealTime. It is shared purely for educational and discussion purposes.
Past backtest results do not guarantee future performance. Always conduct your own analysis, apply sound risk management, and never trade with capital you cannot afford to lose.
💻 ProBuilder Code
// Generated ProBuilder Strategy
// Auto-generated from ProRealQuant
DEFPARAM cumulateorders=false
DEFPARAM preloadbars = 200

// Long Entry Condition
BuyCondition = NOT LONGONMARKET AND CLOSE > AVERAGE[38, 8](close)
// Short Entry Condition
SellCondition = NOT SHORTONMARKET AND (AVERAGE[21, 3](close) CROSSES UNDER AVERAGE[61, 2](close) AND RSI[7] > 51)

// Market Orders
IF BuyCondition AND NOT SellCondition THEN
    BUY AT MARKET
    // Stop Loss Exit
    SET STOP LOSS (2.7 * AVERAGETRUERANGE[11])
    // Take Profit Exit
    SET TARGET PROFIT (2.9 * AVERAGETRUERANGE[17])
ENDIF

IF SellCondition AND NOT BuyCondition THEN
    SELLSHORT AT MARKET
    // Stop Loss Exit
    SET STOP %LOSS (1.7)
    // Take Profit Exit
    SET TARGET %PROFIT (3.4)
ENDIF
💬 Join the discussion! Feel free to share your own backtest results on different instruments or timeframes, suggest improvements, propose forks or parameter variations — the community learns best together.
🔧 Generated with ProRealQuant — a free community tool for automated strategy generation and backtesting on ProRealTime. Try it yourself!