Hi all!
Doing some tests for a system I found something very weird in the PRT data. It seems to me that the price of the CLOSE function doesn´t match with the actual candle close in some cases. Yeah, I know, pretty disturbing! I really hope you can tell me I am wrong
I did an idiot system just to graph the CLOSE function and check if it match the actual candle close, the “PRUEBA CLOSE” system attached. Run it for TF1h with 200.000 candles.
I haven´t done a thorough searh but so far this are the periods I found differences:
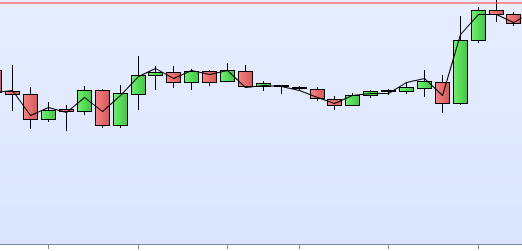
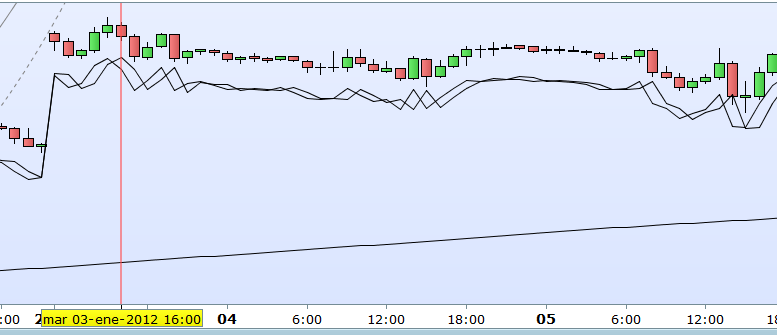
- In the DAX from about August´2010 to October´2011 or so most of the CLOSE result doesn´t match with the actual candle close, with more or less differences (see 1st image attached)
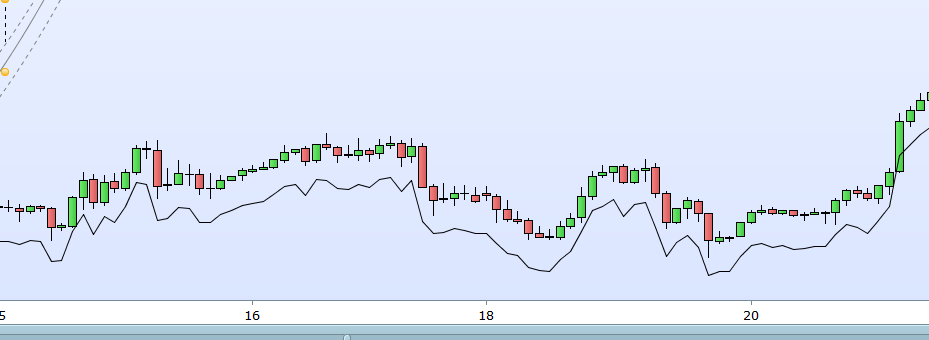
- In the DOW JONES from about December
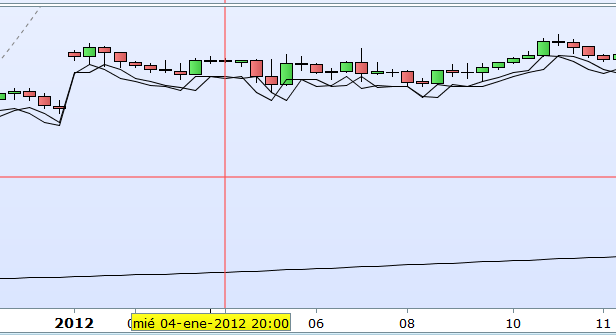
2011 to Abril2012 the differences are bigger and it´s easily seen in the graphic (see 2nd picture attached)
Please tell me I am wrong
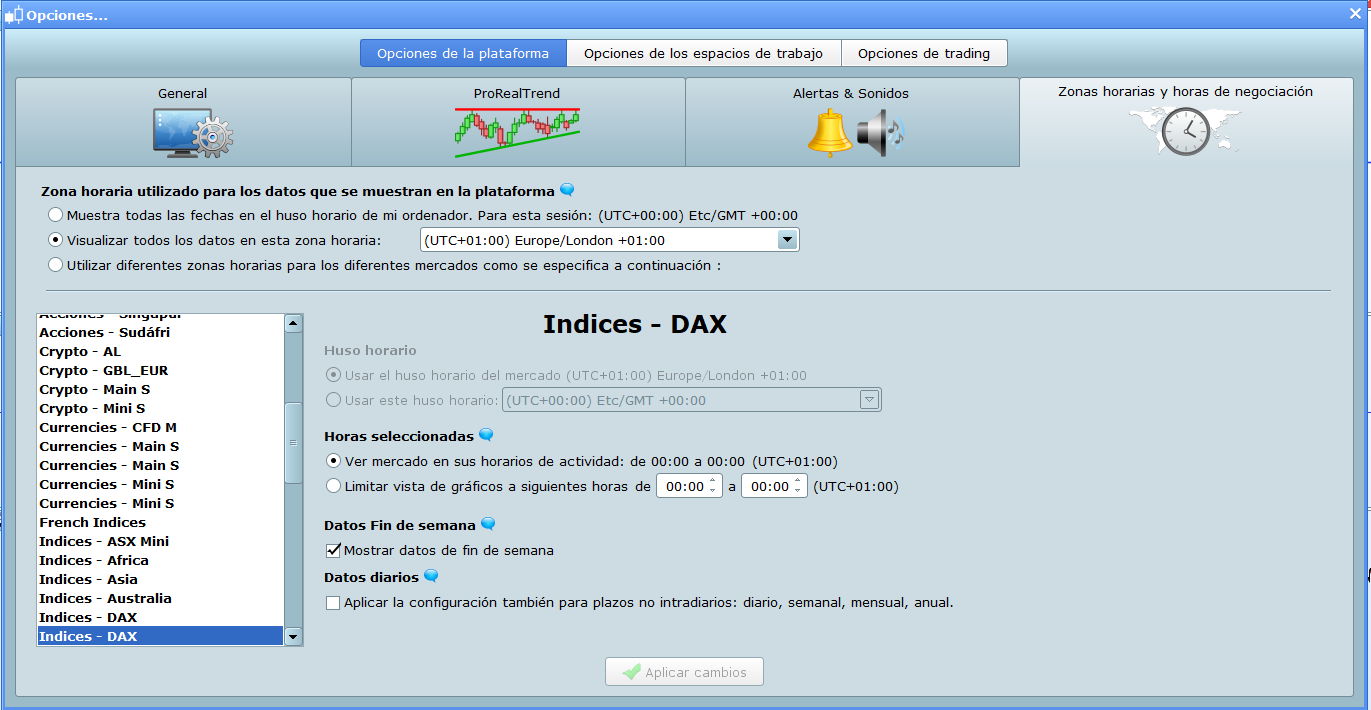
Custom trading hours for this chart? Right click and choose “custom trading hours” and check if they are different from the real market hours.
Nicolas,
Thanks for the quick response. Is this what you mean? But anyway… why would this differences happen only for limited periods??
Does this differences happen to anyone else?
Please post the code of your indicator in your next post, and I’ll try to replicate the issue, thanks.
Please post the code of your indicator in your next post, and I’ll try to replicate the issue, thanks.
What indicator? I am saying there are differences between the default CLOSE function and the actual candle closes… no indicator involved 🙂
You can replicate the issue with the backtesting of the system I attached in the first message for the indexes and periods I mentioned in the same message
This is the code of the PRUEBA-CLOSE system to check the differences I found.
IF CLOSE>99999 THEN
BUY 1 CONTRACT AT MARKET
ENDIF
GRAPHONPRICE CLOSE
Just a dummy system to graph the value of the default CLOSE function
Ok, I can’t replicate the issue, I will revert back to you once I know more.
Thanks Nicolas,
It seems to happen the same with the default OPEN value.
IF CLOSE>99999 THEN
BUY 1 CONTRACT AT MARKET
ENDIF

GRAPHONPRICE CLOSE
GRAPHONPRICE OPEN
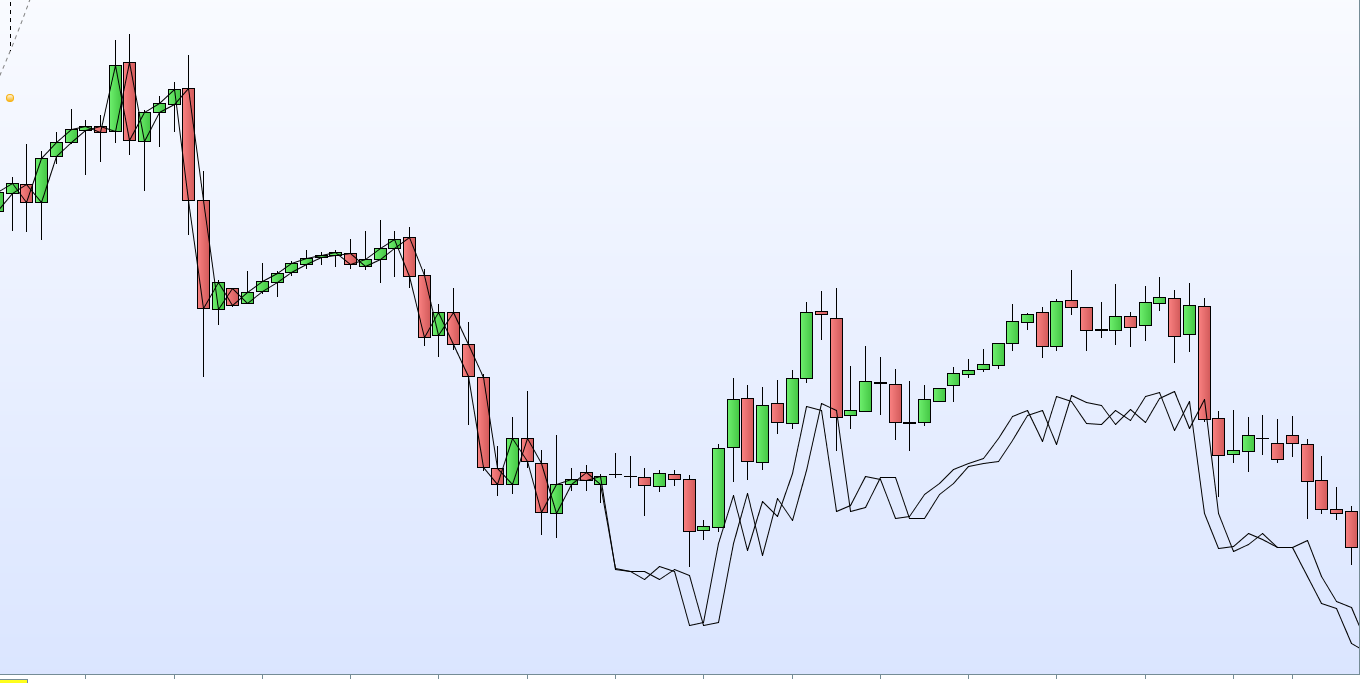
I added it in the graph and you can see in the picture attached how both values (OPEN and CLOSE) are correct and then get wrong, and continue wrong for a year o so. This is DOW TF1h from December-2011
Anybody else has checked to see if it happen also to them?
This really freaks me out, if so key values are wrong… at least it´s just for limited periods but anyway…
Anybody else has checked to see if it happen also to them?
What value is needed for Close > … in order to see if I get same as you?
IF CLOSE>99999 THEN
Is the difference you are seeing related to mid price and spread??
Maybe for those periods showing the Issue that spread was added / subtracted etc??
Just a thought anyway.
Hi Grahal,
Because of your questions it seems I explained myself VERY bad about the issue 🙂 Let me try again…
- I found that for limited periods of time the value of the default CLOSE function we use in our systems could be wrong. This means that for example you put in your system… “SET STOP LOSS 0.1*CLOSE”, the value for calculating this STOP is wrong because the value of this CLOSE function is wrong.
- The only purpose of the system I attached (PRUEBA-CLOSE) is to draw the value of CLOSE in the graphic so you can see if their values are correct. The first part you ask me about (CLOSE>9999) doesn´t matter, I put whatever thing to make the system work and to see the lines with the value of CLOSE. “GRAPHONPRICE CLOSE” is the only part that matters.
- Please do the backtest of this system (PRUEBA-CLOSE) for DOW TF1h, you will see the values of CLOSE and OPEN draw in the graphic as lines and please check if this values are correct at the begining of 2012. As you can see in the picture attached in my case this values are incorrect and I want to know if more people has the same issue or is just me.
Thanks mate
I explained myself VERY bad
No you didn’t, but I thought I was missing the point because you chose Close > 99999 … that gave no trades at all. 🙂
Also it needs cumulateorders = False else the Algo blows the bank! 🙂
Anyway I used below on Daily as even 4 hour TF at 100k bars only goes back to 2016 … I guess 4 years is the limit on v10.3 for hours TF??
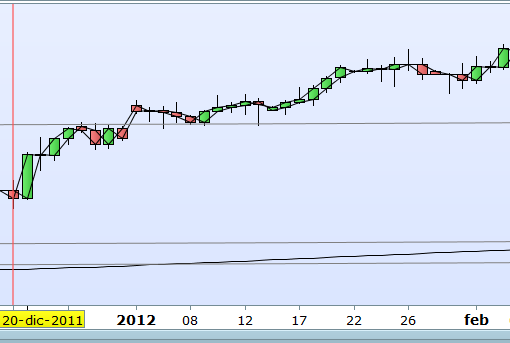
So attached is the result on Daily for Jan 2012.
What do you see on Daily?
DEFPARAM CUMULATEORDERS = False

IF CLOSE>99 THEN
BUY 1 CONTRACT AT MARKET
ENDIF

GRAPHONPRICE CLOSE
GRAPHONPRICE OPEN
Grahal,
I checked and for TF4h the issue with the CLOSE value persist, but NOT in TF1D (see images attached)
So if you can only see from 2016 in TF of hours and the issue seem to happen before April´2012 you can´t check it. Thanks anyway for try mate 🙂
Anyone can check the 2012 in TF1h?
I guess I will have to backtest only from mid 2012 because I don´t trust the prior data
Don’t worry ITF is on the way to find a solution to fix that curious problem.