Hi,
I am using 1h timeframe for the chart but using daily timeframe to calculate daily returns e.g.
On 1h chart
timeframe(daily, updateonClose)
DailyVolatility = STD[252](close)
timeframe(default)
but the results are not consistent.
My objective is the following:
I want to calculate daily volatility of an instrument based on last 252 days but running in lower timeframe as I need candle closures at specific times of the day which I cannot do on daily TF. Anyway even If i run above code on daily timeframe, the result seems to be wrong.
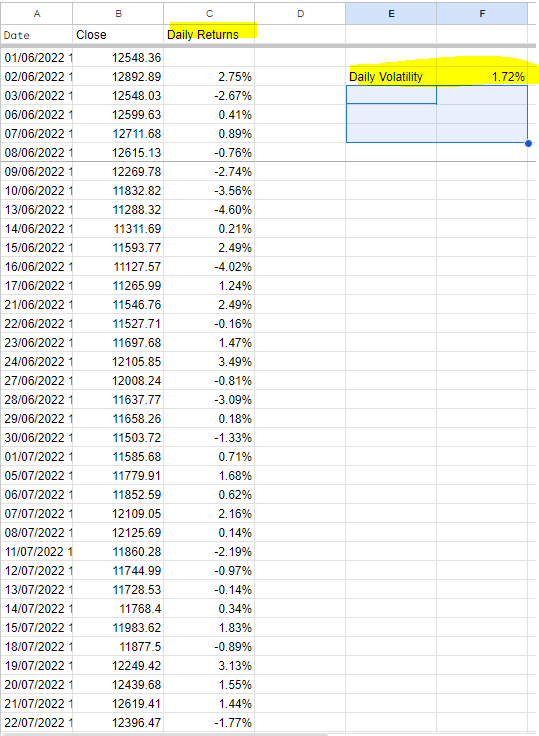
From excel, I’ve the following:
- Get daily closes for last 252 days/candles ==> DailyClosesArray
- Get daily returns e.g. Close(i+1)/Close(i) – 1 ==> DailyReturnsArray
- DailyVolatility = stddev (DailyReturnsArray)
Initially I thought If I just do above mentioned PRT code, I can achieve same but it seems to be not working. Do you’ve any suggestion/solution in mind please?
Thanks and really appreciated.
Ash
 JS
JSParticipant
Veteran
Hi,
DailyVolatility = Std[252](Close) is the standard deviation over the last 252 days (TF Daily) so you calculate the standard deviation over a time period of a (trade) year.
The daily returns can be calculated with the daily time frame:
DailyReturn = (Close – Close[1]) is the difference in “Close” between today and yesterday (in points)
DailyReturn% = (Close-Close[1])/Close[1]*100 (DailyReturn in %)
The standard deviation of the “DailyReturn” over the last 252 trading days:
DailyReturnVolatility = Std[252](DailyReturn%)
TimeFrame(Daily, UpdateOnClose)
DailyReturn = (Close-Close[1])/Close[1]*100 //DailyReturn in %
DailyReturnVolatility = Std[252](DailyReturn) //Standaard deviation of the DailyReturn based on 252 trading days

Return DailyReturn as "DailyReturn", DailyReturnVolatility as "DailyReturnVolatility"
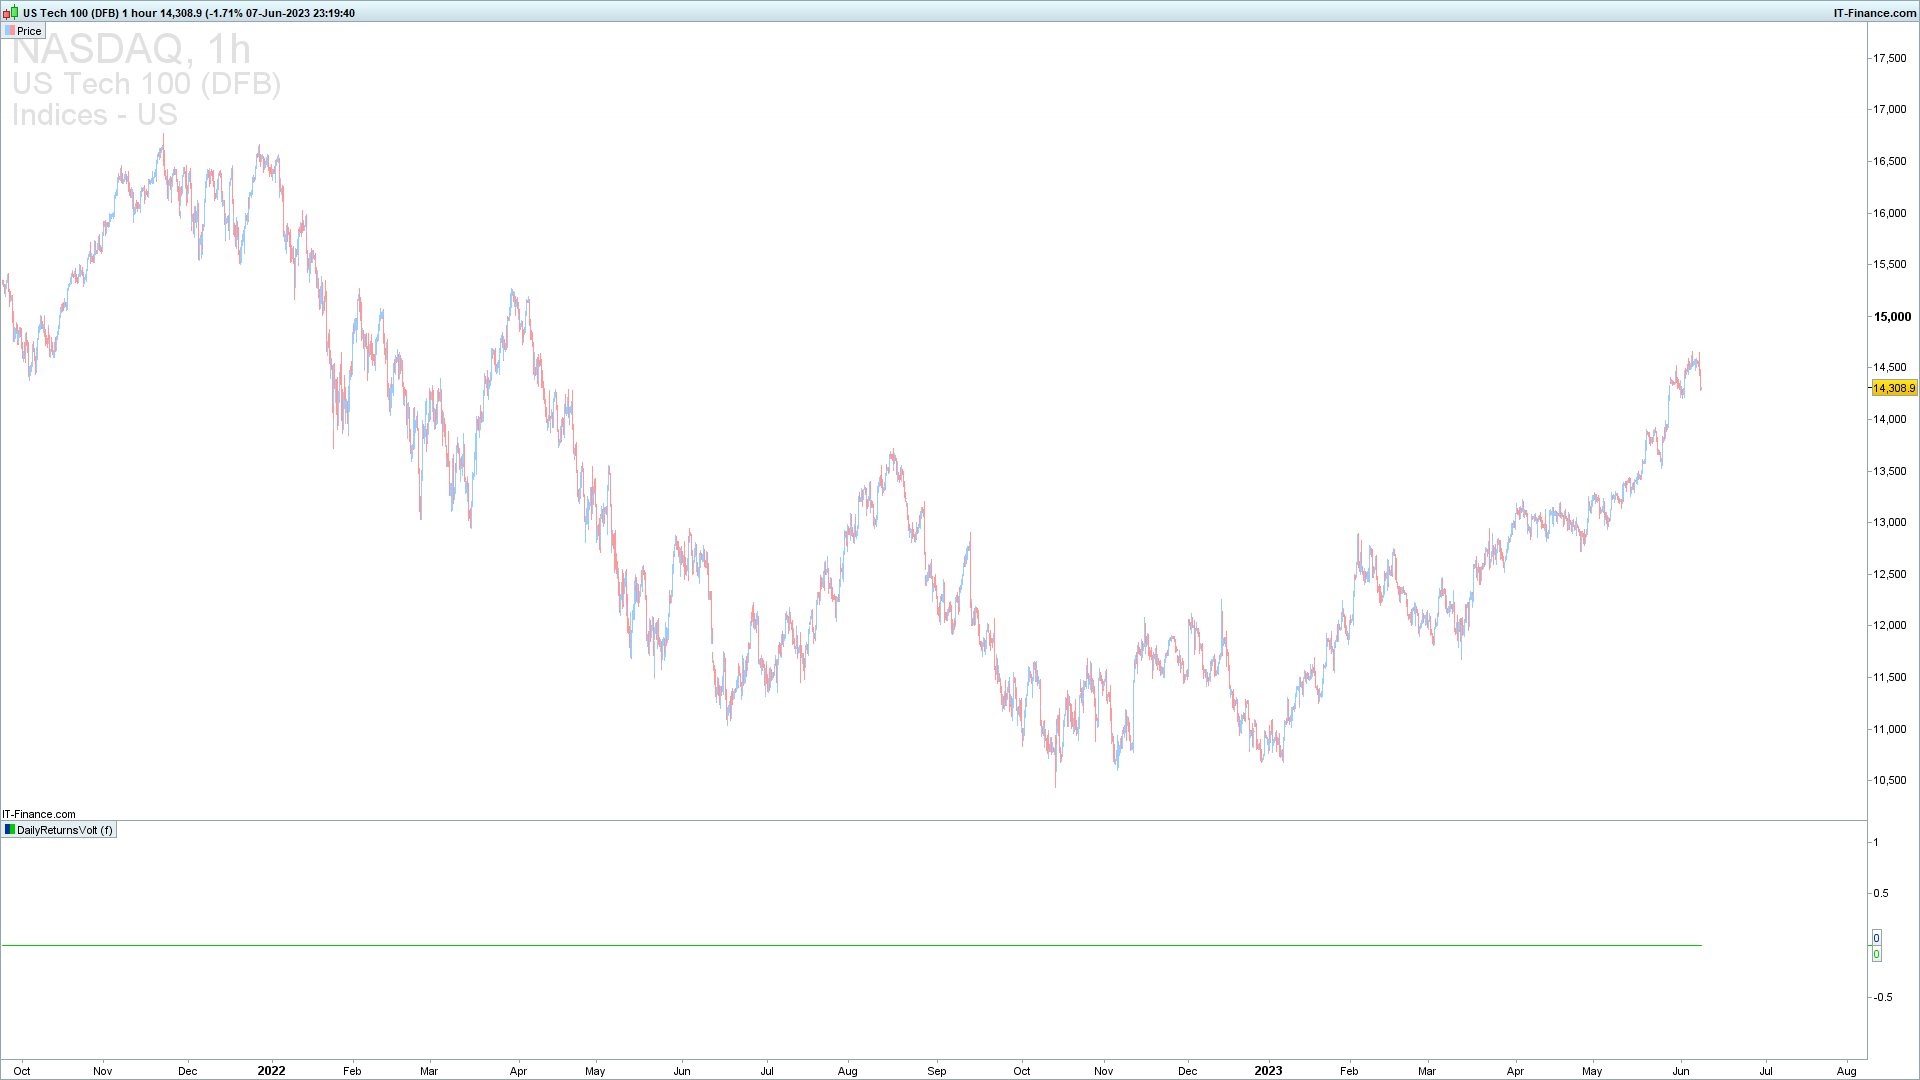
Thanks. But the problem is how can I get accurate values on 1h timeframe. It never computes properly.
The chart attached is 1h while the bottom shows the DailyReturnVolt indicator using below code:
TimeFrame(Daily, UpdateOnClose)
DailyReturn = (Close-Close[1])/Close[1]*100 //DailyReturn in %
DailyReturnVolatility = Std[252](DailyReturn) //Standaard deviation of the DailyReturn based on 252 trading days

Return DailyReturn as "DailyReturn", DailyReturnVolatility as "DailyReturnVolatility"
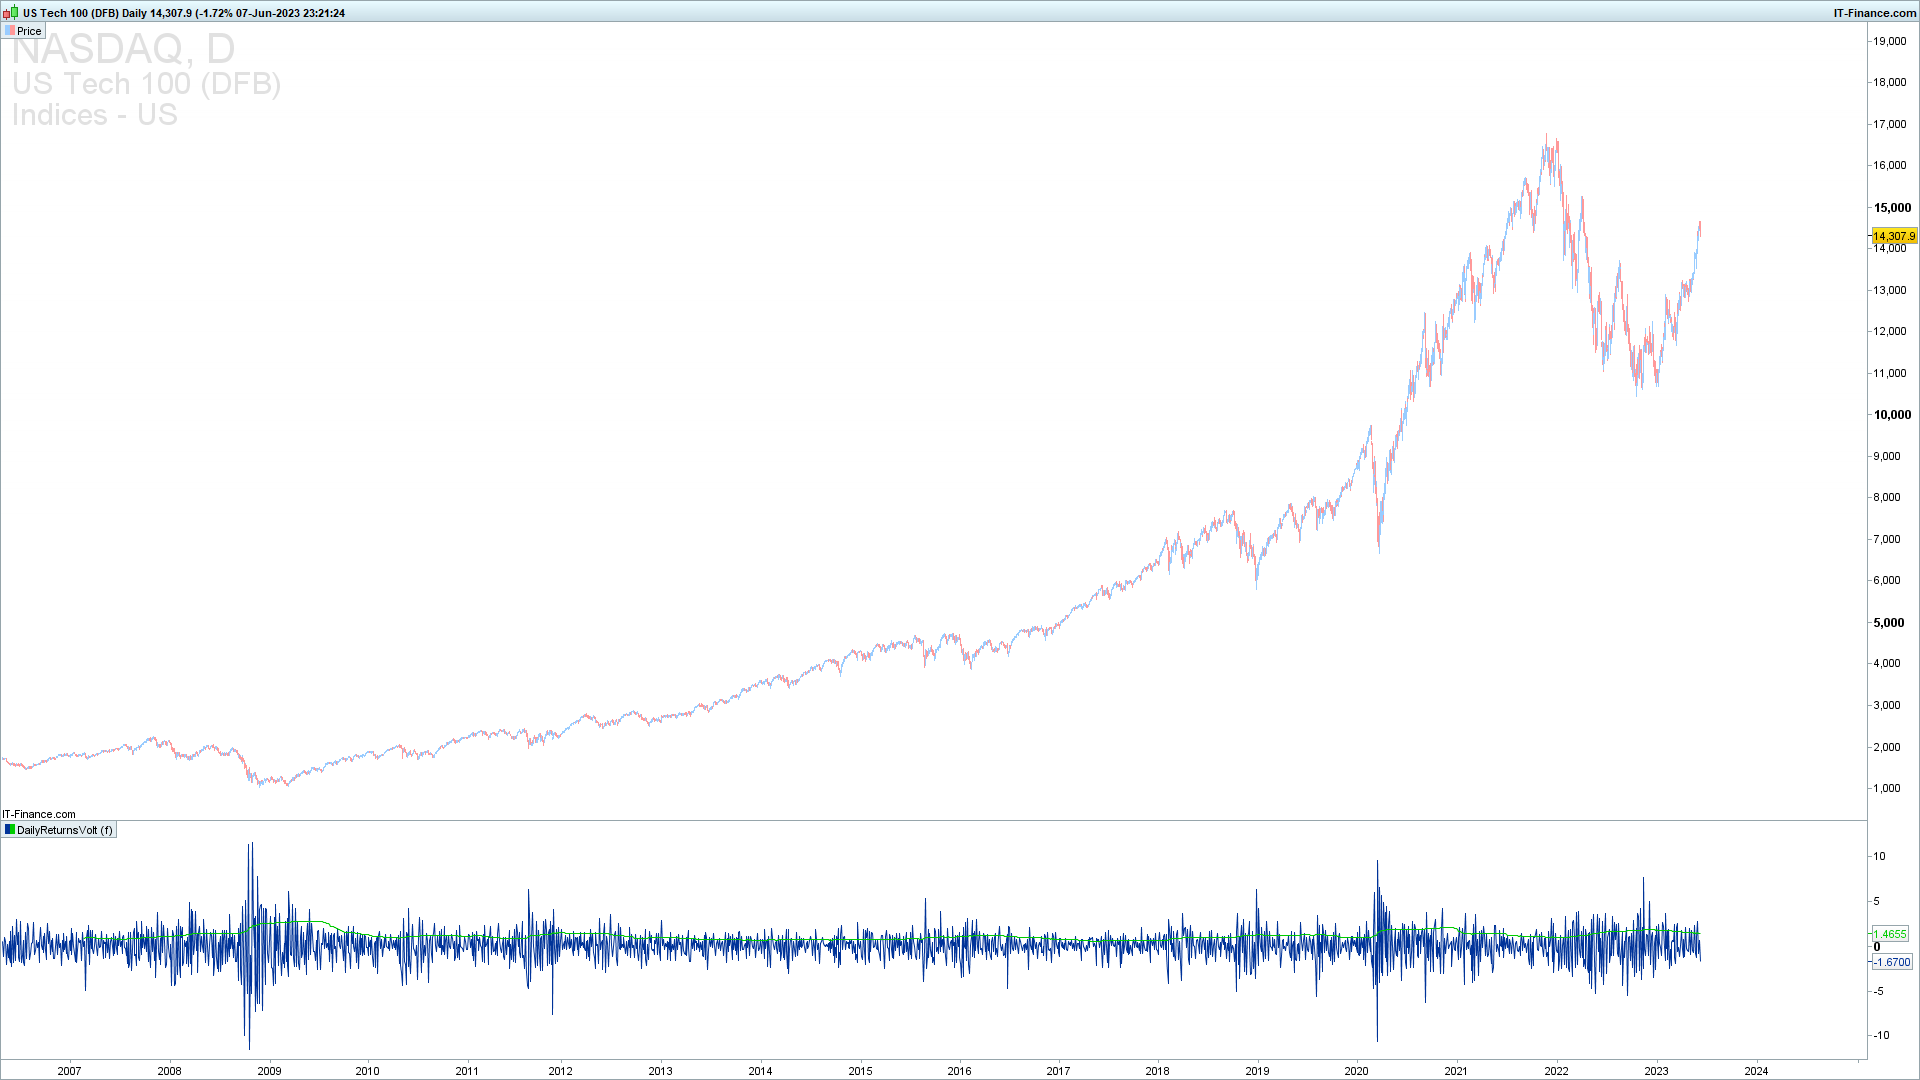
Now If I change chart interval to daily, it returns the values which is understandable but this isn’t what I want, I want same result on lower tf.
Since one day is 24 hours, 252 trading days require at least 252*24 (i.e. over 6K) 1-hour units on the chart. If you have chosen less than those required, result may not be as inaccurate.
Please ignore the attachments as they got posted.
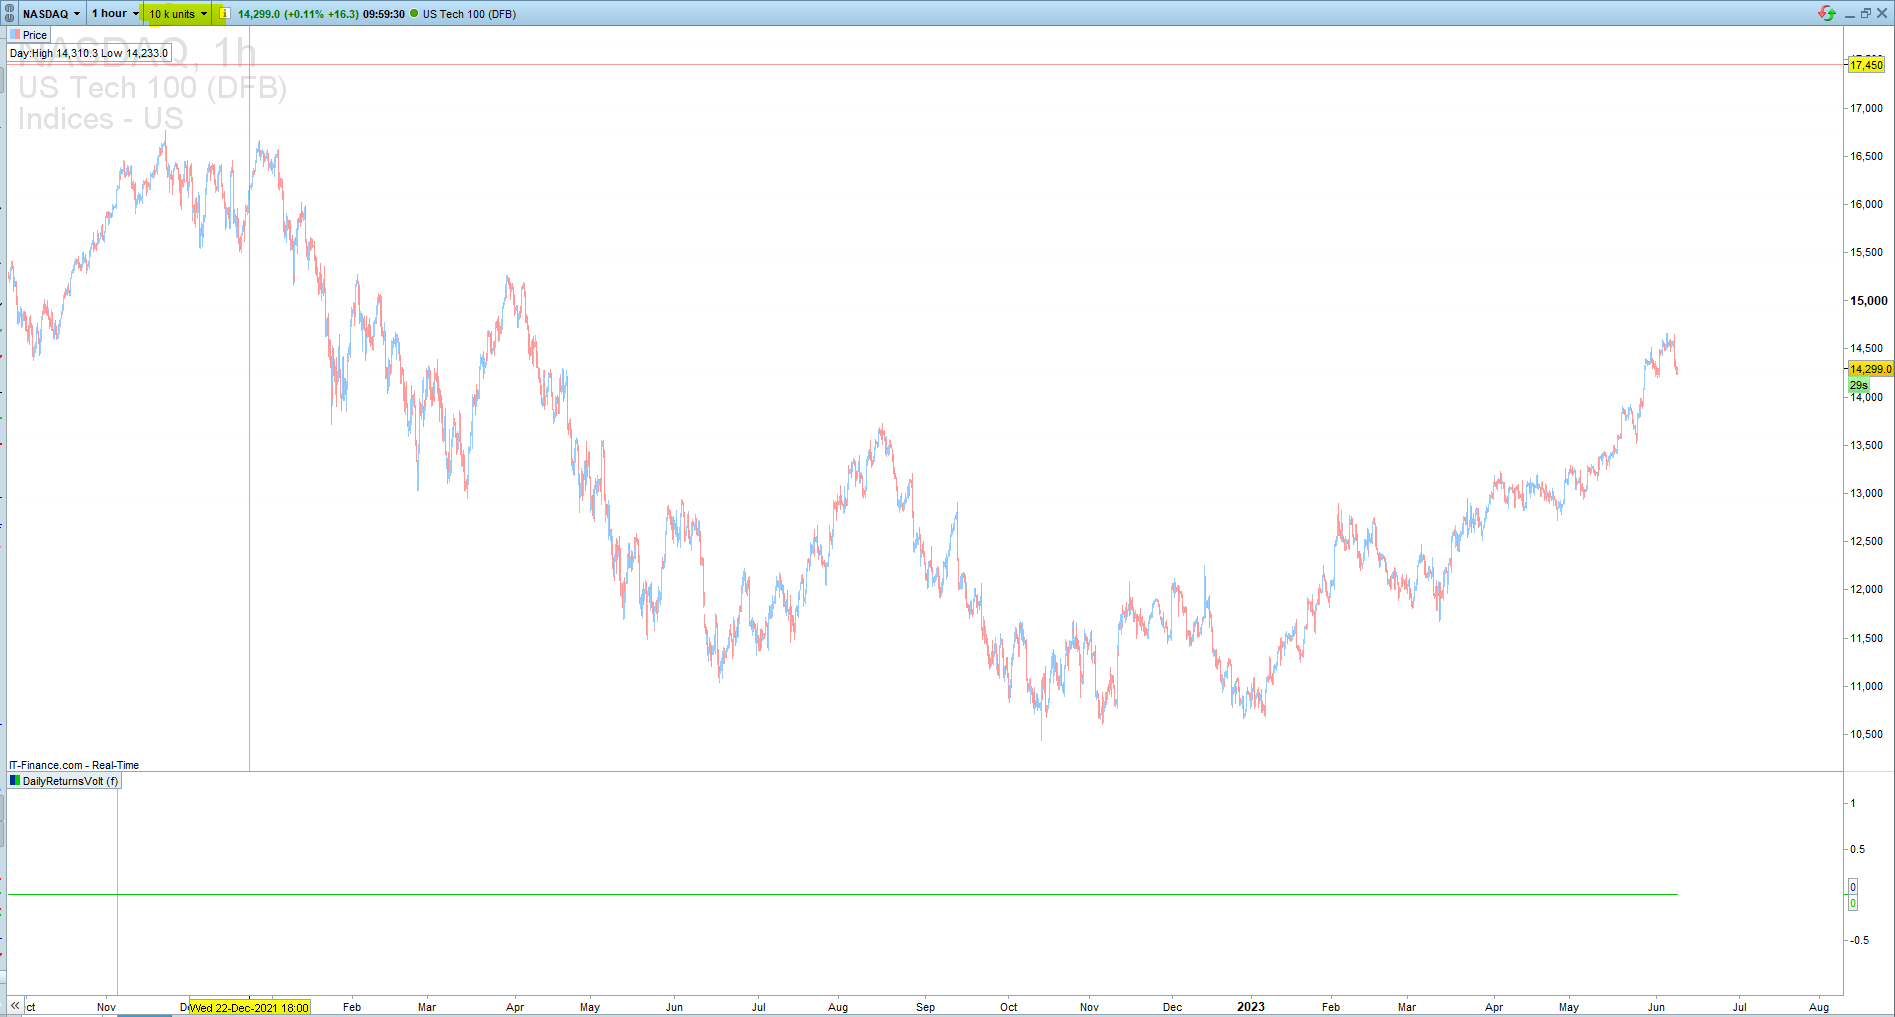
I know that I need to have these many not only on the chart but I also use “defparam CALCULATEONLASTBARS=8000” but still I’m unable to get the results and that was the reason of my earlier post.
see attachment where I’ve highlighted the 10K units and also the code below for the indicator
defparam drawonlastbaronly=true
defparam CALCULATEONLASTBARS=8000

TimeFrame(Daily, UpdateOnClose)
DailyReturn = (Close-Close[1])/Close[1]*100 //DailyReturn in %
DailyReturnVolatility = Std[252](DailyReturn) //Standaard deviation of the DailyReturn based on 252 trading days
TimeFrame(Default)

Return DailyReturn as "DailyReturn", DailyReturnVolatility as "DailyReturnVolatility"
While it works properly on DAX 1-hour timeframe, it is not on NASDAQ with “updateonclose” but do without it.
Here is the code i’m using:
TimeFrame(Daily)
DailyReturn = (Close-Close[1])/Close[1]*100 //DailyReturn in %
DailyReturnVolatility = Std[252](DailyReturn) //Standaard deviation of the DailyReturn based on 252 trading days

Return DailyReturn as "DailyReturn", DailyReturnVolatility as "DailyReturnVolatility"
I’m ok to use updateonClose as it is returning some values now e.g.
My DailyReturnsVolt indicator is like below:
defparam CALCULATEONLASTBARS=10000

TimeFrame(Daily, UpdateOnClose)
YesterDailyReturn = (Close[1]-Close[2])/Close[2]*100 //DailyReturn in %
DailyReturnVolatility = Std[252](YesterDailyReturn) //Standaard deviation of the DailyReturn based on 252 trading days
TimeFrame(Default)

Return YesterDailyReturn as "DailyReturn", DailyReturnVolatility as "DailyReturnVolatility"
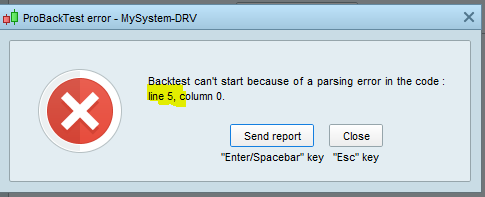
I tried above code in my automated trading test and it gives error on line 5 (which is the “TimeFrame(Daily, UpdateOnClose)”) line from the above indicator. Below is a simple test and it fails.
// Conditions to enter long positions
myDailyReturn, myDailyReturnVolatility = CALL "DailyReturnsVolt"[0, 2]

if time = 220000 then
cashclose = close
endif

myLong1 = cashclose * (1 - myDailyReturnVolatility/4/100)

IF NOT LongOnMarket then // AND YourConditions THEN
BUY 1 CONTRACTS AT myLong1 limit
SET STOP LOSS 40
SET TARGET PROFIT 60
ENDIF
Above fails with parsing error on line 5 (basically timeframe(daily…)) from the indicator. See attached.