A request that was addressed to ProRealTime:
It would be great if you could help me with a customised indicator I need.
I’m looking for a customised pivot indicator (on price).
– As a starting point the default indicator on the system is fine with standard pivot levels based on yesterdays data, eg P+([H+L+C]/3), R1=(2*P)-L etc
– In addition I need 2 additional horizontal lines placed above and below the ‘P’ line I will describe as the ‘TC’/top channel and ‘BC’ bottom channel.
– These are again both based on yesterdays data.
– The ‘TC’ sits horizontally >P and <R1 and is defined as (P-BC)+P
– The ‘BC’ sits horizontally <P and >S1 and is defined as (H+L)/2
– Core priority is for a daily setting but ideally option for weekly and monthly timeframe
As well :
– ideally option for colour code or if easier to be pre set, eg for TC and BC to both be dotted blue lines or a shaded box?
– Sunday open data to be merged into Monday
– As with default pivot indicator I need to be able to display more than one time period at the same time, eg ‘today’ Mon 1 May (based on Fri 29 data) and ‘yesterday’ Fri 29 (based on Thurs 28 data) etc
– Also need the actual numbers to be displayed on the chart or cursor?
Many thanks
Suggestion for an answer:
- Adding texts, shaded boxes etc is only possible with version 10.3 (this request has not been taken into account for this reason)
- This indicator has to be added directly on the price chart and load at least a month’s historical data
- You can adjust style and line types by clicking on wrench icon (v10.3 will also allow to pre-set line styles in the code)
//Pivot calculation method
Once mode = 1

Once dailyPivot = undefined
Once dailyR1 = undefined
Once dailyS1 = undefined
Once dailyR2 = undefined
Once dailyS2 = undefined
Once dailyR3 = undefined
Once dailyS3 = undefined

Once lastWeekBarIndex = 0
Once weeklyHigh = undefined
Once weeklyLow = undefined
Once weeklyPivot = undefined
Once weeklyR1 = undefined
Once weeklyS1 = undefined
Once weeklyR2 = undefined
Once weeklyS2 = undefined
Once weeklyR3 = undefined
Once weeklyS3 = undefined

Once lastMonthBarIndex = 0
Once monthlyHigh = undefined
Once monthlyLow = undefined
Once monthlyPivot = undefined
Once monthlyR1 = undefined
Once monthlyS1 = undefined
Once monthlyR2 = undefined
Once monthlyS2 = undefined
Once monthlyR3 = undefined
Once monthlyS3 = undefined

If Day>Day[1] then
   If mode = 0 then
      dailyPivot = (DHigh(1) + DLow(1) + Close[1]) / 3
   Elsif mode = 1 then
      dailyPivot = (Open + DHigh(1) + DLow(1) + Close[1]) / 4
   Elsif mode = 2 then
      dailyPivot = (DHigh(1) + DLow(1) + Close[1]*2) / 4
   Else
      dailyPivot = (Open*2 + DHigh(1) + DLow(1)) / 4
   Endif
   dailyR1 = 2*dailyPivot - DLow(1)
   dailyS1 = 2*dailyPivot - DHigh(1)
   dailyR2 = dailyPivot + (DHigh(1) - DLow(1))
   dailyS2 = dailyPivot - (DHigh(1) - DLow(1))
   dailyR3 = dailyR1 + (DHigh(1) - DLow(1))
   dailyS3 = dailyS1 - (DHigh(1) - DLow(1))
Endif

If DayOfWeek<DayOfWeek[1] then
   weeklyHigh = Highest[BarIndex - lastWeekBarIndex](High)[1]
   weeklyLow = Lowest[BarIndex - lastWeekBarIndex](Low)[1]
   lastWeekBarIndex = BarIndex

   If mode = 0 then
      weeklyPivot = (weeklyHigh + weeklyLow + Close[1]) / 3
   Elsif mode = 1 then
      weeklyPivot = (Open + weeklyHigh + weeklyLow + Close[1]) / 4
   Elsif mode = 2 then
      weeklyPivot = (weeklyHigh + weeklyLow + Close[1]*2) / 4
   Else
      weeklyPivot = (Open*2 + weeklyHigh + weeklyLow) / 4
   Endif
   weeklyR1 = 2*weeklyPivot - weeklyLow
   weeklyS1 = 2*weeklyPivot - weeklyHigh
   weeklyR2 = weeklyPivot + (weeklyHigh - weeklyLow)
   weeklyS2 = weeklyPivot - (weeklyHigh - weeklyLow)
   weeklyR3 = weeklyR1 + (weeklyHigh - weeklyLow)
   weeklyS3 = weeklyS1 - (weeklyHigh - weeklyLow)
Endif

If Month<>Month[1] then
   monthlyHigh = Highest[BarIndex - lastMonthBarIndex](High)[1]
   monthlyLow = Lowest[BarIndex - lastMonthBarIndex](Low)[1]
   lastMonthBarIndex = BarIndex

   If mode = 0 then
      monthlyPivot = (monthlyHigh + monthlyLow + Close[1]) / 3
   Elsif mode = 1 then
      monthlyPivot = (Open + monthlyHigh + monthlyLow + Close[1]) / 4
   Elsif mode = 2 then
      monthlyPivot = (monthlyHigh + monthlyLow + Close[1]*2) / 4
   Else
      monthlyPivot = (Open*2 + monthlyHigh + monthlyLow) / 4
   Endif
   monthlyR1 = 2*monthlyPivot - monthlyLow
   monthlyS1 = 2*monthlyPivot - monthlyHigh
   monthlyR2 = monthlyPivot + (monthlyHigh - monthlyLow)
   monthlyS2 = monthlyPivot - (monthlyHigh - monthlyLow)
   monthlyR3 = monthlyR1 + (monthlyHigh - monthlyLow)
   monthlyS3 = monthlyS1 - (monthlyHigh - monthlyLow)
Endif


Return dailyPivot as "Daily P", dailyR1 as "Daily R1", dailyS1 as "Daily S1", dailyR2 as "Daily R2", dailyS2 as "Daily S2", dailyR3 as "Daily R3", dailyS3 as "Daily S3", weeklyPivot as "Weekly P", weeklyR1 as "Weekly R1", weeklyS1 as "Weekly S1", weeklyR2 as "Weekly R2", weeklyS2 as "Weekly S2", weeklyR3 as "Weekly R3", weeklyS3 as "Weekly S3", monthlyPivot as "Monthly P", monthlyR1 as "Monthly R1", monthlyS1 as "Monthly S1", monthlyR2 as "Monthly R2", monthlyS2 as "Monthly S2", monthlyR3 as "Monthly R3", monthlyS3 as "Monthly S3"
This indicator is a so requested one, that I will post it in the library for future purposes! Thanks Henry.
I also add the file for download attached to this post.
Hi
Thanks for the great code. 2 Questions though…
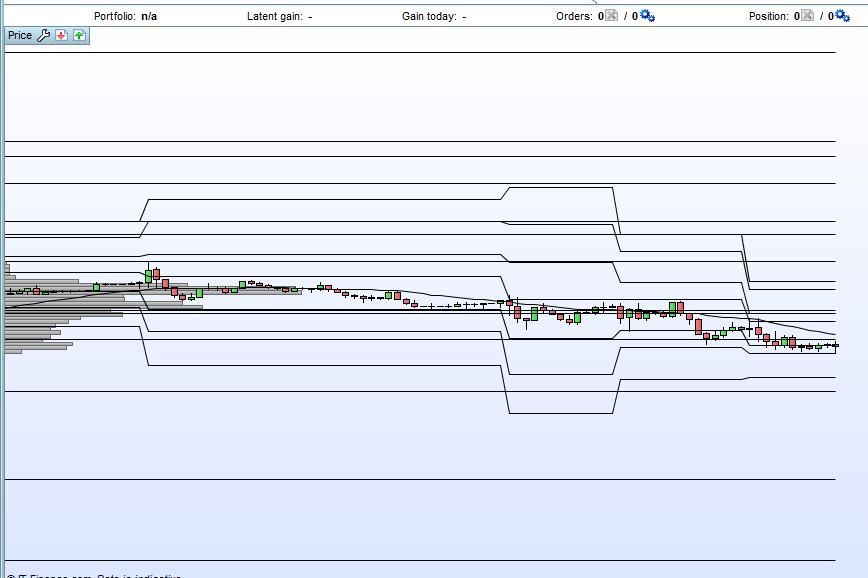
- Please see attached file. When opening a chart, the price action is compressed to show all the pivot data points. How can that be fixed in the code? It would be tedious to scroll / adjust the price column all the time?
- Day on Day / Week on Week and Month on Month pivots are linked with a line. It would be so much cleaner if the pivots are not ‘attached’ to each other. In other words if yesterday’s pivot was 3456 and today it is 3476 then there is not a line linking the daily pivots. It gives a jagged result and makes the chart look cluttered. I hope that makes sense.
Thanks and regards
Thanks for the reply Nicolas. I’m still finding my way in coding. How do I set the pivots to dots so that the continuous link can be broken (or better even – disappear)? Going through threads for examples but not finding any
You don’t need to recode anything, you can modify the type of any lines to dots in the indicator parameters window.